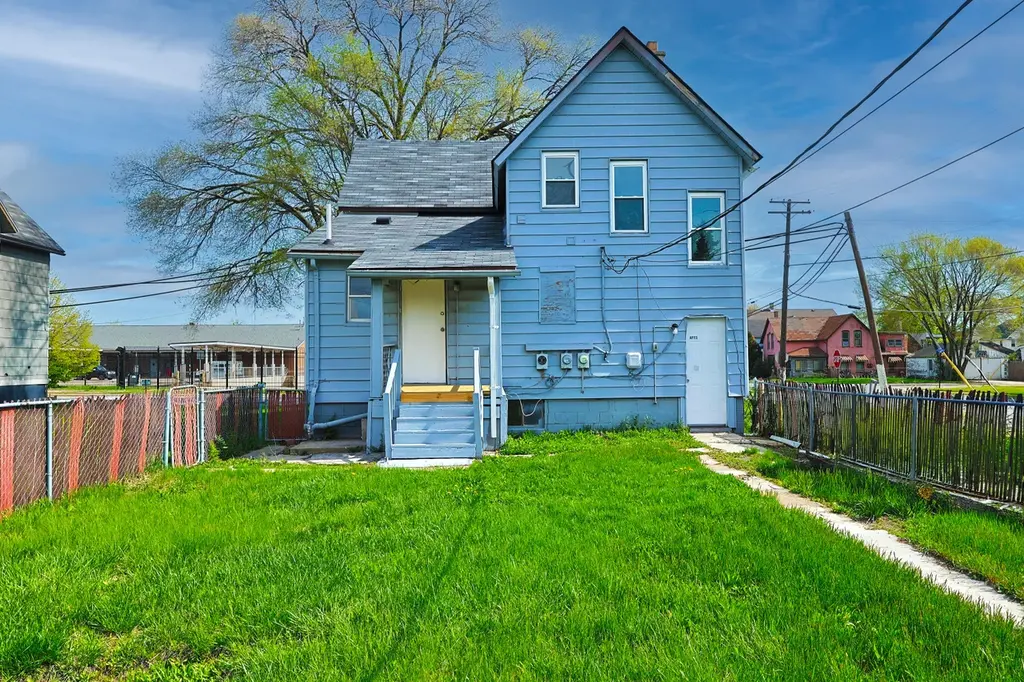
28 E Henry St · River Rouge, MI
Flood risk 6/10 · Moderate
- FEMA flood zone
- X (unshaded)
- Chance of flooding over 30 yrs
- 0.69%
- Est. flood insurance / yr
- $473 – $860
Fire risk 1/10 · Minimal
- Est. fire insurance / yr
- $784 – $1,456
Heat risk 3/10 · Minor
- Hot days now (above 95°F)
- 7 days/yr
- Hot days in 30 yrs
- 15 days/yr
Wind risk 2/10 · Minimal
- Chance of severe wind over 30 yrs
- —
Air-quality risk 4/10 · Minor
- Unhealthy air days now
- 6 days/yr
- Unhealthy air days in 30 yrs
- 8 days/yr
Risk factors via First Street. Map © Google.
Why this score? — see what drove the D- grade
The composite is a weighted blend of 9 inputs, each scored 0–100. Each bar is that input's sub-score; the figure is the points it added to the 100-point composite (weight × sub-score).
- Cash flow +10.7/30.0
- Appreciation +10.0/10.0
- Livability +3.2/5.0
- DSCR +3.1/10.0
- 1% rule +3.0/10.0
- Rent growth +2.5/5.0
- Condition / age +2.5/5.0
- ARV discount +2.4/15.0
- Schools +0.5/10.0
$120,000
🖨 Deal sheet 📄 Offer letter ✓ Due diligence
Listing remarks MLS
Endless possibilities await! Bring your ideas and vision to transform this property into your dream home or investment opportunity. Previously configured as a 4-unit property and now reconfigured into a 2-unit layout, this home offers flexibility for owner-occupants or investors alike. Live in one unit while letting a tenant help pay half your mortgage, or explore the potential for future income opportunities. A rare chance to build equity and create something truly special! Freshly painted throughout, new flooring and new gas furnace.
Key facts
- 2 unit layout
- New flooring
- 4 unit property
Tags
Property features AI
Exterior
- Utilities: Natural gas connected
- Home design: Single-family residence; Residential property
- Construction: Built in 1910; Aluminum siding; Asphalt shingle roof
- Exterior features: Paved road access; Public water
Interior
- Bathrooms: 2 full bathrooms
- Heating & cooling: Forced air heating
- Interior features: 8 total rooms; Full basement
Neighborhood map
What this means for you Summary
Snapshot
- This is a 3-bed/4.0-bath single-family listed at $120k.
Deal economics
- At list price, monthly cash flow is $-57 ($-689/yr) — negative.
- To cash-flow at today's rent, offer at most $110k (8.4% below list).
- To meet the 1% rule (rent ≥ 1% of price), the offer needs to be $96k (20.0% below list).
- Recommended offer: $96k (20.0% below list) — sets the bar for 1% rule.
- Cap rate 5.7% vs local median 8.1% in River Rouge — below-typical yield; the buyer is paying a premium for something (appreciation thesis, condition, location) that the cap rate doesn't capture.
Location & tenants
- Location reads 65/100 on livability (#454 in MI) — a middle-class / working-renter tenant base. Strengths: commute A+, cost of living A+, housing B+; Watch: health & safety D, schools F, crime F.
- River Rouge School District (suburban): math 3% / reading 12% proficiency, ranked #535 of 540 in MI (top 99%) — low school quality limits family demand, transient renter base, plan for 1-2y turnover; 89% free/reduced lunch — lower-income household profile, screen leases tightly.
- Market conditions: 58 active listings in the ZIP; 5 comparable units currently listed for rent nearby; rentals at typical pace (median 24d on market — plan ~3-4 weeks tenant-placement turnaround); 2,639 units permitted in Wayne County in 2024 (1,216 in 5+ unit buildings).
Forward outlook
- In year one you build about $13k of equity ($830 loan paydown + $12k appreciation (10.0% local appreciation)).
- Wayne County population projected at -17% by 2050 — secular population decline; favor cash flow + early exit over multi-decade hold.
- At projected returns (10.0% appreciation + 3.0% rent growth), your $34k cash investment doubles in ~3 years — after that, you're playing with house money.
- By year 3, paydown + projected appreciation supports a ~$32k cash-out refi (75% LTV) — recoverable capital for the next deal without selling this one.
Negotiation context
- It's been on market 30 days — a 2% lower offer ($118k) is reasonable based on typical stale-listing flexibility.
- 11 sale attempts since 19y ago; this cycle's ask has dropped $20k (14%) from the opening price — seller is motivated, your offer sets the floor, not the list.
- Current owner paid $74k; list at $120k implies a 63% gain — meaningful room to come down on a strong offer.
Risks & watch-outs
- Watch-outs: built in 1910 — expect roof / HVAC / electrical / plumbing capex.
- Climate carrying-cost: major flood risk — expect insurance premiums to compound above CPI over the hold.
Questions for the listing agent
- What do current leases actually rent for vs. the listed asking? Can we see a recent rent roll and the last 12 months of T-12 income?
- Built in 1910 — when were the roof, HVAC, electrical panel, plumbing, and water heater last replaced?
- Is there a deadline driving the sale (1031 exchange, divorce, estate, relocation)? That informs how much negotiation room exists.
- Schools are F-rated, which usually means shorter tenancies and higher turnover. Who's the typical renter profile here, and what's been the actual vacancy rate?
- Crime grade is F in this area — have there been break-ins, vandalism, or insurance claims at this property in the last 3 years? What carrier currently insures it and at what premium?
- The area grade is low — what's the realistic commute time and amenity access for the typical tenant pool here? Any planned neighborhood developments (good or bad) we should know about?
- What's the average days-on-market for RENTAL listings here right now (not sales)? A rising rental-DOM trend means longer vacancies and softer asking-rent achievability than the comps imply.
- What's the recent tenant-quality profile in this submarket — average credit score on applications, eviction rate, late-payment / NSF rate, and stable-employment percentage? A property-management company in the area should have these aggregated.
- How much new for-sale + rental construction is in the pipeline within 1–3 miles? Heavy new supply typically softens prices + rents 12–24 months out; constrained supply supports both.
Investment metrics
- 1% rule
- 0.80% ✗
- Cap rate
- 5.72%
- Cash-on-cash
- -2.05%
- DSCR
- 0.91
- GRM
- 10.4
CMA / ARV
- ARV (on-the-fly)
- $107,730
- Comps found
- 12
Show comp detail 12 sales within ~0.75 mi
| Address | Dist | Beds/Ba | Sqft | Sold | Price | $/sf | Match |
|---|---|---|---|---|---|---|---|
| 123 Burke St | 0.21mi | 4/1.0 (+1) | 1,032 (+1%) | 1mo | $45,625 | $44 | 71 |
| 42 E Henry St | 0.05mi | 3/1.0 | 916 (-11%) | 0mo | $115,000 | $126 | 67 |
| 111 Burke St | 0.25mi | 2/1.0 (-1) | 1,000 (-2%) | 5mo | $24,000 | $24 | 63 |
| 349 Frazier St | 0.66mi | 3/2.0 | 1,036 (+1%) | 2mo | $120,000 | $116 | 58 |
| 294 Richter St | 0.48mi | 3/1.0 | 1,056 (+3%) | 6mo | $123,000 | $116 | 56 |
| 251 Richter St | 0.43mi | 3/1.0 | 974 (-5%) | 5mo | $87,700 | $90 | 55 |
| 285 Campbell St | 0.59mi | 3/1.0 | 1,029 (+0%) | 6mo | $125,000 | $121 | 55 |
| 235 Goodell St | 0.46mi | 3/1.5 | 1,092 (+6%) | 4mo | $147,000 | $135 | 54 |
| 235 Richter St | 0.41mi | 3/1.0 | 1,152 (+12%) | 1mo | $45,625 | $40 | 47 |
| 251 Beechwood St | 0.44mi | 3/1.0 | 1,150 (+12%) | 4mo | $30,000 | $26 | 44 |
| 287 Richter St | 0.48mi | 3/1.0 | 1,140 (+11%) | 6mo | $120,000 | $105 | 42 |
| 319 Polk Ave | 0.52mi | 2/1.0 (-1) | 912 (-11%) | 6mo | $38,500 | $42 | 35 |
Match score weights: distance 35% · size 25% · config 20% · recency 20%. Top-matched comps best support the ARV.
Projected returns pro-forma
10.0% appreciation · 3.0% rent growth · sell at horizon
- IRR
- 22.8%
- Equity multiple
- 2.84×
- Total profit
- $61,707
- Equity at exit
- $108,106
- IRR
- 20.4%
- Equity multiple
- 6.49×
- Total profit
- $184,604
- Equity at exit
- $233,134
Cash invested: $33,600 (down + closing). Projections, not guarantees.
Landlord ↔ Tenant lean methodology
- Overall (STATE)
- 62 Landlord-Friendly
- State Michigan
- 62 Landlord-Friendly · EVEN
- County
- — inherits STATE
- City
- — inherits STATE
ZIP-level market 48218
- Home prices YoY
- 28.4%
- Active inventory
- 58
- Price-to-rent
- 10.4×
Monthly cashflow live
- Estimated rent
- $961 high interval (Pro) →
- Mortgage (P&I)
- −$629
- Tax from tax record
- −$137 /mo · $1,643/yr
- Insurance
- −$50
- HOA
- −$0
- Vacancy / Maint / Mgmt
- −$202
- Net cashflow
- $-57
Break-even live
UW: 25.0% down · 7.5% · 30yr · 1.5% tax · 5.0% vac · 8.0% maint · 8.0% mgmt
Financing live
Cash to close
- Down payment
- $30,000
- Closing costs
- $3,600
- Reserves months
- —
- Total cash needed
- —
Loan-product check · same deal, 3 products live
Conventional
25% down · 7.5% · 30yr
- Down + closing
- —
- Monthly P&I
- —
- Monthly cashflow
- —
- DSCR
- —
- Eligible?
- —
Personal DTI + credit; lowest rate.
DSCR
20% down · 8.5% · 30yr
- Down + closing
- —
- Monthly P&I
- —
- Monthly cashflow
- —
- DSCR
- —
- Eligible?
- —
No personal income docs; deal must DSCR.
Hard money
10% down · 12.0% · 12mo
- Down + closing
- —
- Monthly P&I
- —
- Monthly cashflow
- —
- DSCR
- —
- Eligible?
- —
Short-term bridge; refi at stabilization.
Rent comps 5 comps
| Address | Beds | Baths | Sqft | Rent | $/sqft | DOM | Units | Dist |
|---|---|---|---|---|---|---|---|---|
| 17 W James St Unit 17 W James Lower River Rouge, MI | 2.0 | 1.0 | 900 | $950 | $1.06 | 14d | 1 | 0.19mi |
| 97 Batavia St Unit 1 River Rouge, MI | 2.0 | 1.0 | 900 | $825 | $0.92 | 24d | 1 | 0.24mi |
| 1139 S Bassett St Detroit, MI | 3.0 | 1.0 | 927 | $1,120 | $1.21 | 43d | 1 | 0.54mi |
| 1139 S Bassett St Detroit, MI | 3.0 | 1.0 | 927 | $1,050 | $1.13 | 24d | 1 | 0.54mi |
| 3801 18th St Ecorse, MI | 3.0 | 1.0 | 1196 | $1,150 | $0.96 | 17d | 1 | 1.31mi |
Listing history 41 events
-
2026-06-18days on market $120,000 Active 30 DOM
-
2026-06-17price $120,000 Active 29 DOM
-
2026-06-17days on market $130,000 Active 29 DOM
-
2026-06-16days on market $130,000 Active 28 DOM
-
2026-06-15days on market $130,000 Active 27 DOM
-
2026-06-13days on market $130,000 Active 25 DOM
-
2026-06-09days on market $130,000 Active 21 DOM
-
2026-06-08days on market $130,000 Active 20 DOM
-
2026-06-07days on market $130,000 Active 19 DOM
-
2026-06-04days on market $130,000 Active 16 DOM
-
2026-06-03days on market $130,000 Active 15 DOM
-
2026-06-02pricedays on market $130,000 Active 14 DOM
-
2026-06-01days on market $140,000 Active 13 DOM
-
2026-05-31days on market $140,000 Active 12 DOM
-
2026-05-18$140,000 Active 541-char remark
Show marketing remark (541 chars)
Endless possibilities await! Bring your ideas and vision to transform this property into your dream home or investment opportunity. Previously configured as a 4-unit property and now reconfigured into a 2-unit layout, this home offers flexibility for owner-occupants or investors alike. Live in one unit while letting a tenant help pay half your mortgage, or explore the potential for future income opportunities. A rare chance to build equity and create something truly special! Freshly painted throughout, new flooring and new gas furnace.
-
2026-05-18$140,000 Active
Show marketing remark (541 chars)
Endless possibilities await! Bring your ideas and vision to transform this property into your dream home or investment opportunity. Previously configured as a 4-unit property and now reconfigured into a 2-unit layout, this home offers flexibility for owner-occupants or investors alike. Live in one unit while letting a tenant help pay half your mortgage, or explore the potential for future income opportunities. A rare chance to build equity and create something truly special! Freshly painted throughout, new flooring and new gas furnace.
-
2023-10-15historical $700
-
2023-10-02price $700
-
2023-08-21$900
-
2023-04-27historical
-
2023-04-27historical
-
2023-04-25$700 Active
-
2023-04-25$700 Active
-
2022-05-05soldstatus $73,500
-
2022-04-29historical
-
2022-04-28soldstatus $73,500 Sold
-
2022-04-28soldstatus $73,500 Closed
-
2022-03-07status Pending
-
2022-03-07status Pending
-
2022-02-11price $75,000
-
2022-02-11price $75,000
-
2021-12-31status Active
-
2021-12-23historical
-
2021-10-27$85,000 Active
-
2021-10-27$85,000 Active
-
2008-08-18soldstatus $21,450
-
2008-07-25historical
-
2007-10-24historical
-
2007-09-10$39,500
-
2007-03-24$67,900
ⓘ Source: listings_history table (triggers on properties + properties_extension) + one-shot
backfill from property_details.listing_events for pre-trigger history.
Tax reassessment forecast MI · Partial reset (capped growth)
- Current annual tax
- $1,643 · $137/mo
- Projected year-2 tax
- $1,745 · $145/mo
- Expected delta
- +$103/yr (+$9/mo · 6.2%)
ⓘ Screening estimate from a state-policy table — verify with the county assessor before closing.
Climate risk First Street
- Flood 6/10 Major FEMA zone X (unshaded) · 69% chance over 30 yrs
- Wildfire 1/10 Low
- Heat 3/10 Moderate 7 d/yr ≥95°F today · 15 d/yr by 30 yrs out
- Wind 2/10 Low
- Air quality 4/10 Moderate 6 unhealthy d/yr today · 8 by 30 yrs out
Nearby sold comps map
Loading sold comps map…
Walkable amenities ~0.75 mi
Loading nearby amenities…
Taxation est. · year 1
- Rental income
- $11,526
- − Mortgage interest
- −$6,722
- − Property taxes
- −$1,643
- − Insurance
- −$600
- − Repairs & maintenance
- −$922
- − Management
- −$922
- − Depreciation
- −$3,491
- Taxable loss
- −$2,774
- Est. tax savings @ 24.0%
- +$666
- After-tax cash flow
- $-23/yr
For passive investors: Depreciation is non-cash, so a rental often shows a tax loss while cash-flowing — sheltering income. Rental losses are passive: they offset passive income freely, and up to $25,000/yr can offset ordinary (W-2) income if you actively participate and your MAGI is under $100k (phasing out to $0 by $150k); unused losses carry forward. On sale, claimed depreciation is recaptured at up to 25%, and gains may owe capital-gains tax (a 1031 exchange can defer both). Figures are a year-1 estimate at your 24.0% rate — not tax advice; consult a CPA.
Schools (NCES district)
- District
- River Rouge School District
- NCES district ID
- 2629760
- Math proficiency
- 3% ▼ -7.00%
- Reading proficiency
- 12% ▼ -4.00%
- Median HH income
- $26,664
- Composite
- 5.29/100
- National rank
- #10033
- State rank
- #535 of 540 in MI
Livability — River Rouge
- Score
- 65/100
- State rank
- #454
- US rank
- #12700
Category grades
Schools grade is shown separately in the Schools card above.
Census & demographics
- Census place
- River Rouge, MI
- City population
- 7,096
- Population (ZIP)
- 7,096
Population outlook (Wayne County) Hauer SSP2
- Today (2025)
- 1,675,273 people
- By 2030
- 1,620,300 · -3.3%
- By 2040
- 1,502,341 · -10.3%
- By 2050
- 1,384,039 · -17.4%
- By 2075
- 1,124,592 · -32.9%
- By 2100
- 881,193 · -47.4%
Race, ethnicity, and origin ACS 2023
- Neighborhood character
- Diverse neighborhood (Simpson 0.66)
- Race & ethnicity
- Black 45% White 34% Two or more races 16% Hispanic / Latino 16%
- Hispanic origin (detail)
- Mexican 9% Puerto Rican 5%
- Common ancestry
- Romanian 4% Lithuanian 2% Italian 1%
- Foreign-born
- 6% · Canada
- Languages at home
- 86% English-only · Spanish 11% Arabic 2% Other Indo-European 1%
Political lean MEDSL · Wayne
- 2024 margin
- Strong D (+29.0) · D 62.7% · R 33.7% · Other 3.6%
- 2008→2024 swing
- -20.5pp toward R · 2008: 49.5pp · 2024: 29.0pp
- All cycles
- 2024: D+29.0 2020: D+38.1 2016: D+37.3 2012: D+46.9 2008: D+49.5
Not yet ingested
- Civics
- —
Market trends
- HPI YoY
- ▲ 77.93%
- Current HPI
- 352.3551
- Rent YoY
- —
- Metro
- —
- State GDP YoY
- ▲ 1.37%
- F500 in state
- 28
Industry mix (Fortune 500 HQ in MI)
| Industry | F500 HQs | Revenue |
|---|---|---|
| Automotive Parts | 3 | $48B |
|
||
| Automotive | 2 | $372B |
|
||
| Chemicals | 1 | $45B |
|
||
| Automotive Retail | 1 | $29B |
|
||
| Healthcare / Medical Devices | 1 | $23B |
|
||
| Automotive Technology | 1 | $20B |
|
||
Price history
+106.2% since first listed27 events — show timeline
- 2026-05-18 Listed $140,000 SW Michigan MLS
- 2026-05-18 Listed $140,000 REALCOMP
- 2026-05-18 Listed $140,000 MiRealSource-MiMLS
- 2023-10-15 Rental Removed $700 APPFOLIO
- 2023-10-02 Price Changed $700 APPFOLIO
- 2023-08-21 Listed for Rent $900 APPFOLIO
- 2023-04-27 Listing Removed — MiRealSource-MiMLS
- 2023-04-27 Listing Removed — REALCOMP
- 2023-04-25 Listed $700 MiRealSource-MiMLS
- 2023-04-25 Listed $700 REALCOMP
- 2022-05-05 Sold (Public Records) $73,500 Public Records
- 2022-04-29 Listing Removed — REALCOMP
- 2022-04-28 Sold (MLS) $73,500 MiRealSource-MiMLS
- 2022-04-28 Sold (MLS) $73,500 REALCOMP
- 2022-03-07 Pending — MiRealSource-MiMLS
- 2022-03-07 Pending — REALCOMP
- 2022-02-11 Price Changed $75,000 MiRealSource-MiMLS
- 2022-02-11 Price Changed $75,000 REALCOMP
- 2021-12-31 Relisted — MiRealSource-MiMLS
- 2021-12-23 Listing Removed — MiRealSource-MiMLS
- 2021-10-27 Listed $85,000 MiRealSource-MiMLS
- 2021-10-27 Listed $85,000 REALCOMP
- 2008-08-18 Sold (MLS) $21,450 MiRealSource-MiMLS
- 2008-07-25 Listing Removed — MiRealSource-MiMLS
- 2007-10-24 Listing Removed — MiRealSource-MiMLS
- 2007-09-10 Listed $39,500 MiRealSource-MiMLS
- 2007-03-24 Listed $67,900 MiRealSource-MiMLS
Property tax history
-4.2%/yrLatest (2025): $1,643 · -27.7% YoY. Source: county tax records.
Cash-flow waterfall
monthlySold comps — $/sqft
last 12 mo · ≤1 miLoading sold comps…