747 E Germann Rd #18 · San Tan Valley, AZ
Flood risk No data
- FEMA flood zone
- —
- Chance of flooding over 30 yrs
- —
- Est. flood insurance / yr
- —
Fire risk No data
- Est. fire insurance / yr
- —
Heat risk No data
- Hot days now (above threshold)
- —
- Hot days in 30 yrs
- —
Wind risk No data
- Chance of severe wind over 30 yrs
- —
Air-quality risk No data
- Unhealthy air days now
- —
- Unhealthy air days in 30 yrs
- —
Risk factors via First Street. Map © Google.
Why this score? — see what drove the C+ grade
The composite is a weighted blend of 9 inputs, each scored 0–100. Each bar is that input's sub-score; the figure is the points it added to the 100-point composite (weight × sub-score).
- Cash flow +30.0/30.0
- 1% rule +10.0/10.0
- DSCR +10.0/10.0
- Condition / age +4.0/5.0
- Rent growth +2.9/5.0
- Livability +2.7/5.0
- Schools +2.6/10.0
- ARV discount +0.0/15.0
- Appreciation +0.0/10.0
$74,500
🖨 Deal sheet (PDF) 📄 Offer letter ✓ Due diligence
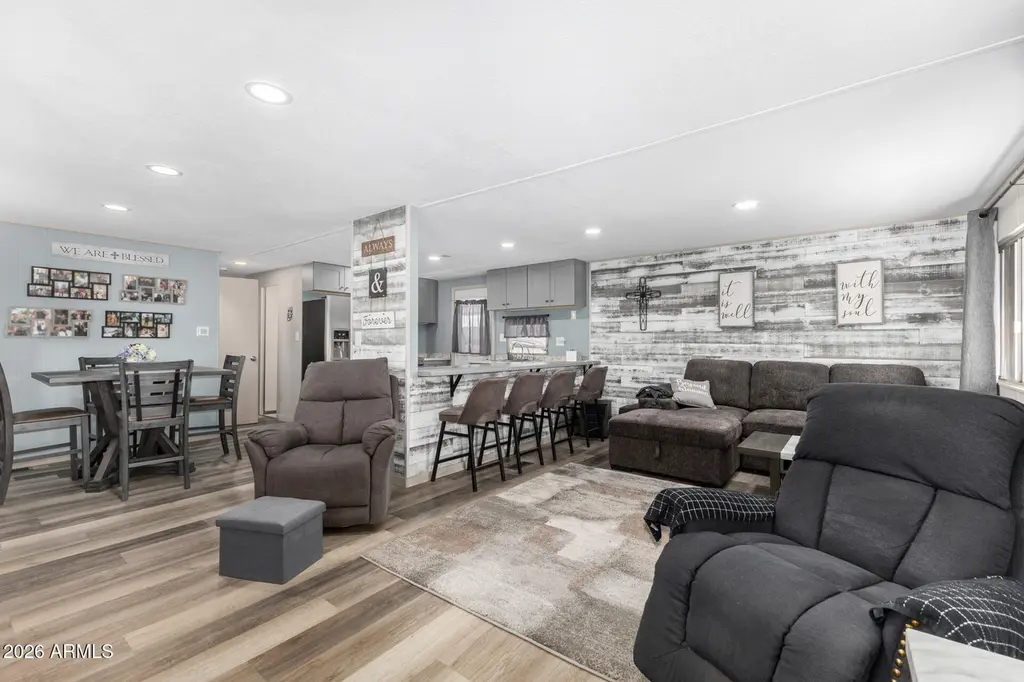
Listing remarks
FULLY FURNISHED, and a GOLF CART with newer batteries so you can drop your bags and enjoy the Arizona 55plus lifestyle! This beautifully remodeled mobile home at 747 E Germann Rd Unit 18 in San Tan Valley offers modern upgrades and comfortable living. It features a new metal roof, updated electric panel, and an energy-efficient heat pump with AC. The fully remodeled kitchen includes contemporary cabinetry and modern appliances, while new flooring flows throughout the home. A new powder room and renovated main bathroom add convenience and style. Additional upgrades include new ceiling insulation, tinted UV-protective windows, a new back door, and a brand-new shed for extra storage. Inside, a
Key facts
- Community pool
- Built 1965
- Listed 86 days
Property features AI
Finance
- Other: Lot size source: Assessor; Building area source: Assessor; Directions: Once you pull into community, home is down and on the left
- HOA & community: Land lease (monthly $740); No association fees included; Community pool; Guarded entry
Exterior
- Utilities: Propane; City water; Septic (in & connected)
- Home design: Modular/Pre-Fab property; Leasehold ownership
- Construction: Wood frame construction; Painted exterior
- Exterior features: Storage; Shed(s); Block fencing; Desert front yard; Gravel/stone in back yard; Reflective roof coating
Interior
- Kitchen: Refrigerator; Dishwasher
- Bedrooms: 2 possible bedrooms
- Flooring: Laminate flooring
- Bathrooms: 1 full bathroom; 1 half bathroom
- Heating & cooling: Heat pump; Electric heating; Central air conditioning
- Interior features: Refrigerator; Dishwasher; Low-emissivity windows; Tinted windows; Zero-grade entry
Neighborhood map
What this means for you Summary
Snapshot
- This is a 2-bed/1.5-bath manufactured listed at $74k. Condition is rated good.
Deal economics
- At list price, monthly cash flow is $783 ($9k/yr) — positive.
- The deal already cash-flows at list — no discount required.
- Meets the 1% rule at list price ($2k rent vs $74k).
- Recommended offer: $70k (6.0% below list) — sets the bar for market timing.
- Cap rate 18.9% vs local median 3.2% in San Tan Valley — top-decile yield for the area; either an underpriced asset or a hidden risk that comps aren't pricing in. Stress-test before assuming the spread holds.
Location & tenants
- Location reads 54/100 on livability (#282 in AZ) — a working-class tenant base; expect higher turnover. Strengths: housing A+, employment B+; Watch: crime D+, schools D, amenities F.
- J O Combs Unified School District (4445) (rural): math 27% / reading 30% proficiency, ranked #109 of 249 in AZ (top 44%) — low school quality limits family demand, transient renter base, plan for 1-2y turnover.
- Market conditions: Rents rising (+1.7%/yr); 837 active listings in the ZIP; solid renter incomes; 9,504 units permitted in Pinal County in 2024 (776 in 5+ unit buildings).
Forward outlook
- Local home prices are declining (-3.0%/yr); year-one equity from $515 of loan paydown is wiped out by about $2k of value loss. Plan a longer hold.
- At projected returns (-3.0% appreciation + 1.7% rent growth), your $21k cash investment doubles in ~3 years — after that, you're playing with house money.
Negotiation context
- It's been on market 86 days — a 6% lower offer ($70k) is reasonable based on typical stale-listing flexibility.
Questions for the listing agent
- It's been on market 86 days. Have you received any prior offers? Is the seller open to a 6% concession, seller financing, or rate buy-down credit?
- Built in 1965 — when were the roof, HVAC, electrical panel, plumbing, and water heater last replaced?
- Why hasn't it sold? Are there any deal-killer items the seller is aware of (foundation, flood, title, zoning, code violations)?
- Is there a deadline driving the sale (1031 exchange, divorce, estate, relocation)? That informs how much negotiation room exists.
- Schools are D-rated, which usually means shorter tenancies and higher turnover. Who's the typical renter profile here, and what's been the actual vacancy rate?
- Crime grade is D in this area — have there been break-ins, vandalism, or insurance claims at this property in the last 3 years? What carrier currently insures it and at what premium?
- What's the average days-on-market for RENTAL listings here right now (not sales)? A rising rental-DOM trend means longer vacancies and softer asking-rent achievability than the comps imply.
- What's the recent tenant-quality profile in this submarket — average credit score on applications, eviction rate, late-payment / NSF rate, and stable-employment percentage? A property-management company in the area should have these aggregated.
- How much new for-sale + rental construction is in the pipeline within 1–3 miles? Heavy new supply typically softens prices + rents 12–24 months out; constrained supply supports both.
Investment metrics
- 1% rule
- 2.21% ✓
- Cap rate
- 18.91%
- Cash-on-cash
- 45.07%
- DSCR
- 3.01
- GRM
- 3.8
CMA / ARV
- ARV (on-the-fly)
- $51,200
- Comps found
- 8
Show comp detail 8 sales within ~0.75 mi
| Address | Dist | Beds/Ba | Sqft | Sold | Price | $/sf | Match |
|---|---|---|---|---|---|---|---|
| 747 E Germann Rd #99 | 0.00mi | 2/1.5 | 780 (-2%) | 1mo | $50,000 | $64 | 95 |
| 437 E Germann Rd #24 | 0.20mi | 2/1.0 | 800 (0%) | 13mo | $51,000 | $64 | 78 |
| 747 E Germann Rd #55 | 0.06mi | 1/1.0 (-1) | 728 (-9%) | 1mo | $40,000 | $55 | 74 |
| 747 E Germann Rd #10 | 0.06mi | 2/1.0 | 784 (-2%) | 22mo | $19,500 | $25 | 74 |
| 747 E Germann Rd #49 | 0.06mi | 2/1.5 | 720 (-10%) | 11mo | $24,000 | $33 | 72 |
| 747 E Germann Rd #72 | 0.06mi | 2/2.0 | 900 (+12%) | 17mo | $88,900 | $99 | 60 |
| 747 E Germann Rd #81 | 0.11mi | 2/1.0 | 900 (+12%) | 14mo | $65,000 | $72 | 60 |
| 747 E Germann Rd #70 | 0.11mi | 1/1.0 (-1) | 700 (-12%) | 11mo | $8,900 | $13 | 58 |
Match score weights: distance 35% · size 25% · config 20% · recency 20%. Top-matched comps best support the ARV.
Projected returns pro-forma
-3.0% appreciation · 1.7% rent growth · sell at horizon
- IRR
- 40.7%
- Equity multiple
- 2.71×
- Total profit
- $35,729
- Equity at exit
- $11,108
- IRR
- 46.3%
- Equity multiple
- 5.17×
- Total profit
- $86,982
- Equity at exit
- $6,441
Cash invested: $20,860 (down + closing). Projections, not guarantees.
Landlord ↔ Tenant lean methodology
- Overall (STATE)
- 87 Strongly Landlord-Friendly
- State Arizona
- 87 Strongly Landlord-Friendly · R+3
- County
- — inherits STATE
- City
- — inherits STATE
ZIP-level market 85140
- Home prices YoY
- -33.1%
- Rents YoY
- 1.7%
- Active inventory
- 837
- Price-to-rent
- 3.8×
Monthly cashflow live
- Estimated rent
- $1,643 medium interval (Pro) →
- Mortgage (P&I)
- −$391
- Tax est. 1.5%
- −$93 /mo · $1,118/yr
- Insurance
- −$31
- HOA
- −$0
- Vacancy / Maint / Mgmt
- −$345
- Net cashflow
- $783
Break-even live
Sensitivity live
| Price | -10% $835 | -5% $809 | +0% $783 | +5% $758 | +10% $732 |
|---|---|---|---|---|---|
| Rent | -10% $654 | -5% $719 | +0% $783 | +5% $848 | +10% $913 |
| Rate | -1.0pp $821 | -0.5pp $802 | base $783 | +0.5pp $764 | +1.0pp $745 |
UW: 25.0% down · 7.5% · 30yr · 1.5% tax · 5.0% vac · 8.0% maint · 8.0% mgmt
Financing live
Cash to close
- Down payment
- $18,625
- Closing costs
- $2,235
- Reserves months
- —
- Total cash needed
- —
Loan-product check · same deal, 3 products live
Conventional
25% down · 7.5% · 30yr
- Down + closing
- —
- Monthly P&I
- —
- Monthly cashflow
- —
- DSCR
- —
- Eligible?
- —
Personal DTI + credit; lowest rate.
DSCR
20% down · 8.5% · 30yr
- Down + closing
- —
- Monthly P&I
- —
- Monthly cashflow
- —
- DSCR
- —
- Eligible?
- —
No personal income docs; deal must DSCR.
Hard money
10% down · 12.0% · 12mo
- Down + closing
- —
- Monthly P&I
- —
- Monthly cashflow
- —
- DSCR
- —
- Eligible?
- —
Short-term bridge; refi at stabilization.
Listing history 17 events
-
2026-06-21days on market $74,500 Active 86 DOM
-
2026-06-18days on market $74,500 Active 83 DOM
-
2026-06-17days on market $74,500 Active 82 DOM
-
2026-06-16days on market $74,500 Active 81 DOM
-
2026-06-15days on market $74,500 Active 80 DOM
-
2026-06-13days on market $74,500 Active 78 DOM
-
2026-06-13days on market $74,500 Active 77 DOM
-
2026-06-09days on market $74,500 Active 74 DOM
-
2026-06-08days on market $74,500 Active 73 DOM
-
2026-06-07days on market $74,500 Active 72 DOM
-
2026-06-04days on market $74,500 Active 69 DOM
-
2026-06-03days on market $74,500 Active 68 DOM
-
2026-06-02days on market $74,500 Active 67 DOM
-
2026-06-01days on market $74,500 Active 66 DOM
-
2026-05-31days on market $74,500 Active 65 DOM
-
2026-04-21price $74,500
-
2026-03-27$75,000 Active
ⓘ Source: listings_history table (triggers on properties + properties_extension) + one-shot
backfill from property_details.listing_events for pre-trigger history.
Nearby sold comps map
Loading sold comps map…
Walkable amenities ~0.75 mi
Loading nearby amenities…
Taxation est. · year 1
- Rental income
- $19,721
- − Mortgage interest
- −$4,173
- − Property taxes
- −$1,118
- − Insurance
- −$372
- − Repairs & maintenance
- −$1,578
- − Management
- −$1,578
- − Depreciation
- −$2,167
- Taxable income
- $8,735
- Est. tax owed @ 24.0%
- −$2,096
- After-tax cash flow
- $7,305/yr
For passive investors: Depreciation is non-cash, so a rental often shows a tax loss while cash-flowing — sheltering income. Rental losses are passive: they offset passive income freely, and up to $25,000/yr can offset ordinary (W-2) income if you actively participate and your MAGI is under $100k (phasing out to $0 by $150k); unused losses carry forward. On sale, claimed depreciation is recaptured at up to 25%, and gains may owe capital-gains tax (a 1031 exchange can defer both). Figures are a year-1 estimate at your 24.0% rate — not tax advice; consult a CPA.
Condition & rehab AI · 13 photos
This fully remodeled mobile home is in excellent condition with modern upgrades and comfortable living. It offers a great value for both resale and rental.
Value-add opportunities
- Both Painting the exterior siding — Enhances curb appeal and value
- Both Landscaping improvements — Enhances curb appeal and value
- Both Upgrading the HVAC system — Improves comfort and energy efficiency
Renovation cost estimate screening
Value-add ROI direction
- Both Painting the exterior siding — Enhances curb appeal and value ↑
- Both Landscaping improvements — Enhances curb appeal and value ↑
- Both Upgrading the HVAC system — Improves comfort and energy efficiency ↑
ⓘ Cost ranges are severity-bucket heuristics (US national rule-of-thumb). Get contractor quotes + a written scope before underwriting a rehab budget.
Schools (NCES district)
- District
- J O Combs Unified School District (4445)
- NCES district ID
- 0403990
- Math proficiency
- 27% ▼ -10.00%
- Reading proficiency
- 30% ▼ -8.00%
- Median HH income
- $61,053
- Composite
- 26.01/100
- National rank
- #7314
- State rank
- #109 of 249 in AZ
Livability — San Tan Valley
- Score
- 54/100
- State rank
- #282
- US rank
- #24192
Category grades
Schools grade is shown separately in the Schools card above.
Census & demographics
- Census place
- San Tan Valley, AZ
- County
- Pinal County · 399,947 people
- City population
- 95,704
- Metro
- Phoenix-Mesa-Chandler, AZ
- Population (ZIP)
- 51,260
- Household income
- $101,477
- Rent vs Own
- Severe rent burden
- 389.0
Population outlook (Pinal County) Hauer SSP2
- Today (2025)
- 437,574 people
- By 2030
- 446,903 · +2.1%
- By 2040
- 452,589 · +3.4%
- By 2050
- 444,126 · +1.5%
- By 2075
- 430,300 · -1.7%
- By 2100
- 393,536 · -10.1%
Race, ethnicity, and origin ACS 2023
- Neighborhood character
- Predominantly White (67%)
- Race & ethnicity
- White 67% Hispanic / Latino 20% Two or more races 9% Black 4% Native American 4% Asian 2%
- Hispanic origin (detail)
- Mexican 16%
- Common ancestry
- Romanian 3% Lithuanian 3% Slovak 2%
- Foreign-born
- 6% · Canada
- Languages at home
- 87% English-only · Spanish 10% Other Asian/Pacific 1%
Political lean MEDSL · Pinal
- 2024 margin
- Strong R (+22.1) · D 38.5% · R 60.6%
- 2008→2024 swing
- -7.6pp toward R · 2008: -14.5pp · 2024: -22.1pp
- All cycles
- 2024: R+22.1 2020: R+17.3 2016: R+19.3 2012: R+17.1 2008: R+14.5
Not yet ingested
- Civics
- —
Market trends
- HPI YoY
- ▼ -132.81%
- Current HPI
- 268.1579
- Rent YoY
- ▲ 1.70%
- Metro
- Phoenix-Mesa-Chandler, AZ
- State GDP YoY
- ▲ 4.54%
- F500 in state
- 20
Industry mix (Fortune 500 HQ in AZ)
| Industry | F500 HQs | Revenue |
|---|---|---|
| Technology | 2 | $13B |
|
||
| Mining / Metals | 1 | $23B |
|
||
| Environmental Services | 1 | $16B |
|
||
| Metals / Steel | 1 | $14B |
|
||
| Technology Distribution | 1 | $9B |
|
||
| Homebuilding | 1 | $8B |
|
||
Price history
-0.7% since first listed2 events — show timeline
- 2026-04-21 Price Changed $74,500 ARMLS
- 2026-03-27 Listed $75,000 ARMLS
Cash-flow waterfall
monthlySold comps — $/sqft
last 12 mo · ≤1 miLoading sold comps…