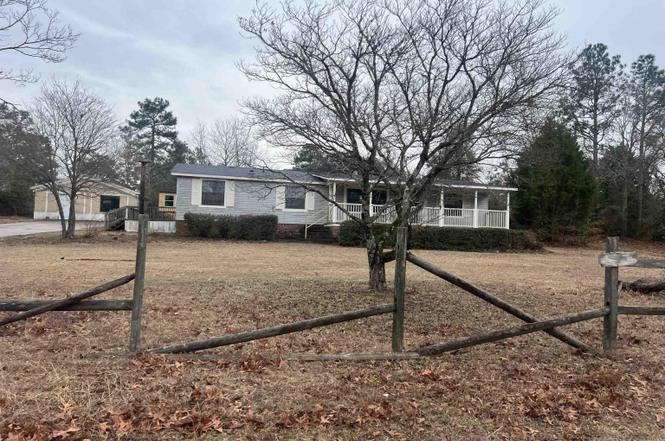
6505 Dakota Rd · South Congaree, SC
Flood risk 1/10 · Minimal
- FEMA flood zone
- X (unshaded)
- Chance of flooding over 30 yrs
- 0.0%
- Est. flood insurance / yr
- $507 – $1,088
Fire risk 5/10 · Moderate
- Est. fire insurance / yr
- $783 – $1,453
Heat risk 7/10 · Major
- Hot days now (above 107°F)
- 7 days/yr
- Hot days in 30 yrs
- 16 days/yr
Wind risk 6/10 · Moderate
- Chance of severe wind over 30 yrs
- 73.0%
Air-quality risk 3/10 · Minor
- Unhealthy air days now
- 2 days/yr
- Unhealthy air days in 30 yrs
- 2 days/yr
Risk factors via First Street. Map © Google.
Why this score? — see what drove the B- grade
The composite is a weighted blend of 9 inputs, each scored 0–100. Each bar is that input's sub-score; the figure is the points it added to the 100-point composite (weight × sub-score).
- Cash flow +30.0/30.0
- 1% rule +10.0/10.0
- DSCR +10.0/10.0
- ARV discount +7.5/15.0
- Rent growth +3.6/5.0
- Livability +3.4/5.0
- Schools +2.9/10.0
- Condition / age +2.5/5.0
- Appreciation +0.0/10.0
$95,000
🖨 Deal sheet 📄 Offer letter ✓ Due diligence
Listing remarks
Step into this spacious doublewide manufactured home set on . 74 acres and offering an abundance of indoor and outdoor living space. A large front porch and side deck welcome you in, while the property also includes a shed with electricity and a convenient quarter bath, plus a powered workshop ideal for hobbies, storage, or the perfect man cave. Inside, the home features 3 bedrooms and 2 bathrooms, including a generous primary suite with dual sinks, stand-up shower, soaking tub, and a large walk-in closet. Enjoy two separate living areas—each with its own fireplace and built-in entertainment center—providing flexible space for an office, playroom, or additional lounge area. The
Key facts
- Large front porch
- Side deck
- Quarter bath
Tags
Property features AI
Exterior
- Parking: 4 parking spaces
- Utilities: Private well water; Septic sewer
- Home design: Single-story home
- Construction: Crawlspace foundation
- Exterior features: Vinyl exterior finish; Dirt road access
Interior
- Kitchen: Eat-in kitchen with Formica countertops, painted cabinets, and vinyl flooring
- Bedrooms: Main-level master suite with double vanity, his-and-hers closets, private bath, separate shower, walk-in closet, private closet, vinyl floors, and a freestanding tub; Main-level second bedroom with shared bath, tub/shower, private closet, and laminate floors; Main-level third bedroom with shared bath, tub/shower, private closet, and vinyl floors
- Flooring: Vinyl flooring in primary living areas and master bedroom; Laminate flooring in bedroom 2
- Bathrooms: Two full bathrooms
- Heating & cooling: Central heating
- Interior features: Entertainment center in the living/formal living room; Wood-burning fireplace; Vinyl flooring in living spaces; Formal dining room in a combo layout
- Laundry & utility: Mud room with electric hookups in a heated space
Neighborhood map
What this means for you Summary
Snapshot
- This is a 3-bed/2.0-bath single-family listed at $95k.
Deal economics
- At list price, monthly cash flow is $601 ($7k/yr) — positive.
- The deal already cash-flows at list — no discount required.
- Meets the 1% rule at list price ($2k rent vs $95k).
- Recommended offer: $89k (6.0% below list) — sets the bar for market timing.
Location & tenants
- Location reads 67/100 on livability (#95 in SC) — a middle-class / working-renter tenant base. Strengths: cost of living A+, housing A+, health & safety A+; Watch: amenities F, commute F, employment D-.
- Lexington 02 (suburban): math 30% / reading 38% proficiency, ranked #45 of 80 in SC (top 56%) — families likely to look elsewhere, expect single-tenant / working-renter base with shorter leases.
- Zoned schools: Congaree Elementary (math 27% / reading 24%, grade F, #444 of 597 statewide, top 75%, 368 students, 100% FRL); Airport High (math 40% / reading 79%, grade C+, #110 of 196 statewide, top 58%, 1,428 students, 84% FRL) — zoned schools average 92% FRL vs 59% district-wide (33 pts higher); higher-poverty schools than district average — tighter screening recommended.
- Market conditions: Rents rising fast (+4.6%/yr); 187 active listings in the ZIP; 2 comparable units currently listed for rent nearby; 1,712 units permitted in Lexington County in 2024 (0 in 5+ unit buildings).
Forward outlook
- Local home prices are declining (-3.0%/yr); year-one equity from $657 of loan paydown is wiped out by about $3k of value loss. Plan a longer hold.
- Lexington County population projected at +26% by 2050 — long-run rental-demand tailwind backs the buy-and-hold thesis.
- At projected returns (-3.0% appreciation + 4.6% rent growth), your $27k cash investment doubles in ~5 years — after that, you're playing with house money.
Negotiation context
- It's been on market 78 days — a 6% lower offer ($89k) is reasonable based on typical stale-listing flexibility.
- 9 sale attempts since 5y ago; this cycle's ask has dropped $34k (26%) from the opening price — seller is motivated, your offer sets the floor, not the list.
Risks & watch-outs
- Climate carrying-cost: major wind risk, 73% chance of damaging wind over 30y; moderate wildfire risk; extreme-heat days projected 7→16/yr by 2055 (HVAC capex compounding) — expect insurance premiums to compound above CPI over the hold.
Questions for the listing agent
- It's been on market 78 days. Have you received any prior offers? Is the seller open to a 6% concession, seller financing, or rate buy-down credit?
- Why hasn't it sold? Are there any deal-killer items the seller is aware of (foundation, flood, title, zoning, code violations)?
- Is there a deadline driving the sale (1031 exchange, divorce, estate, relocation)? That informs how much negotiation room exists.
- Schools are F-rated, which usually means shorter tenancies and higher turnover. Who's the typical renter profile here, and what's been the actual vacancy rate?
- What's the average days-on-market for RENTAL listings here right now (not sales)? A rising rental-DOM trend means longer vacancies and softer asking-rent achievability than the comps imply.
- What's the recent tenant-quality profile in this submarket — average credit score on applications, eviction rate, late-payment / NSF rate, and stable-employment percentage? A property-management company in the area should have these aggregated.
- How much new for-sale + rental construction is in the pipeline within 1–3 miles? Heavy new supply typically softens prices + rents 12–24 months out; constrained supply supports both.
Investment metrics
- 1% rule
- 1.77% ✓
- Cap rate
- 13.88%
- Cash-on-cash
- 27.10%
- DSCR
- 2.21
- GRM
- 4.7
CMA / ARV
No comps found within radius.
Projected returns pro-forma
-3.0% appreciation · 4.57% rent growth · sell at horizon
- IRR
- 23.0%
- Equity multiple
- 1.96×
- Total profit
- $25,641
- Equity at exit
- $14,165
- IRR
- 32.0%
- Equity multiple
- 4.13×
- Total profit
- $83,329
- Equity at exit
- $8,214
Cash invested: $26,600 (down + closing). Projections, not guarantees.
Landlord ↔ Tenant lean methodology
- Overall (STATE)
- 90 Strongly Landlord-Friendly
- State South Carolina
- 90 Strongly Landlord-Friendly · R+6
- County
- — inherits STATE
- City
- — inherits STATE
ZIP-level market 29170
- Home prices YoY
- -16.9%
- Rents YoY
- 4.6%
- Active inventory
- 187
- Price-to-rent
- 4.7×
Monthly cashflow live
- Estimated rent
- $1,684 medium interval (Pro) →
- Mortgage (P&I)
- −$498
- Tax from tax record
- −$192 /mo · $2,300/yr
- Insurance
- −$40
- HOA
- −$0
- Vacancy / Maint / Mgmt
- −$354
- Net cashflow
- $601
Break-even live
UW: 25.0% down · 7.5% · 30yr · 1.5% tax · 5.0% vac · 8.0% maint · 8.0% mgmt
Financing live
Cash to close
- Down payment
- $23,750
- Closing costs
- $2,850
- Reserves months
- —
- Total cash needed
- —
Loan-product check · same deal, 3 products live
Conventional
25% down · 7.5% · 30yr
- Down + closing
- —
- Monthly P&I
- —
- Monthly cashflow
- —
- DSCR
- —
- Eligible?
- —
Personal DTI + credit; lowest rate.
DSCR
20% down · 8.5% · 30yr
- Down + closing
- —
- Monthly P&I
- —
- Monthly cashflow
- —
- DSCR
- —
- Eligible?
- —
No personal income docs; deal must DSCR.
Hard money
10% down · 12.0% · 12mo
- Down + closing
- —
- Monthly P&I
- —
- Monthly cashflow
- —
- DSCR
- —
- Eligible?
- —
Short-term bridge; refi at stabilization.
Rent comps 2 comps
| Address | Beds | Baths | Sqft | Rent | $/sqft | DOM | Units | Dist |
|---|---|---|---|---|---|---|---|---|
| 123 Lanier Ave West Columbia, SC | 3.0 | 2.0 | 1448 | $1,650 | $1.14 | 11d | 1 | 0.51mi |
| 3150 Greenwood Dr Unit F West Columbia, SC | 3.0 | 2.0 | 1680 | $1,400 | $0.83 | 11d | 1 | 0.52mi |
Listing history 38 events
-
2026-06-18days on market $95,000 Active 78 DOM
-
2026-06-17days on market $95,000 Active 77 DOM
-
2026-06-16days on market $95,000 Active 76 DOM
-
2026-06-15days on market $95,000 Active 75 DOM
-
2026-06-14days on market $95,000 Active 73 DOM
-
2026-06-13days on market $95,000 Active 72 DOM
-
2026-06-10days on market $95,000 Active 70 DOM
-
2026-06-09days on market $95,000 Active 69 DOM
-
2026-06-09price $95,000 Active 68 DOM
-
2026-06-08days on market $105,000 Active 68 DOM
-
2026-06-07days on market $105,000 Active 67 DOM
-
2026-06-05days on market $105,000 Active 64 DOM
-
2026-06-03days on market $105,000 Active 63 DOM
-
2026-06-03days on market $105,000 Active 62 DOM
-
2026-06-02days on market $105,000 Active 61 DOM
-
2026-05-31days on market $105,000 Active 60 DOM
-
2026-05-21status Active
-
2026-05-13status Pending
-
2026-05-01price $105,000
-
2026-03-29status Active
-
2026-03-13status Pending
-
2026-03-08$128,500 Active
-
2023-10-08historical $1,400
-
2023-09-29$1,400
-
2023-09-06historical $1,400
-
2023-09-05$1,400
-
2022-05-02soldstatus $111,000
-
2022-02-19historical
-
2022-02-17status Active
-
2022-02-02historical
-
2022-01-31price $115,500
-
2022-01-31status Active
-
2021-12-11historical
-
2021-12-07status Active
-
2021-11-04historical
-
2021-11-01$108,500 Active
-
2000-10-13soldstatus $70,000
-
2000-10-13soldstatus $99,400
ⓘ Source: listings_history table (triggers on properties + properties_extension) + one-shot
backfill from property_details.listing_events for pre-trigger history.
Tax reassessment forecast SC · Resets to sale price
- Current annual tax
- $2,300 · $192/mo
- Projected year-2 tax
- $2,300 · $192/mo
- Expected delta
- $0/yr ($0/mo · 0.0%)
ⓘ Screening estimate from a state-policy table — verify with the county assessor before closing.
Climate risk First Street
- Flood 1/10 Low FEMA zone X (unshaded) · 0% chance over 30 yrs
- Wildfire 5/10 Major
- Heat 7/10 Severe 7 d/yr ≥107°F today · 16 d/yr by 30 yrs out
- Wind 6/10 Major 73% chance of damaging wind over 30 yrs
- Air quality 3/10 Moderate 2 unhealthy d/yr today · 2 by 30 yrs out
Nearby sold comps map
Loading sold comps map…
Walkable amenities ~0.75 mi
Loading nearby amenities…
Taxation est. · year 1
- Rental income
- $20,205
- − Mortgage interest
- −$5,321
- − Property taxes
- −$2,300
- − Insurance
- −$475
- − Repairs & maintenance
- −$1,616
- − Management
- −$1,616
- − Depreciation
- −$2,764
- Taxable income
- $6,113
- Est. tax owed @ 24.0%
- −$1,467
- After-tax cash flow
- $5,742/yr
For passive investors: Depreciation is non-cash, so a rental often shows a tax loss while cash-flowing — sheltering income. Rental losses are passive: they offset passive income freely, and up to $25,000/yr can offset ordinary (W-2) income if you actively participate and your MAGI is under $100k (phasing out to $0 by $150k); unused losses carry forward. On sale, claimed depreciation is recaptured at up to 25%, and gains may owe capital-gains tax (a 1031 exchange can defer both). Figures are a year-1 estimate at your 24.0% rate — not tax advice; consult a CPA.
Schools (NCES district)
- District
- Lexington 02
- NCES district ID
- 4502730
- Math proficiency
- 30% ▼ -6.00%
- Reading proficiency
- 38% ▬ 0.00%
- Median HH income
- $42,532
- Composite
- 28.78/100
- National rank
- #6669
- State rank
- #45 of 80 in SC
Livability — South Congaree
- Score
- 67/100
- State rank
- #95
- US rank
- #10688
Category grades
Schools grade is shown separately in the Schools card above.
Census & demographics
- County
- Lexington County · 232,571 people
- Metro
- Columbia, SC
- Population (ZIP)
- 21,247
- Household income
- $74,902
- Rent vs Own
- Severe rent burden
- 147.0
Population outlook (Lexington County) Hauer SSP2
- Today (2025)
- 322,999 people
- By 2030
- 342,356 · +6.0%
- By 2040
- 377,715 · +16.9%
- By 2050
- 406,984 · +26.0%
- By 2075
- 465,447 · +44.1%
- By 2100
- 485,674 · +50.4%
Race, ethnicity, and origin ACS 2023
- Neighborhood character
- Predominantly White (66%)
- Race & ethnicity
- White 66% Black 17% Hispanic / Latino 10% Two or more races 8% Asian 3%
- Hispanic origin (detail)
- Mexican 6% Puerto Rican 1%
- Common ancestry
- Serbian 2% Italian 2% Romanian 2%
- Foreign-born
- 9% · Canada, Jamaica, Guatemala
- Languages at home
- 90% English-only · Spanish 7% Other Indo-European 2%
Political lean MEDSL · Lexington
- 2024 margin
- Solid R (+33.5) · D 32.5% · R 66.0% · Other 1.4%
- 2008→2024 swing
- +4.6pp toward D · 2008: -38.0pp · 2024: -33.5pp
- All cycles
- 2024: R+33.5 2020: R+30.1 2016: R+36.7 2012: R+37.8 2008: R+38.0
Not yet ingested
- Civics
- —
Market trends
- HPI YoY
- ▼ -52.72%
- Current HPI
- 259.713
- Rent YoY
- ▲ 4.57%
- Metro
- Columbia, SC
- State GDP YoY
- ▲ 4.51%
- F500 in state
- 2
Industry mix (Fortune 500 HQ in SC)
| Industry | F500 HQs | Revenue |
|---|---|---|
| Packaging | 1 | $7B |
|
||
Price history
+50.0% since first listed22 events — show timeline
- 2026-05-21 Relisted — Consolidated MLS
- 2026-05-13 Pending — Consolidated MLS
- 2026-05-01 Price Changed $105,000 Consolidated MLS
- 2026-03-29 Relisted — Consolidated MLS
- 2026-03-13 Pending — Consolidated MLS
- 2026-03-08 Listed $128,500 Consolidated MLS
- 2023-10-08 Rental Removed $1,400 BUILDIUM
- 2023-09-29 Listed for Rent $1,400 BUILDIUM
- 2023-09-06 Rental Removed $1,400 BUILDIUM
- 2023-09-05 Listed for Rent $1,400 BUILDIUM
- 2022-05-02 Sold (Public Records) $111,000 Public Records
- 2022-02-19 Delisted — Consolidated MLS
- 2022-02-17 Relisted — Consolidated MLS
- 2022-02-02 Delisted — Consolidated MLS
- 2022-01-31 Price Changed $115,500 Consolidated MLS
- 2022-01-31 Relisted — Consolidated MLS
- 2021-12-11 Delisted — Consolidated MLS
- 2021-12-07 Relisted — Consolidated MLS
- 2021-11-04 Delisted — Consolidated MLS
- 2021-11-01 Listed $108,500 Consolidated MLS
- 2000-10-13 Sold (Public Records) $99,400 Public Records
- 2000-10-13 Sold (Public Records) $70,000 Public Records
Property tax history
+21.8%/yrLatest (2024): $2,300 · +7.5% YoY. Source: county tax records.
Cash-flow waterfall
monthlySold comps — $/sqft
last 12 mo · ≤1 miLoading sold comps…