 Multi-family
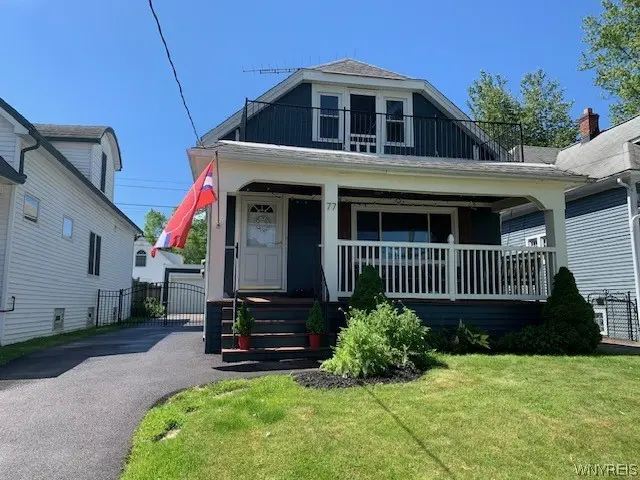
77 Whitehall Ave · Buffalo, NY
Flood risk 1/10 · Minimal
- FEMA flood zone
- X (unshaded)
- Chance of flooding over 30 yrs
- 0.0%
- Est. flood insurance / yr
- $473 – $860
Fire risk 1/10 · Minimal
- Est. fire insurance / yr
- $691 – $1,283
Heat risk 3/10 · Minor
- Hot days now (above 92°F)
- 7 days/yr
- Hot days in 30 yrs
- 16 days/yr
Wind risk 1/10 · Minimal
- Chance of severe wind over 30 yrs
- —
Air-quality risk 4/10 · Minor
- Unhealthy air days now
- 3 days/yr
- Unhealthy air days in 30 yrs
- 8 days/yr
Risk factors via First Street. Map © Google.
Why this score? — see what drove the C+ grade
The composite is a weighted blend of 9 inputs, each scored 0–100. Each bar is that input's sub-score; the figure is the points it added to the 100-point composite (weight × sub-score).
- Cash flow +23.1/30.0
- ARV discount +10.8/15.0
- DSCR +7.4/10.0
- 1% rule +4.8/10.0
- Rent growth +4.4/5.0
- Livability +3.9/5.0
- Schools +3.3/10.0
- Condition / age +2.5/5.0
- Appreciation +0.0/10.0
$249,900
🖨 Deal sheet 📄 Offer letter ✓ Due diligence
Multi-family units
County records classify this as Multi-Family (2-4 Unit). Listing-text estimate: 1 unit. estimate disagrees with records
Listing remarks
Welcome to 77 Whitehall Ave in demand South Buffalo neighborhood only steps from McKinley Parkway. Great 3 bedroom lower apartment with an updated full bath. Large primary bedroom with oversize closet. Huge living and dining rooms. Lower unit also has central air conditioning. Upper apartment has 2 bedrooms, a full bath and nice sized living room and kitchen. Dry basement and a 2 car garage. Most furnishings in the upper apartment are available to the buyer if they want them. Whether your an investor or owner occupied this home is perfect. Both apartments will be vacant prior to close. No showings before 11am. Square footage in tax record is inaccurate. Square footage is approximately 1968.
Key facts
- Updated full bath
- Dry basement
- 4,025 sq ft lot
Tags
Property features AI
Finance
- Financial info: Two-unit property with separate electric and gas meters for each unit; Operating expense details: see remarks; Owner pays: see remarks
Exterior
- Parking: 2-car garage; Paved parking; On-street parking; two or more spaces available
- Utilities: Electricity connected (circuit breakers); Public water connected; Sewer connected; Cable available; High-speed internet available
- Home design: Single-story building; Resale property; Architectural shingle roof
- Construction: Block foundation; Copper plumbing; Built as existing (year built details: existing)
- Exterior features: Fully fenced yard; Covered porch; Porch
Interior
- Kitchen: Oven/range and refrigerator in one unit; Dishwasher and oven/range in the other unit; Dining area connected to kitchen in both units; Formal dining room in one unit
- Bedrooms: One unit with 2 bedrooms; One unit with 3 bedrooms
- Flooring: Carpet; Hardwood; Laminate; Luxury vinyl; Vinyl; Varied flooring throughout
- Bathrooms: Two full bathrooms total (one full bath in each unit)
- Heating & cooling: Gas forced-air heating; Central air; Window AC units
- Interior features: Ceiling fans; Window treatments and drapes; Thermal windows; Programmable thermostat
- Laundry & utility: Washer hookup; Washer and dryer included in one unit; Gas water heater
Neighborhood map
What this means for you Summary
Snapshot
- This is a 5-bed/2.0-bath multifamily listed at $250k.
Deal economics
- At list price, monthly cash flow is $449 ($5k/yr) — positive.
- The deal already cash-flows at list — no discount required.
- To meet the 1% rule (rent ≥ 1% of price), the offer needs to be $244k (2.2% below list).
- Recommended offer: $244k (2.2% below list) — sets the bar for 1% rule.
Location & tenants
- Location reads 77/100 on livability (#195 in NY, #3,011 nationally) — a middle-class / working-renter tenant base. Strengths: commute A+, housing A+, health & safety A+; Watch: crime F, employment D-.
- Buffalo City School District (urban): math 41% / reading 40% proficiency, ranked #535 of 590 in NY (top 91%) — families likely to look elsewhere, expect single-tenant / working-renter base with shorter leases; 75% free/reduced lunch — lower-income household profile, screen leases tightly.
- Market conditions: Rents rising fast (+7.6%/yr); 136 active listings in the ZIP; 1,244 units permitted in Erie County in 2024 (563 in 5+ unit buildings).
- This rent runs 41% of the median local income ($71k/yr) — at the standard rent-burdened threshold; future hikes will face affordability resistance.
Forward outlook
- Local home prices are declining (-3.0%/yr); year-one equity from $2k of loan paydown is wiped out by about $7k of value loss. Plan a longer hold.
- At projected returns (-3.0% appreciation + 7.6% rent growth), your $70k cash investment doubles in ~9 years — after that, you're playing with house money.
Negotiation context
- Only 6 days on market — expect competitive offers; lowballing is unlikely to land.
- Current owner paid $87k; list at $250k implies a 187% gain — meaningful room to come down on a strong offer.
Risks & watch-outs
- Watch-outs: built in 1930 — expect roof / HVAC / electrical / plumbing capex.
Questions for the listing agent
- Built in 1930 — when were the roof, HVAC, electrical panel, plumbing, and water heater last replaced?
- Is there a deadline driving the sale (1031 exchange, divorce, estate, relocation)? That informs how much negotiation room exists.
- Crime grade is F in this area — have there been break-ins, vandalism, or insurance claims at this property in the last 3 years? What carrier currently insures it and at what premium?
- What's the average days-on-market for RENTAL listings here right now (not sales)? A rising rental-DOM trend means longer vacancies and softer asking-rent achievability than the comps imply.
- What's the recent tenant-quality profile in this submarket — average credit score on applications, eviction rate, late-payment / NSF rate, and stable-employment percentage? A property-management company in the area should have these aggregated.
- How much new apartment / multifamily construction is in the pipeline within 1–3 miles? Heavy new supply (>2% of stock underway) typically softens rents 12–24 months out; light construction supports rent growth.
Investment metrics
- 1% rule
- 0.98% ✗
- Cap rate
- 8.45%
- Cash-on-cash
- 7.70%
- DSCR
- 1.34
- GRM
- 8.5
CMA / ARV
- ARV (on-the-fly)
- $269,988
- Comps found
- 12
Show comp detail 12 sales within ~0.75 mi
| Address | Dist | Beds/Ba | Sqft | Sold | Price | $/sf | Match |
|---|---|---|---|---|---|---|---|
| 15 Arbour Ln | 0.17mi | 4/2.0 (-1) | 1,856 (+4%) | 7mo | $275,000 | $148 | 75 |
| 123 Kimberly Ave | 0.20mi | 4/2.0 (-1) | 1,633 (-9%) | 4mo | $246,500 | $151 | 68 |
| 103 Kimberly Ave | 0.19mi | 4/2.0 (-1) | 1,633 (-9%) | 10mo | $271,000 | $166 | 63 |
| 16 Culver Rd | 0.65mi | 4/2.0 (-1) | 1,800 (+1%) | 7mo | $262,000 | $146 | 57 |
| 55 Harding Rd | 0.60mi | 4/2.0 (-1) | 1,844 (+3%) | 9mo | $275,000 | $149 | 54 |
| 87 Kimberly Ave | 0.19mi | 4/2.0 (-1) | 1,610 (-10%) | 22mo | $312,000 | $194 | 52 |
| 103 Potters Rd | 0.66mi | 4/2.0 (-1) | 1,866 (+4%) | 18mo | $300,000 | $161 | 42 |
| 100 Shenandoah Rd | 0.49mi | 4/2.0 (-1) | 1,552 (-13%) | 17mo | $265,000 | $171 | 36 |
| 180 Tuscarora Rd | 0.54mi | 4/2.0 (-1) | 2,016 (+13%) | 18mo | $335,000 | $166 | 34 |
| 207 Brookside Dr | 0.61mi | 4/2.5 (-1) | 2,017 (+13%) | 12mo | $300,000 | $149 | 33 |
| 69 Red Jacket Pkwy | 0.69mi | 6/2.0 (+1) | 2,032 (+14%) | 10mo | $229,000 | $113 | 32 |
| 41 Leonard St | 0.69mi | 6/2.0 (+1) | 2,056 (+15%) | 20mo | $175,000 | $85 | 21 |
Match score weights: distance 35% · size 25% · config 20% · recency 20%. Top-matched comps best support the ARV.
Projected returns pro-forma
-3.0% appreciation · 7.62% rent growth · sell at horizon
- IRR
- -0.1%
- Equity multiple
- 1.00×
- Total profit
- $-140
- Equity at exit
- $37,261
- IRR
- 13.5%
- Equity multiple
- 2.28×
- Total profit
- $89,899
- Equity at exit
- $21,607
Cash invested: $69,972 (down + closing). Projections, not guarantees.
Landlord ↔ Tenant lean methodology
- Overall (STATE)
- 15 Strongly Tenant-Friendly
- State New York
- 15 Strongly Tenant-Friendly · D+10
- County
- — inherits STATE
- City
- — inherits STATE
ZIP-level market 14220
- Home prices YoY
- -26.7%
- Rents YoY
- 7.6%
- Active inventory
- 136
- Price-to-rent
- 16.0×
Monthly cashflow live
- Estimated rent
- $2,444 high interval (Pro) →
- Mortgage (P&I)
- −$1,311
- Tax from tax record
- −$67 /mo · $809/yr
- Insurance
- −$104
- HOA
- −$0
- Vacancy / Maint / Mgmt
- −$513
- Net cashflow
- $449
Break-even live
2-unit breakdown (identical units grouped — click to expand)
| Units | Beds | Baths | Est. rent |
|---|---|---|---|
| 1× unit | 3 | 1 | $1,299 |
| 1× unit | 2 | 1 | $1,144 |
| Total (2 units) | $2,444 | ||
UW: 25.0% down · 7.5% · 30yr · 1.5% tax · 5.0% vac · 8.0% maint · 8.0% mgmt
Financing live
Cash to close
- Down payment
- $62,475
- Closing costs
- $7,497
- Reserves months
- —
- Total cash needed
- —
Loan-product check · same deal, 3 products live
Conventional
25% down · 7.5% · 30yr
- Down + closing
- —
- Monthly P&I
- —
- Monthly cashflow
- —
- DSCR
- —
- Eligible?
- —
Personal DTI + credit; lowest rate.
DSCR
20% down · 8.5% · 30yr
- Down + closing
- —
- Monthly P&I
- —
- Monthly cashflow
- —
- DSCR
- —
- Eligible?
- —
No personal income docs; deal must DSCR.
Hard money
10% down · 12.0% · 12mo
- Down + closing
- —
- Monthly P&I
- —
- Monthly cashflow
- —
- DSCR
- —
- Eligible?
- —
Short-term bridge; refi at stabilization.
Listing history 5 events
-
2026-06-08status $249,900 Pending 6 DOM
-
2026-06-07days on market $249,900 Active 6 DOM
-
2026-06-03days on market $249,900 Active 2 DOM
-
2026-06-02remarks 699-char remark
-
2026-06-02$249,900 Active 1 DOM
ⓘ Source: listings_history table (triggers on properties + properties_extension) + one-shot
backfill from property_details.listing_events for pre-trigger history.
Tax reassessment forecast NY · Partial reset (capped growth)
- Current annual tax
- $809 · $67/mo
- Projected year-2 tax
- $2,516 · $210/mo
- Expected delta
- +$1,707/yr (+$142/mo · 211.0%)
ⓘ Screening estimate from a state-policy table — verify with the county assessor before closing.
Climate risk First Street
- Flood 1/10 Low FEMA zone X (unshaded) · 0% chance over 30 yrs
- Wildfire 1/10 Low
- Heat 3/10 Moderate 7 d/yr ≥92°F today · 16 d/yr by 30 yrs out
- Wind 1/10 Low
- Air quality 4/10 Moderate 3 unhealthy d/yr today · 8 by 30 yrs out
Nearby sold comps map
Loading sold comps map…
Walkable amenities ~0.75 mi
Loading nearby amenities…
Taxation est. · year 1
- Rental income
- $29,328
- − Mortgage interest
- −$13,998
- − Property taxes
- −$809
- − Insurance
- −$1,250
- − Repairs & maintenance
- −$2,346
- − Management
- −$2,346
- − Depreciation
- −$7,270
- Taxable income
- $1,309
- Est. tax owed @ 24.0%
- −$314
- After-tax cash flow
- $5,070/yr
For passive investors: Depreciation is non-cash, so a rental often shows a tax loss while cash-flowing — sheltering income. Rental losses are passive: they offset passive income freely, and up to $25,000/yr can offset ordinary (W-2) income if you actively participate and your MAGI is under $100k (phasing out to $0 by $150k); unused losses carry forward. On sale, claimed depreciation is recaptured at up to 25%, and gains may owe capital-gains tax (a 1031 exchange can defer both). Figures are a year-1 estimate at your 24.0% rate — not tax advice; consult a CPA.
Schools (NCES district)
- District
- Buffalo City School District
- NCES district ID
- 3605850
- Math proficiency
- 41% ▲ 11.00%
- Reading proficiency
- 40% ▲ 7.00%
- Median HH income
- $31,665
- Composite
- 33.17/100
- National rank
- #5544
- State rank
- #535 of 590 in NY
Livability — Buffalo
- Score
- 77/100
- State rank
- #195
- US rank
- #3011
Category grades
Schools grade is shown separately in the Schools card above.
Census & demographics
- Census place
- Buffalo, NY
- County
- Erie County · 714,559 people
- City population
- 440,021
- Metro
- Buffalo-Cheektowaga, NY
- Population (ZIP)
- 24,428
- Household income
- $70,963
- Rent vs Own
- Severe rent burden
- 602.0
Population outlook (Erie County) Hauer SSP2
- Today (2025)
- 933,037 people
- By 2030
- 935,181 · +0.2%
- By 2040
- 928,531 · -0.5%
- By 2050
- 905,725 · -2.9%
- By 2075
- 834,037 · -10.6%
- By 2100
- 708,033 · -24.1%
Race, ethnicity, and origin ACS 2023
- Neighborhood character
- Predominantly White (76%)
- Race & ethnicity
- White 76% Hispanic / Latino 13% Two or more races 6% Black 5% Asian 2%
- Hispanic origin (detail)
- Puerto Rican 10% Cuban 1%
- Common ancestry
- Romanian 16% Lithuanian 1% Subsaharan African 1%
- Foreign-born
- 4% · Canada, Jamaica, China
- Languages at home
- 90% English-only · Spanish 4% Chinese 1%
Political lean MEDSL · Erie
- 2024 margin
- Lean D (+9.7) · D 54.8% · R 45.2%
- 2008→2024 swing
- -7.9pp toward R · 2008: 17.5pp · 2024: 9.7pp
- All cycles
- 2024: D+9.7 2020: D+14.7 2016: D+4.8 2012: D+15.6 2008: D+17.5
Not yet ingested
- Civics
- —
Market trends
- HPI YoY
- ▼ -146.29%
- Current HPI
- 402.5053
- Rent YoY
- ▲ 7.62%
- Metro
- Buffalo-Cheektowaga, NY
- State GDP YoY
- ▲ 2.60%
- F500 in state
- 92
Industry mix (Fortune 500 HQ in NY)
| Industry | F500 HQs | Revenue |
|---|---|---|
| Financial Services | 10 | $950B |
|
||
| Consumer Goods | 9 | $162B |
|
||
| Insurance | 4 | $225B |
|
||
| Telecommunications | 2 | $144B |
|
||
| Pharmaceuticals | 2 | $112B |
|
||
| Media / Entertainment | 2 | $69B |
|
||
Price history
+270.2% since first listed4 events — show timeline
- 2026-06-01 Listed $249,900 WNYREIS
- 2013-06-04 Sold (Public Records) $87,000 Public Records
- 2006-05-26 Sold (Public Records) $79,500 Public Records
- 2003-09-10 Sold (Public Records) $67,500 Public Records
Property tax history
+6.0%/yrLatest (2025): $809 · +15.5% YoY. Source: county tax records.
Cash-flow waterfall
monthlySold comps — $/sqft
last 12 mo · ≤1 miLoading sold comps…