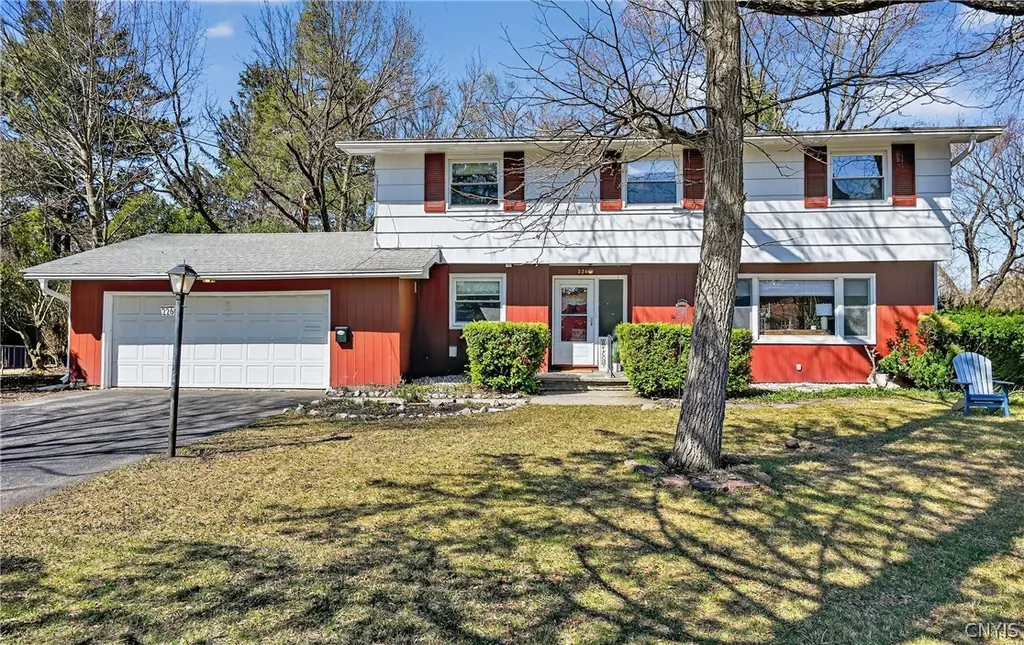
226 Ridgecrest Rd · De Witt, NY
Flood risk 1/10 · Minimal
- FEMA flood zone
- X (unshaded)
- Chance of flooding over 30 yrs
- 0.0%
- Est. flood insurance / yr
- $473 – $860
Fire risk 1/10 · Minimal
- Est. fire insurance / yr
- $691 – $1,283
Heat risk 3/10 · Minor
- Hot days now (above 96°F)
- 7 days/yr
- Hot days in 30 yrs
- 16 days/yr
Wind risk 1/10 · Minimal
- Chance of severe wind over 30 yrs
- 0.0%
Air-quality risk 2/10 · Minimal
- Unhealthy air days now
- 0 days/yr
- Unhealthy air days in 30 yrs
- 1 days/yr
Risk factors via First Street. Map © Google.
Why this score? — see what drove the D+ grade
The composite is a weighted blend of 9 inputs, each scored 0–100. Each bar is that input's sub-score; the figure is the points it added to the 100-point composite (weight × sub-score).
- Cash flow +11.8/30.0
- ARV discount +11.8/15.0
- Schools +6.2/10.0
- 1% rule +4.3/10.0
- DSCR +3.5/10.0
- Rent growth +2.5/5.0
- Livability +2.5/5.0
- Condition / age +2.5/5.0
- Appreciation +0.0/10.0
$309,900
🖨 Deal sheet 📄 Offer letter ✓ Due diligence
Listing remarks
Beautifully set in the highly sought-after Jamesville-Dewitt School District, this spacious 4-bedroom, 3-full-bath home offers comfort, flexibility, and timeless charm. Upon entering, the main level features a versatile bedroom with an attached full bath, perfect for guests or multi-generational living. Enjoy two inviting living spaces — a cozy den with a fireplace on the main level and a bright, large living room showcasing a second fireplace and picture windows that fill the space with natural light on the second level. A formal dining room provides the ideal setting for gatherings and special occasions. Upstairs, you'll find another full bathroom and three generous bedrooms, includ
Key facts
- Versatile bedroom
- Picture windows
- Formal dining room
Tags
Neighborhood map
What this means for you Summary
Snapshot
- This is a 3-bed/2.0-bath single-family listed at $310k.
Deal economics
- At list price, monthly cash flow is $-88 ($-1k/yr) — negative.
- To cash-flow at today's rent, offer at most $294k (5.0% below list).
- To meet the 1% rule (rent ≥ 1% of price), the offer needs to be $289k (6.7% below list).
- Recommended offer: $289k (6.7% below list) — sets the bar for 1% rule.
- Cap rate 6.0% vs local median 3.8% in De Witt — top-decile yield for the area; either an underpriced asset or a hidden risk that comps aren't pricing in. Stress-test before assuming the spread holds.
Location & tenants
- Location reads: area grade D — affects rentability + tenant quality, not the cash-flow math above.
- Jamesville-Dewitt Central School District (suburban): math 69% / reading 71% proficiency, ranked #124 of 590 in NY (top 21%) — strong family-tenant draw, lease renewals of 3-5y typical; only 13% free/reduced lunch — higher-income household profile.
- Market conditions: 32 active listings in the ZIP; 6 comparable units currently listed for rent nearby; rentals leasing fast (median 14d on market — plan ~1-2 weeks tenant-placement turnaround); 616 units permitted in Onondaga County in 2024 (256 in 5+ unit buildings).
Forward outlook
- Local home prices are declining (-3.0%/yr); year-one equity from $2k of loan paydown is wiped out by about $9k of value loss. Plan a longer hold.
- Onondaga County population projected to shrink 9% by 2050 — rents likely to lag national; underwrite the cash flow, not the appreciation.
Negotiation context
- It's been on market 17 days — a 2% lower offer ($305k) is reasonable based on typical stale-listing flexibility.
- 2 sale attempts since 7y ago with the ask held roughly flat each time — persistent listings suggest the price (not the market) is what's stuck; bring a comps-based counter.
- Current owner paid $175k; list at $310k implies a 77% gain — meaningful room to come down on a strong offer.
Risks & watch-outs
- Watch-outs: built in 1959 — expect roof / HVAC / electrical / plumbing capex.
Questions for the listing agent
- What do current leases actually rent for vs. the listed asking? Can we see a recent rent roll and the last 12 months of T-12 income?
- Built in 1959 — when were the roof, HVAC, electrical panel, plumbing, and water heater last replaced?
- Is there a deadline driving the sale (1031 exchange, divorce, estate, relocation)? That informs how much negotiation room exists.
- The area grade is low — what's the realistic commute time and amenity access for the typical tenant pool here? Any planned neighborhood developments (good or bad) we should know about?
- What's the average days-on-market for RENTAL listings here right now (not sales)? A rising rental-DOM trend means longer vacancies and softer asking-rent achievability than the comps imply.
- What's the recent tenant-quality profile in this submarket — average credit score on applications, eviction rate, late-payment / NSF rate, and stable-employment percentage? A property-management company in the area should have these aggregated.
- How much new for-sale + rental construction is in the pipeline within 1–3 miles? Heavy new supply typically softens prices + rents 12–24 months out; constrained supply supports both.
Investment metrics
- 1% rule
- 0.93% ✗
- Cap rate
- 5.95%
- Cash-on-cash
- -1.21%
- DSCR
- 0.95
- GRM
- 8.9
CMA / ARV
- ARV (on-the-fly)
- $342,620
- Comps found
- 12
Show comp detail 12 sales within ~0.75 mi
| Address | Dist | Beds/Ba | Sqft | Sold | Price | $/sf | Match |
|---|---|---|---|---|---|---|---|
| 226 Ridgecrest Rd | 0.00mi | 4/3.0 (+1) | 1,852 (0%) | 0mo | $291,400 | $157 | 91 |
| 228 Ridgecrest Rd | 0.02mi | 4/2.5 (+1) | 1,692 (-9%) | 0mo | $410,000 | $242 | 78 |
| 316 Barrington Rd | 0.28mi | 3/1.5 | 1,714 (-8%) | 1mo | $305,000 | $178 | 71 |
| 219 Barrington Rd | 0.27mi | 3/2.0 | 1,676 (-10%) | 2mo | $309,900 | $185 | 70 |
| 123 Revere Rd | 0.07mi | 3/2.0 | 1,587 (-14%) | 4mo | $300,000 | $189 | 70 |
| 108 Terraceview Rd | 0.35mi | 4/2.0 (+1) | 1,768 (-4%) | 2mo | $276,500 | $156 | 70 |
| 111 Fiordon Rd | 0.49mi | 3/2.0 | 1,740 (-6%) | 0mo | $375,000 | $216 | 67 |
| 206 Edgemont Dr | 0.60mi | 3/1.5 | 1,782 (-4%) | 1mo | $342,000 | $192 | 63 |
| 112 Terrace Cir | 0.35mi | 4/2.5 (+1) | 1,984 (+7%) | 5mo | $321,000 | $162 | 61 |
| 111 Haddonfield Dr | 0.43mi | 3/2.0 | 1,592 (-14%) | 6mo | $200,000 | $126 | 52 |
| 207 Lansdowne Rd | 0.68mi | 3/1.5 | 2,036 (+10%) | 5mo | $399,900 | $196 | 46 |
| 207 Haddonfield Dr | 0.57mi | 4/2.0 (+1) | 2,100 (+13%) | 3mo | $335,000 | $160 | 44 |
Match score weights: distance 35% · size 25% · config 20% · recency 20%. Top-matched comps best support the ARV.
Projected returns pro-forma
-3.0% appreciation · 3.0% rent growth · sell at horizon
- IRR
- -18.2%
- Equity multiple
- 0.36×
- Total profit
- $-55,613
- Equity at exit
- $46,207
- IRR
- -10.4%
- Equity multiple
- 0.37×
- Total profit
- $-54,863
- Equity at exit
- $26,794
Cash invested: $86,772 (down + closing). Projections, not guarantees.
Landlord ↔ Tenant lean methodology
- Overall (STATE)
- 15 Strongly Tenant-Friendly
- State New York
- 15 Strongly Tenant-Friendly · D+10
- County
- — inherits STATE
- City
- — inherits STATE
ZIP-level market 13214
- Home prices YoY
- -10.3%
- Active inventory
- 32
- Price-to-rent
- 8.9×
Monthly cashflow live
- Estimated rent
- $2,890 high interval (Pro) →
- Mortgage (P&I)
- −$1,625
- Tax from tax record
- −$617 /mo · $7,399/yr
- Insurance
- −$129
- HOA
- −$0
- Vacancy / Maint / Mgmt
- −$607
- Net cashflow
- $-88
Break-even live
UW: 25.0% down · 7.5% · 30yr · 1.5% tax · 5.0% vac · 8.0% maint · 8.0% mgmt
Financing live
Cash to close
- Down payment
- $77,475
- Closing costs
- $9,297
- Reserves months
- —
- Total cash needed
- —
Loan-product check · same deal, 3 products live
Conventional
25% down · 7.5% · 30yr
- Down + closing
- —
- Monthly P&I
- —
- Monthly cashflow
- —
- DSCR
- —
- Eligible?
- —
Personal DTI + credit; lowest rate.
DSCR
20% down · 8.5% · 30yr
- Down + closing
- —
- Monthly P&I
- —
- Monthly cashflow
- —
- DSCR
- —
- Eligible?
- —
No personal income docs; deal must DSCR.
Hard money
10% down · 12.0% · 12mo
- Down + closing
- —
- Monthly P&I
- —
- Monthly cashflow
- —
- DSCR
- —
- Eligible?
- —
Short-term bridge; refi at stabilization.
Rent comps 6 comps
| Address | Beds | Baths | Sqft | Rent | $/sqft | DOM | Units | Dist |
|---|---|---|---|---|---|---|---|---|
| 121 Doll Pkwy Unit A Syracuse, NY | 4.0 | 2.0 | 1400 | $2,800 | $2.00 | 13d | 1 | 0.44mi |
| 129 Orvilton Dr Syracuse, NY | 3.0 | 2.5 | 1693 | $2,950 | $1.74 | 44d | 1 | 0.67mi |
| 15 Wexford Rd Syracuse, NY | 4.0 | 1.0 | 1416 | $2,400 | $1.69 | 13d | 1 | 0.94mi |
| 215 Locksley Rd Syracuse, NY | 4.0 | 3.5 | 2352 | $4,300 | $1.83 | 13d | 1 | 0.99mi |
| 102 Elmsford Rd Syracuse, NY | 3.0 | 2.0 | 1297 | $2,295 | $1.77 | 44d | 1 | 1.02mi |
| 108 Harrington Rd Syracuse, NY | 3.0 | 2.0 | 1800 | $2,600 | $1.44 | 13d | 1 | 1.20mi |
Listing history 8 events
-
2026-04-13status Pending
-
2026-03-27$309,900 Active
-
2019-12-20soldstatus $174,900
-
2019-12-13soldstatus $174,900 Closed Sale or Rented
-
2019-11-08status Pending Sale
-
2019-10-17status Under Contract- Do Not Show
-
2019-09-14price $174,000
-
2019-09-04$189,500 Active
ⓘ Source: listings_history table (triggers on properties + properties_extension) + one-shot
backfill from property_details.listing_events for pre-trigger history.
Tax reassessment forecast NY · Partial reset (capped growth)
- Current annual tax
- $7,399 · $617/mo
- Projected year-2 tax
- $7,399 · $617/mo
- Expected delta
- $0/yr ($0/mo · 0.0%)
ⓘ Screening estimate from a state-policy table — verify with the county assessor before closing.
Climate risk First Street
- Flood 1/10 Low FEMA zone X (unshaded) · 0% chance over 30 yrs
- Wildfire 1/10 Low
- Heat 3/10 Moderate 7 d/yr ≥96°F today · 16 d/yr by 30 yrs out
- Wind 1/10 Low 0% chance of damaging wind over 30 yrs
- Air quality 2/10 Low 0 unhealthy d/yr today · 1 by 30 yrs out
Nearby sold comps map
Loading sold comps map…
Walkable amenities ~0.75 mi
Loading nearby amenities…
Taxation est. · year 1
- Rental income
- $34,682
- − Mortgage interest
- −$17,359
- − Property taxes
- −$7,399
- − Insurance
- −$1,550
- − Repairs & maintenance
- −$2,775
- − Management
- −$2,775
- − Depreciation
- −$9,015
- Taxable loss
- −$6,190
- Est. tax savings @ 24.0%
- +$1,486
- After-tax cash flow
- $434/yr
For passive investors: Depreciation is non-cash, so a rental often shows a tax loss while cash-flowing — sheltering income. Rental losses are passive: they offset passive income freely, and up to $25,000/yr can offset ordinary (W-2) income if you actively participate and your MAGI is under $100k (phasing out to $0 by $150k); unused losses carry forward. On sale, claimed depreciation is recaptured at up to 25%, and gains may owe capital-gains tax (a 1031 exchange can defer both). Figures are a year-1 estimate at your 24.0% rate — not tax advice; consult a CPA.
Schools (NCES district)
- District
- Jamesville-Dewitt Central School District
- NCES district ID
- 3609090
- Math proficiency
- 69% ▼ -8.00%
- Reading proficiency
- 71% ▲ 3.00%
- Median HH income
- $74,483
- Composite
- 61.71/100
- National rank
- #739
- State rank
- #124 of 590 in NY
Livability — De Witt
No livability data for this city. (Only ~50 U.S. cities are tracked.)
Census & demographics
- Census place
- De Witt, NY
- City population
- 8,713
- Population (ZIP)
- 8,713
Population outlook (Onondaga County) Hauer SSP2
- Today (2025)
- 467,894 people
- By 2030
- 463,381 · -1.0%
- By 2040
- 447,697 · -4.3%
- By 2050
- 426,399 · -8.9%
- By 2075
- 373,661 · -20.1%
- By 2100
- 307,967 · -34.2%
Race, ethnicity, and origin ACS 2023
- Neighborhood character
- Predominantly White (67%)
- Race & ethnicity
- White 67% Black 14% Two or more races 9% Hispanic / Latino 7% Asian 5% Native American 1%
- Hispanic origin (detail)
- Dominican 3%
- Common ancestry
- Romanian 6% Lithuanian 3% Italian 2%
- Foreign-born
- 8% · Canada, China, Vietnam
- Languages at home
- 84% English-only · Spanish 7% Chinese 2% Other Indo-European 2%
Political lean MEDSL · Onondaga
- 2024 margin
- D (+17.3) · D 58.6% · R 41.4%
- 2008→2024 swing
- -3.0pp toward R · 2008: 20.3pp · 2024: 17.3pp
- All cycles
- 2024: D+17.3 2020: D+20.6 2016: D+12.8 2012: D+21.1 2008: D+20.3
Not yet ingested
- Civics
- —
Market trends
- HPI YoY
- ▼ -38.16%
- Current HPI
- 333.2268
- Rent YoY
- —
- Metro
- —
- State GDP YoY
- ▲ 2.60%
- F500 in state
- 92
Industry mix (Fortune 500 HQ in NY)
| Industry | F500 HQs | Revenue |
|---|---|---|
| Financial Services | 10 | $950B |
|
||
| Consumer Goods | 9 | $162B |
|
||
| Insurance | 4 | $225B |
|
||
| Telecommunications | 2 | $144B |
|
||
| Pharmaceuticals | 2 | $112B |
|
||
| Media / Entertainment | 2 | $69B |
|
||
Price history
+63.5% since first listed8 events — show timeline
- 2026-04-13 Pending — CNYIS
- 2026-03-27 Listed $309,900 CNYIS
- 2019-12-20 Sold (Public Records) $174,900 Public Records
- 2019-12-13 Sold (MLS) $174,900 CNYIS
- 2019-11-08 Pending — CNYIS
- 2019-10-17 Pending — CNYIS
- 2019-09-14 Price Changed $174,000 CNYIS
- 2019-09-04 Listed $189,500 CNYIS
Property tax history
+2.0%/yrLatest (2025): $7,399 · +3.8% YoY. Source: county tax records.
Cash-flow waterfall
monthlySold comps — $/sqft
last 12 mo · ≤1 miLoading sold comps…