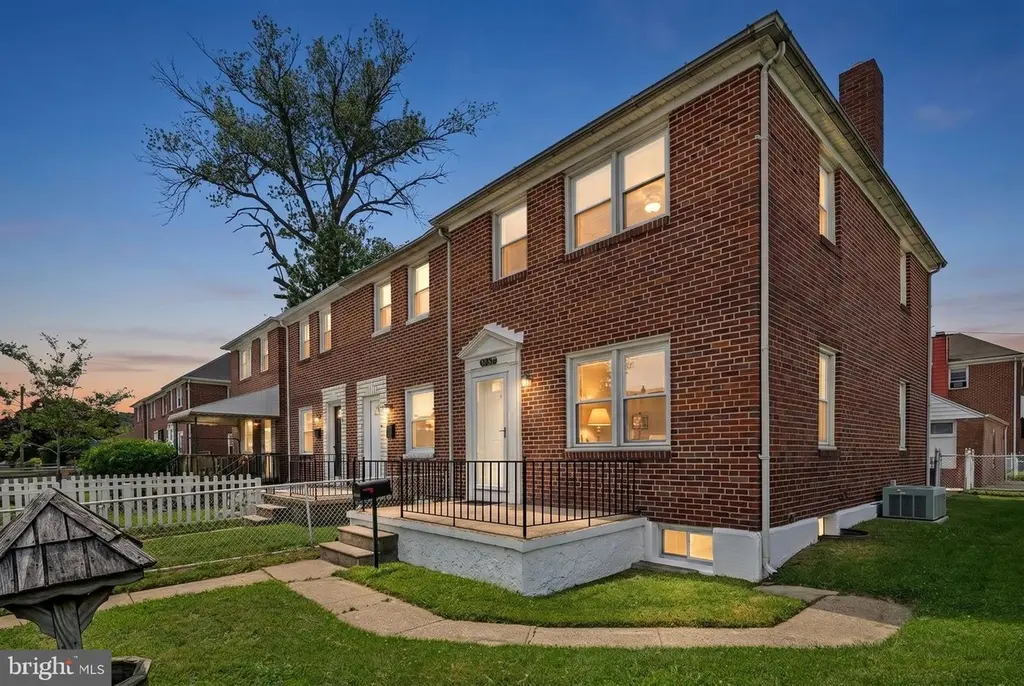
2169 Firethorn Rd · Middle River, MD
Flood risk 1/10 · Minimal
- FEMA flood zone
- X (unshaded)
- Chance of flooding over 30 yrs
- 0.0%
- Est. flood insurance / yr
- $473 – $860
Fire risk 1/10 · Minimal
- Est. fire insurance / yr
- $755 – $1,403
Heat risk 8/10 · Major
- Hot days now (above 104°F)
- 7 days/yr
- Hot days in 30 yrs
- 15 days/yr
Wind risk 6/10 · Moderate
- Chance of severe wind over 30 yrs
- 45.0%
Air-quality risk 5/10 · Moderate
- Unhealthy air days now
- 6 days/yr
- Unhealthy air days in 30 yrs
- 8 days/yr
Risk factors via First Street. Map © Google.
Why this score? — see what drove the D grade
The composite is a weighted blend of 9 inputs, each scored 0–100. Each bar is that input's sub-score; the figure is the points it added to the 100-point composite (weight × sub-score).
- Cash flow +17.2/30.0
- DSCR +5.4/10.0
- 1% rule +4.2/10.0
- Livability +3.9/5.0
- ARV discount +3.7/15.0
- Rent growth +2.7/5.0
- Condition / age +2.5/5.0
- Schools +2.3/10.0
- Appreciation +0.0/10.0
$225,000
🖨 Deal sheet (PDF) 📄 Offer letter ✓ Due diligence
Listing remarks MLS
Great opportunity in this newly renovated 3 bedroom 1.5 bath end of group home! Fresh paint and flooring, large living room, separate dining room, huge fully finished basement with a separate laundry room, covered rear patio for entertaining, detached 2 car garage and more! This is a Fannie Mae Homepath property.
Key facts
- Low-maintenance yard
- Colonial townhouse
- Rear-entry garage
Tags
Property features AI
Finance
- Other: Ownership interest: Ground Rent
- Financial info: Ground rent exists; payment is semi-annual
Exterior
- Parking: Attached garage with rear entry and additional storage (4 garage spaces); Off-street parking; On-street parking
- Utilities: Public water; Public sewer; Natural gas for heating and hot water; Electric cooling
- Home design: End of Row/Townhouse; Year built estimated
- Construction: Brick construction; Other foundation type
- Exterior features: End of row townhouse; Above grade and below grade structures; Ground rent (paid semi-annually)
Interior
- Kitchen: Stove; Refrigerator; Exhaust fan
- Basement: Partially finished basement; Sump pump; Walkout stairs
- Bedrooms: Three bedrooms on the upper level
- Flooring: Carpet; Tile/brick; Laminate plank
- Bathrooms: One full bathroom; One half bathroom
- Heating & cooling: Forced air heating (natural gas); Central air conditioning (electric)
- Interior features: Traditional floor plan; Tub/shower
- Laundry & utility: Washer; Gas dryer; Gas water heater
Neighborhood map
What this means for you Summary
Snapshot
- This is a 3-bed/1.0-bath townhouse listed at $225k.
Deal economics
- At list price, monthly cash flow is $160 ($2k/yr) — positive.
- The deal already cash-flows at list — no discount required.
- To meet the 1% rule (rent ≥ 1% of price), the offer needs to be $207k (8.1% below list).
- Recommended offer: $207k (8.1% below list) — sets the bar for 1% rule.
- Cap rate 7.1% vs local median 4.2% in Middle River — top-decile yield for the area; either an underpriced asset or a hidden risk that comps aren't pricing in. Stress-test before assuming the spread holds.
Location & tenants
- Location reads 78/100 on livability (#76 in MD, #2,777 nationally) — a middle-class / working-renter tenant base. Strengths: commute A+, housing A+, health & safety A+; Watch: crime F.
- Baltimore County Public Schools (suburban): math 15% / reading 34% proficiency, ranked #11 of 24 in MD (top 46%) — low school quality limits family demand, transient renter base, plan for 1-2y turnover.
- Zoned schools: Hawthorne Elementary (math 2% / reading 8%, grade F, #766 of 860 statewide, top 93%, 491 students, 87% FRL); Stemmers Run Middle (math 5% / reading 28%, grade F, #174 of 225 statewide, top 81%, 838 students, 68% FRL); Kenwood High (math 10% / reading 43%, grade F, #161 of 222 statewide, top 72%, 1,908 students, 63% FRL) — zoned schools average 73% FRL vs 39% district-wide (34 pts higher); higher-poverty schools than district average — tighter screening recommended.
- Market conditions: Rents flat; 252 active listings in the ZIP; 37 comparable units currently listed for rent nearby; rentals at typical pace (median 24d on market — plan ~3-4 weeks tenant-placement turnaround); solid renter incomes; 1,511 units permitted in Baltimore County in 2024 (643 in 5+ unit buildings).
- This rent runs 30% of the median local income ($82k/yr) — at the standard rent-burdened threshold; future hikes will face affordability resistance.
Forward outlook
- Local home prices are declining (-3.0%/yr); year-one equity from $2k of loan paydown is wiped out by about $7k of value loss. Plan a longer hold.
- Baltimore County population projected at +12% by 2050 — modest demand growth; plan on rents tracking national, not racing it.
Negotiation context
- Only 2 days on market — expect competitive offers; lowballing is unlikely to land.
- 8 sale attempts since 15y ago with the ask held roughly flat each time — persistent listings suggest the price (not the market) is what's stuck; bring a comps-based counter.
- Current owner paid $100k; list at $225k implies a 125% gain — meaningful room to come down on a strong offer.
Risks & watch-outs
- Watch-outs: built in 1953 — expect roof / HVAC / electrical / plumbing capex.
- Climate carrying-cost: major wind risk, 45% chance of damaging wind over 30y; extreme-heat days projected 7→15/yr by 2055 (HVAC capex compounding) — expect insurance premiums to compound above CPI over the hold.
Questions for the listing agent
- Built in 1953 — when were the roof, HVAC, electrical panel, plumbing, and water heater last replaced?
- Is there a deadline driving the sale (1031 exchange, divorce, estate, relocation)? That informs how much negotiation room exists.
- Schools are F-rated, which usually means shorter tenancies and higher turnover. Who's the typical renter profile here, and what's been the actual vacancy rate?
- Crime grade is F in this area — have there been break-ins, vandalism, or insurance claims at this property in the last 3 years? What carrier currently insures it and at what premium?
- The area grade is low — what's the realistic commute time and amenity access for the typical tenant pool here? Any planned neighborhood developments (good or bad) we should know about?
- What's the average days-on-market for RENTAL listings here right now (not sales)? A rising rental-DOM trend means longer vacancies and softer asking-rent achievability than the comps imply.
- What's the recent tenant-quality profile in this submarket — average credit score on applications, eviction rate, late-payment / NSF rate, and stable-employment percentage? A property-management company in the area should have these aggregated.
- How much new for-sale + rental construction is in the pipeline within 1–3 miles? Heavy new supply typically softens prices + rents 12–24 months out; constrained supply supports both.
Investment metrics
- 1% rule
- 0.92% ✗
- Cap rate
- 7.15%
- Cash-on-cash
- 3.05%
- DSCR
- 1.14
- GRM
- 9.1
CMA / ARV
- ARV (on-the-fly)
- $207,360
- Comps found
- 12
Show comp detail 12 sales within ~0.75 mi
| Address | Dist | Beds/Ba | Sqft | Sold | Price | $/sf | Match |
|---|---|---|---|---|---|---|---|
| 2151 Coralthorn Rd | 0.06mi | 3/1.0 | 1,194 (+4%) | 2mo | $185,500 | $155 | 89 |
| 349 Dark Head Rd | 0.15mi | 3/2.0 | 1,152 (0%) | 6mo | $240,000 | $208 | 84 |
| 2165 Firethorn Rd | 0.01mi | 3/1.5 | 1,024 (-11%) | 6mo | $135,000 | $132 | 74 |
| 2169 Redthorn Rd | 0.11mi | 3/1.5 | 1,272 (+10%) | 5mo | $161,000 | $127 | 72 |
| 2247 Graythorn Rd | 0.23mi | 3/1.0 | 1,272 (+10%) | 2mo | $233,000 | $183 | 70 |
| 404 Grovethorn | 0.22mi | 3/1.5 | 1,274 (+11%) | 4mo | $220,000 | $173 | 67 |
| 2134 Firethorn Rd | 0.06mi | 3/2.0 | 1,280 (+11%) | 11mo | $229,900 | $180 | 65 |
| 53 S Hawthorne Rd | 0.25mi | 3/2.0 | 1,024 (-11%) | 9mo | $222,100 | $217 | 58 |
| 2134 Redthorn Rd | 0.15mi | 3/1.5 | 1,324 (+15%) | 11mo | $233,620 | $176 | 57 |
| 133 Riverthorn Rd | 0.14mi | 4/1.5 (+1) | 1,324 (+15%) | 8mo | $147,500 | $111 | 55 |
| 658 Kingston Rd | 0.51mi | 3/1.0 | 1,020 (-12%) | 6mo | $205,000 | $201 | 52 |
| 710 Kingston Rd | 0.54mi | 3/2.0 | 1,319 (+14%) | 1mo | $239,900 | $182 | 46 |
Match score weights: distance 35% · size 25% · config 20% · recency 20%. Top-matched comps best support the ARV.
Projected returns pro-forma
-3.0% appreciation · 0.83% rent growth · sell at horizon
- IRR
- -13.8%
- Equity multiple
- 0.51×
- Total profit
- $-30,683
- Equity at exit
- $33,548
- IRR
- -8.7%
- Equity multiple
- 0.51×
- Total profit
- $-31,000
- Equity at exit
- $19,454
Cash invested: $63,000 (down + closing). Projections, not guarantees.
Landlord ↔ Tenant lean methodology
- Overall (STATE)
- 27 Tenant-Leaning
- State Maryland
- 27 Tenant-Leaning · D+14
- County
- — inherits STATE
- City
- — inherits STATE
ZIP-level market 21220
- Rents YoY
- 0.8%
- Active inventory
- 252
- Price-to-rent
- 9.1×
Monthly cashflow live
- Estimated rent
- $2,067 high interval (Pro) →
- Mortgage (P&I)
- −$1,180
- Tax from tax record
- −$199 /mo · $2,388/yr
- Insurance
- −$94
- HOA
- −$0
- Vacancy / Maint / Mgmt
- −$434
- Net cashflow
- $160
Break-even live
Sensitivity live
| Price | -10% $288 | -5% $224 | +0% $160 | +5% $97 | +10% $33 |
|---|---|---|---|---|---|
| Rent | -10% $-3 | -5% $79 | +0% $160 | +5% $242 | +10% $324 |
| Rate | -1.0pp $274 | -0.5pp $218 | base $160 | +0.5pp $102 | +1.0pp $43 |
UW: 25.0% down · 7.5% · 30yr · 1.5% tax · 5.0% vac · 8.0% maint · 8.0% mgmt
Financing live
Cash to close
- Down payment
- $56,250
- Closing costs
- $6,750
- Reserves months
- —
- Total cash needed
- —
Loan-product check · same deal, 3 products live
Conventional
25% down · 7.5% · 30yr
- Down + closing
- —
- Monthly P&I
- —
- Monthly cashflow
- —
- DSCR
- —
- Eligible?
- —
Personal DTI + credit; lowest rate.
DSCR
20% down · 8.5% · 30yr
- Down + closing
- —
- Monthly P&I
- —
- Monthly cashflow
- —
- DSCR
- —
- Eligible?
- —
No personal income docs; deal must DSCR.
Hard money
10% down · 12.0% · 12mo
- Down + closing
- —
- Monthly P&I
- —
- Monthly cashflow
- —
- DSCR
- —
- Eligible?
- —
Short-term bridge; refi at stabilization.
Rent comps 37 comps
| Address | Beds | Baths | Sqft | Rent | $/sqft | DOM | Units | Dist |
|---|---|---|---|---|---|---|---|---|
| 2202 Firethorn Rd Middle River, MD | 3.0 | 2.5 | 1324 | $2,300 | $1.74 | 45d | 1 | 0.06mi |
| 2203 Redthorn Rd Middle River, MD | 3.0 | 2.0 | 1144 | $2,200 | $1.92 | 12d | 1 | 0.12mi |
| 120 Kingston Rd Middle River, MD | 3.0 | 2.0 | 1024 | $1,950 | $1.90 | 25d | 1 | 0.17mi |
| 433 Grovethorn Rd Middle River, MD | 3.0 | 2.0 | 1024 | $2,000 | $1.95 | 23d | 1 | 0.20mi |
| 2167 Graythorn Rd Middle River, MD | 3.0 | 1.5 | 1324 | $1,900 | $1.44 | 25d | 1 | 0.21mi |
| 2125 Hawthorne Rd Middle River, MD | 3.0 | 2.0 | 1299 | $2,100 | $1.62 | 45d | 1 | 0.23mi |
| 60 S Hawthorne Rd Middle River, MD | 3.0 | 1.0 | 1234 | $2,250 | $1.82 | 45d | 1 | 0.24mi |
| 2242 Graythorn Rd Middle River, MD | 3.0 | 1.5 | 1024 | $2,195 | $2.14 | 45d | 1 | 0.26mi |
| 47 S Hawthorne Rd Middle River, MD | 3.0 | 1.0 | 1024 | $1,900 | $1.86 | 25d | 1 | 0.27mi |
| 2128 Cockspur Rd Middle River, MD | 3.0 | 1.5 | 1272 | $2,100 | $1.65 | 25d | 1 | 0.39mi |
| 439 Hopkins Landing Dr Essex, MD | 2.0 | 2.0 | 1485 | $1,795 | $1.21 | 12d | 1 | 0.55mi |
| 736 West Kingsway Middle River, MD | 3.0 | 1.0 | 1100 | $1,742 | $1.58 | 21d | 7 | 0.61mi |
| 1 Alder Dr Middle River, MD | 1.0–3.0 | 1.0 | 1000 | $2,249 | $2.25 | 0d | 9 | 0.70mi |
| 19 Mooring Ct Essex, MD | 3.0 | 1.5 | 1439 | $1,900 | $1.32 | 0d | 1 | 0.76mi |
| 28 Ebbing Ct Essex, MD | 3.0 | 2.5 | 1464 | $2,095 | $1.43 | 0d | 1 | 0.79mi |
| 153 Bennett Rd Unit Labs Essex, MD | 2.0 | 2.0 | 1196 | $1,800 | $1.51 | 6d | 1 | 0.82mi |
| 233 Orville Rd Essex, MD | 3.0 | 2.0 | 1144 | $1,850 | $1.62 | 45d | 1 | 0.84mi |
| 303 Endsleigh Ave Middle River, MD | 3.0 | 2.0 | 1144 | $1,950 | $1.70 | 23d | 1 | 0.92mi |
| 54 Stemmers Run Rd Essex, MD | 3.0 | 2.5 | 1260 | $1,950 | $1.55 | 45d | 1 | 0.98mi |
| 1542 Becklow Ave Middle River, MD | 4.0 | 2.0 | 1224 | $1,800 | $1.47 | 0d | 1 | 0.99mi |
| 1516 Becklow Ave Middle River, MD | 3.0 | 1.0 | 1144 | $2,100 | $1.84 | 23d | 1 | 1.00mi |
| 1513 Aldeney Ave Middle River, MD | 4.0 | 2.0 | 1324 | $2,295 | $1.73 | 25d | 1 | 1.03mi |
| 1314 First Rd Middle River, MD | 2.0 | 1.0 | 1008 | $1,700 | $1.69 | 0d | 1 | 1.03mi |
| 201 Middleway Rd Middle River, MD | 1.0–2.0 | 1.0 | 750 | $1,571 | $2.09 | 4d | 24 | 1.05mi |
| 832 N Marlyn Ave Essex, MD | 3.0 | 2.0 | 1416 | $2,300 | $1.62 | 45d | 1 | 1.08mi |
| 2 Driftwood Ct Essex, MD | 2.0 | 1.0 | 720 | $1,168 | $1.62 | 0d | 5 | 1.08mi |
| 42 Holcumb Ct Middle River, MD | 3.0 | 1.5 | 1452 | $2,200 | $1.52 | 45d | 1 | 1.11mi |
| 326 Stemmers Run Rd Essex, MD | 4.0 | 2.0 | 1144 | $2,300 | $2.01 | 45d | 1 | 1.16mi |
| 22 Nakota Ct Middle River, MD | 3.0 | 1.5 | 1194 | $2,000 | $1.68 | 45d | 1 | 1.19mi |
| 421 Torner Rd Essex, MD | 3.0 | 2.0 | 1024 | $2,050 | $2.00 | 23d | 1 | 1.21mi |
| 4 Essex Ave Unit A Essex, MD | 2.0 | 1.0 | 800 | $1,250 | $1.56 | 25d | 1 | 1.26mi |
| 2 Chelmsford Ct Middle River, MD | 3.0 | 1.5 | 1122 | $2,100 | $1.87 | 3d | 1 | 1.26mi |
| 1409 Nicolay Way Essex, MD | 3.0 | 2.0 | 1008 | $1,950 | $1.93 | 6d | 1 | 1.30mi |
| 1402 Nicolay Way Unit 1 Essex, MD | 3.0 | 1.5 | 1432 | $1,925 | $1.34 | 6d | 1 | 1.31mi |
| 1402 Nicolay Way Essex, MD | 3.0 | 2.0 | 1432 | $1,925 | $1.34 | 5d | 1 | 1.31mi |
| 706 Seawall Rd Essex, MD | 3.0 | 1.0 | 1114 | $1,900 | $1.71 | 6d | 1 | 1.39mi |
| 1460 Hadwick Dr Essex, MD | 1.0–2.0 | 1.0 | 661 | $1,308 | $1.98 | 0d | 1 | 1.48mi |
Listing history 2 events
-
2026-06-21remarks 694-char remark
-
2026-06-21$225,000 Active 2 DOM
ⓘ Source: listings_history table (triggers on properties + properties_extension) + one-shot
backfill from property_details.listing_events for pre-trigger history.
Tax reassessment forecast MD · Partial reset (capped growth)
- Current annual tax
- $2,388 · $199/mo
- Projected year-2 tax
- $2,420 · $202/mo
- Expected delta
- +$32/yr (+$3/mo · 1.4%)
ⓘ Screening estimate from a state-policy table — verify with the county assessor before closing.
Climate risk First Street
- Flood 1/10 Low FEMA zone X (unshaded) · 0% chance over 30 yrs
- Wildfire 1/10 Low
- Heat 8/10 Severe 7 d/yr ≥104°F today · 15 d/yr by 30 yrs out
- Wind 6/10 Major 45% chance of damaging wind over 30 yrs
- Air quality 5/10 Major 6 unhealthy d/yr today · 8 by 30 yrs out
Nearby sold comps map
Loading sold comps map…
Walkable amenities ~0.75 mi
Loading nearby amenities…
Taxation est. · year 1
- Rental income
- $24,806
- − Mortgage interest
- −$12,603
- − Property taxes
- −$2,388
- − Insurance
- −$1,125
- − Repairs & maintenance
- −$1,984
- − Management
- −$1,984
- − Depreciation
- −$6,545
- Taxable loss
- −$1,825
- Est. tax savings @ 24.0%
- +$438
- After-tax cash flow
- $2,363/yr
For passive investors: Depreciation is non-cash, so a rental often shows a tax loss while cash-flowing — sheltering income. Rental losses are passive: they offset passive income freely, and up to $25,000/yr can offset ordinary (W-2) income if you actively participate and your MAGI is under $100k (phasing out to $0 by $150k); unused losses carry forward. On sale, claimed depreciation is recaptured at up to 25%, and gains may owe capital-gains tax (a 1031 exchange can defer both). Figures are a year-1 estimate at your 24.0% rate — not tax advice; consult a CPA.
Schools (NCES district)
- District
- Baltimore County Public Schools
- NCES district ID
- 2400120
- Math proficiency
- 15% ▼ -16.00%
- Reading proficiency
- 34% ▼ -5.00%
- Median HH income
- $66,746
- Composite
- 23.17/100
- National rank
- #7948
- State rank
- #11 of 24 in MD
Livability — Middle River
- Score
- 78/100
- State rank
- #76
- US rank
- #2777
Category grades
Schools grade is shown separately in the Schools card above.
Census & demographics
- Census place
- Middle River, MD
- County
- Baltimore County · 769,527 people
- City population
- 42,824
- Metro
- Baltimore-Columbia-Towson, MD
- Population (ZIP)
- 42,824
- Household income
- $81,817
- Rent vs Own
- Severe rent burden
- 1921.0
Population outlook (Baltimore County) Hauer SSP2
- Today (2025)
- 885,518 people
- By 2030
- 909,272 · +2.7%
- By 2040
- 951,547 · +7.5%
- By 2050
- 990,955 · +11.9%
- By 2075
- 1,086,411 · +22.7%
- By 2100
- 1,135,078 · +28.2%
Race, ethnicity, and origin ACS 2023
- Neighborhood character
- Diverse neighborhood (Simpson 0.60)
- Race & ethnicity
- White 57% Black 27% Two or more races 6% Hispanic / Latino 6% Asian 5%
- Hispanic origin (detail)
- Puerto Rican 1%
- Common ancestry
- Romanian 4% Ukrainian 2% Lithuanian 1%
- Foreign-born
- 12% · Canada, Vietnam
- Languages at home
- 86% English-only · Spanish 3% Arabic 3% Tagalog/Filipino 2%
Political lean MEDSL · Baltimore
- 2024 margin
- Strong D (+24.5) · D 61.0% · R 36.5% · Other 2.5%
- 2008→2024 swing
- +9.9pp toward D · 2008: 14.6pp · 2024: 24.5pp
- All cycles
- 2024: D+24.5 2020: D+27.0 2016: D+17.4 2012: D+16.4 2008: D+14.6
Not yet ingested
- Civics
- —
Market trends
- HPI YoY
- ▼ -199.31%
- Current HPI
- 254.5597
- Rent YoY
- ▲ 0.83%
- Metro
- Baltimore-Columbia-Towson, MD
- State GDP YoY
- ▲ 2.97%
- F500 in state
- 12
Industry mix (Fortune 500 HQ in MD)
| Industry | F500 HQs | Revenue |
|---|---|---|
| Aerospace / Defense | 1 | $71B |
|
||
| Utilities | 1 | $25B |
|
||
| Hotels | 1 | $24B |
|
||
| Consumer Goods | 1 | $7B |
|
||
| Real Estate | 1 | $6B |
|
||
| Chemicals | 1 | $2B |
|
||
Price history
+240.9% since first listed22 events — show timeline
- 2026-06-19 Listed $225,000 BRIGHT MLS
- 2026-06-19 Coming Soon $225,000 BRIGHT MLS
- 2015-05-29 Sold (MLS) $99,900 MRIS
- 2015-05-29 Sold (MLS) $99,900 BRIGHT MLS
- 2015-04-13 Pending — MRIS
- 2015-04-06 Price Changed $99,900 MRIS
- 2015-03-04 Listed $114,900 MRIS
- 2015-03-04 Listed $99,900 BRIGHT MLS
- 2013-09-05 Delisted — MRIS
- 2013-09-05 Listing Removed — BRIGHT MLS
- 2013-05-19 Pending — MRIS
- 2013-02-02 Relisted — MRIS
- 2012-07-29 Pending — MRIS
- 2012-06-25 Relisted — MRIS
- 2012-06-25 Price Changed — MRIS
- 2012-06-10 Delisted — MRIS
- 2012-04-02 Relisted — MRIS
- 2012-02-08 Pending — MRIS
- 2011-12-29 Price Changed — MRIS
- 2011-07-07 Listed — MRIS
- 2011-07-07 Listed $99,900 BRIGHT MLS
- 1987-11-04 Sold (Public Records) $66,000 Public Records
Property tax history
+3.3%/yrLatest (2025): $2,388 · +6.7% YoY. Source: county tax records.
Cash-flow waterfall
monthlySold comps — $/sqft
last 12 mo · ≤1 miLoading sold comps…