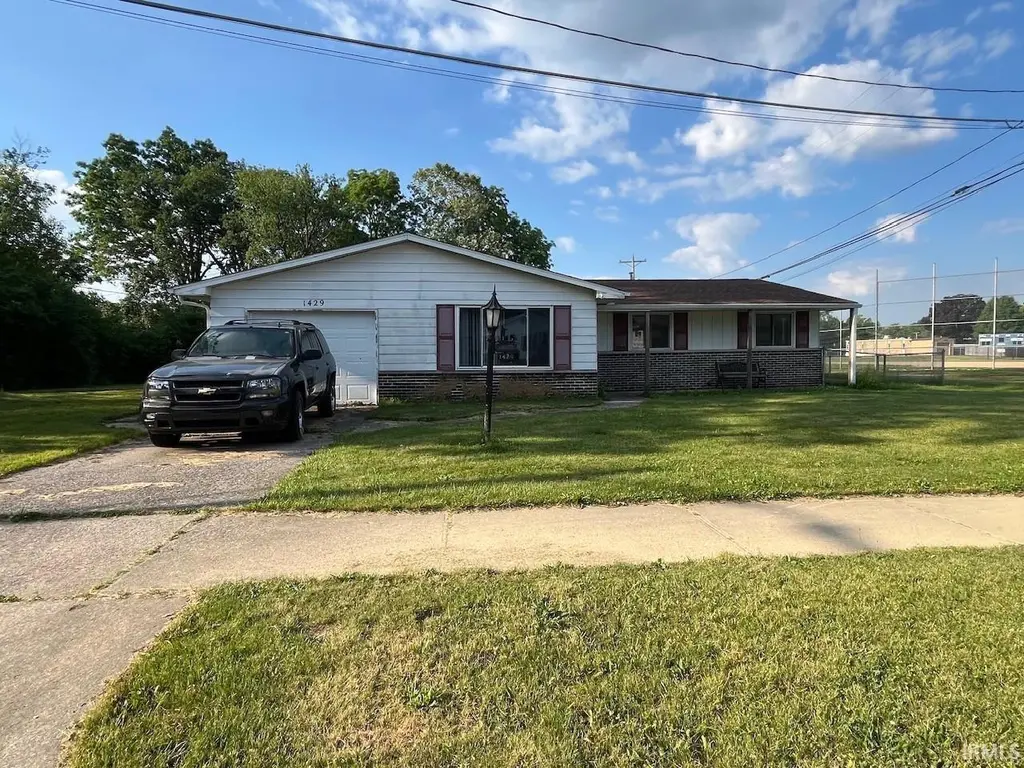
1429 Irene Ave · Fort Wayne, IN
Flood risk 1/10 · Minimal
- FEMA flood zone
- X (unshaded)
- Chance of flooding over 30 yrs
- 0.0%
- Est. flood insurance / yr
- $507 – $1,088
Fire risk 1/10 · Minimal
- Est. fire insurance / yr
- $717 – $1,331
Heat risk 3/10 · Minor
- Hot days now (above 100°F)
- 7 days/yr
- Hot days in 30 yrs
- 17 days/yr
Wind risk 2/10 · Minimal
- Chance of severe wind over 30 yrs
- —
Air-quality risk 3/10 · Minor
- Unhealthy air days now
- 2 days/yr
- Unhealthy air days in 30 yrs
- 3 days/yr
Risk factors via First Street. Map © Google.
Why this score? — see what drove the B grade
The composite is a weighted blend of 9 inputs, each scored 0–100. Each bar is that input's sub-score; the figure is the points it added to the 100-point composite (weight × sub-score).
- Cash flow +27.9/30.0
- ARV discount +15.0/15.0
- DSCR +9.9/10.0
- 1% rule +7.5/10.0
- Rent growth +4.2/5.0
- Livability +4.2/5.0
- Condition / age +2.5/5.0
- Schools +2.2/10.0
- Appreciation +0.0/10.0
$120,000
🖨 Deal sheet (PDF) 📄 Offer letter ✓ Due diligence
Listing remarks
Investor alert. This one has great location, great square foot and lay out. 3 bedroom, 1.5 bath, two living room spaces, two patios, fenced back yard, newer roof. Some of the work had begun. This is an estate no disclosures. Cash only.
Key facts
- Two patios
- Fenced back yard
- Newer roof
Tags
Property features AI
Finance
- Other: Property listed by RE/MAX Results
Exterior
- Parking: Attached garage (1 car)
- Utilities: Public water; Public sewer; Electric service
- Home design: Single family residence; Site-built home; One story
- Construction: Aluminum siding and brick exterior; Slab foundation
- Exterior features: Partial chain link fencing; Level lot; Lot dimensions approximately 85 x 100
Interior
- Kitchen: Dishwasher; Refrigerator; Electric cooktop; Oven
- Bedrooms: Total of 7 rooms (bedroom count not specified)
- Bathrooms: 1 full bathroom; 1 half bathroom; 2 bathrooms on the main level
- Heating & cooling: Forced air heating; Central air; Ceiling fan(s) for additional cooling
- Interior features: Ceiling fan(s); One fireplace
- Laundry & utility: Washer included; Electric dryer hookup on the main level; Gas water heater
Neighborhood map
What this means for you Summary
Snapshot
- This is a 3-bed/1.5-bath single-family listed at $120k.
Deal economics
- At list price, monthly cash flow is $369 ($4k/yr) — positive.
- The deal already cash-flows at list — no discount required.
- Meets the 1% rule at list price ($2k rent vs $120k).
- Cap rate 10.0% vs local median 4.8% in Fort Wayne — top-decile yield for the area; either an underpriced asset or a hidden risk that comps aren't pricing in. Stress-test before assuming the spread holds.
Location & tenants
- Location reads 84/100 on livability (#6 in IN, #676 nationally) — a professional / high-income tenant draw. Strengths: amenities A+, commute A+, cost of living A+; Watch: crime C-, employment D+.
- Fort Wayne Community Schools (urban): math 22% / reading 29% proficiency, ranked #263 of 301 in IN (top 87%) — low school quality limits family demand, transient renter base, plan for 1-2y turnover; 60% free/reduced lunch — lower-income household profile, screen leases tightly.
- Zoned schools: Forest Park Elementary School (math 21% / reading 22%, grade F, #803 of 994 statewide, top 81%, 601 students, 75% FRL); Northwood Middle School (math 14% / reading 22%, grade F, #279 of 330 statewide, top 86%, 587 students, 70% FRL); North Side High School (math 19% / reading 51%, grade F, #266 of 369 statewide, top 73%, 1,474 students, 66% FRL).
- Market conditions: Rents rising fast (+7.0%/yr); 88 active listings in the ZIP; 11 comparable units currently listed for rent nearby; rentals lingering (median 45d on market — plan ~5-8 weeks vacancy on turnover, expect pricing pressure); 55% of comp listings sitting > 30 days — soft ceiling on asking rent; 1,861 units permitted in Allen County in 2024 (576 in 5+ unit buildings).
- This rent runs 34% of the median local income ($53k/yr) — at the standard rent-burdened threshold; future hikes will face affordability resistance.
Forward outlook
- Local home prices are declining (-3.0%/yr); year-one equity from $830 of loan paydown is wiped out by about $4k of value loss. Plan a longer hold.
- Allen County population projected at +10% by 2050 — modest demand growth; plan on rents tracking national, not racing it.
- At projected returns (-3.0% appreciation + 7.0% rent growth), your $34k cash investment doubles in ~7 years — after that, you're playing with house money.
Negotiation context
- Only 1 days on market — expect competitive offers; lowballing is unlikely to land.
Questions for the listing agent
- Built in 1964 — when were the roof, HVAC, electrical panel, plumbing, and water heater last replaced?
- Is there a deadline driving the sale (1031 exchange, divorce, estate, relocation)? That informs how much negotiation room exists.
- Schools are D-rated, which usually means shorter tenancies and higher turnover. Who's the typical renter profile here, and what's been the actual vacancy rate?
- What's the average days-on-market for RENTAL listings here right now (not sales)? A rising rental-DOM trend means longer vacancies and softer asking-rent achievability than the comps imply.
- What's the recent tenant-quality profile in this submarket — average credit score on applications, eviction rate, late-payment / NSF rate, and stable-employment percentage? A property-management company in the area should have these aggregated.
- How much new for-sale + rental construction is in the pipeline within 1–3 miles? Heavy new supply typically softens prices + rents 12–24 months out; constrained supply supports both.
Investment metrics
- 1% rule
- 1.25% ✓
- Cap rate
- 9.98%
- Cash-on-cash
- 13.18%
- DSCR
- 1.59
- GRM
- 6.7
CMA / ARV
- ARV (on-the-fly)
- $191,284
- Comps found
- 12
Show comp detail 12 sales within ~0.75 mi
| Address | Dist | Beds/Ba | Sqft | Sold | Price | $/sf | Match |
|---|---|---|---|---|---|---|---|
| 1429 Irene Ave | 0.00mi | 3/1.5 | 1,649 (0%) | 0mo | $130,000 | $79 | 100 |
| 2727 Princeton Ave | 0.43mi | 3/1.5 | 1,611 (-2%) | 2mo | $198,000 | $123 | 75 |
| 1650 Huffman Blvd | 0.34mi | 3/1.5 | 1,556 (-6%) | 3mo | $169,900 | $109 | 72 |
| 1513 Huffman Blvd | 0.38mi | 3/2.0 | 1,729 (+5%) | 3mo | $200,000 | $116 | 70 |
| 2130 N Highlands Blvd | 0.32mi | 3/2.0 | 1,472 (-11%) | 0mo | $190,000 | $129 | 65 |
| 1511 Oakland St | 0.70mi | 3/1.5 | 1,668 (+1%) | 3mo | $152,000 | $91 | 62 |
| 1611 Cherokee Rd | 0.43mi | 3/1.0 | 1,420 (-14%) | 2mo | $192,000 | $135 | 53 |
| 2520 Cortland Ave | 0.69mi | 3/1.0 | 1,517 (-8%) | 1mo | $180,000 | $119 | 52 |
| 633 Elmer Ave Ave | 0.58mi | 3/1.5 | 1,468 (-11%) | 3mo | $136,000 | $93 | 52 |
| 604 W State Blvd | 0.65mi | 3/1.0 | 1,405 (-15%) | 2mo | $156,000 | $111 | 42 |
| 1115 W 4th St | 0.70mi | 3/2.0 | 1,426 (-14%) | 1mo | $167,000 | $117 | 42 |
| 1905 Spring St | 0.70mi | 3/2.0 | 1,892 (+15%) | 2mo | $179,900 | $95 | 39 |
Match score weights: distance 35% · size 25% · config 20% · recency 20%. Top-matched comps best support the ARV.
Projected returns pro-forma
-3.0% appreciation · 6.98% rent growth · sell at horizon
- IRR
- 7.5%
- Equity multiple
- 1.31×
- Total profit
- $10,330
- Equity at exit
- $17,892
- IRR
- 20.0%
- Equity multiple
- 3.00×
- Total profit
- $67,194
- Equity at exit
- $10,375
Cash invested: $33,600 (down + closing). Projections, not guarantees.
Landlord ↔ Tenant lean methodology
- Overall (STATE)
- 90 Strongly Landlord-Friendly
- State Indiana
- 90 Strongly Landlord-Friendly · R+11
- County
- — inherits STATE
- City
- — inherits STATE
ZIP-level market 46808
- Rents YoY
- 7.0%
- Active inventory
- 88
- Price-to-rent
- 6.7×
Monthly cashflow live
- Estimated rent
- $1,502 high interval (Pro) →
- Mortgage (P&I)
- −$629
- Tax from tax record
- −$138 /mo · $1,662/yr
- Insurance
- −$50
- HOA
- −$0
- Vacancy / Maint / Mgmt
- −$315
- Net cashflow
- $369
Break-even live
Sensitivity live
| Price | -10% $437 | -5% $403 | +0% $369 | +5% $335 | +10% $301 |
|---|---|---|---|---|---|
| Rent | -10% $250 | -5% $310 | +0% $369 | +5% $428 | +10% $488 |
| Rate | -1.0pp $429 | -0.5pp $400 | base $369 | +0.5pp $338 | +1.0pp $306 |
UW: 25.0% down · 7.5% · 30yr · 1.5% tax · 5.0% vac · 8.0% maint · 8.0% mgmt
Financing live
Cash to close
- Down payment
- $30,000
- Closing costs
- $3,600
- Reserves months
- —
- Total cash needed
- —
Loan-product check · same deal, 3 products live
Conventional
25% down · 7.5% · 30yr
- Down + closing
- —
- Monthly P&I
- —
- Monthly cashflow
- —
- DSCR
- —
- Eligible?
- —
Personal DTI + credit; lowest rate.
DSCR
20% down · 8.5% · 30yr
- Down + closing
- —
- Monthly P&I
- —
- Monthly cashflow
- —
- DSCR
- —
- Eligible?
- —
No personal income docs; deal must DSCR.
Hard money
10% down · 12.0% · 12mo
- Down + closing
- —
- Monthly P&I
- —
- Monthly cashflow
- —
- DSCR
- —
- Eligible?
- —
Short-term bridge; refi at stabilization.
Rent comps 11 comps
| Address | Beds | Baths | Sqft | Rent | $/sqft | DOM | Units | Dist |
|---|---|---|---|---|---|---|---|---|
| 702 Archer Ave Fort Wayne, IN | 3.0 | 1.5 | 1273 | $1,499 | $1.18 | 46d | 1 | 0.59mi |
| 1915 Ellen Ave Fort Wayne, IN | 2.0 | 1.0 | 1100 | $950 | $0.86 | 15d | 1 | 0.61mi |
| 1502 3rd St Fort Wayne, IN | 3.0 | 1.5 | 1344 | $1,650 | $1.23 | 15d | 1 | 0.69mi |
| 1704 Sprunger Ave Fort Wayne, IN | 3.0 | 1.0 | 1141 | $1,400 | $1.23 | 45d | 1 | 0.73mi |
| 1721 3rd St Fort Wayne, IN | 3.0 | 1.0 | 1584 | $1,195 | $0.75 | 45d | 1 | 0.75mi |
| 739 W 4th St Fort Wayne, IN | 4.0 | 2.0 | 1750 | $1,995 | $1.14 | 15d | 1 | 0.80mi |
| 1626 Howell St Unit 201 Fort Wayne, IN | 3.0 | 2.0 | 1200 | $1,700 | $1.42 | 22d | 1 | 0.89mi |
| 3314 Foxcroft Dr Fort Wayne, IN | 3.0 | 2.0 | 1200 | $1,795 | $1.50 | 45d | 1 | 0.96mi |
| 2315 Terrace Rd Fort Wayne, IN | 3.0 | 1.0 | 1466 | $1,600 | $1.09 | 45d | 1 | 1.05mi |
| 2403 N Clinton St Fort Wayne, IN | 3.0 | 2.0 | 1666 | $1,750 | $1.05 | 45d | 1 | 1.12mi |
| 835 Van Buren St Fort Wayne, IN | 2.0 | 1.0–2.0 | 750 | $1,995 | $2.66 | 15d | 29 | 1.48mi |
Listing history 2 events
-
2026-06-07remarks 235-char remark
-
2026-06-07$120,000 Pending 1 DOM
ⓘ Source: listings_history table (triggers on properties + properties_extension) + one-shot
backfill from property_details.listing_events for pre-trigger history.
Tax reassessment forecast IN · Partial reset (capped growth)
- Current annual tax
- $1,662 · $138/mo
- Projected year-2 tax
- $1,662 · $138/mo
- Expected delta
- $0/yr ($0/mo · 0.0%)
ⓘ Screening estimate from a state-policy table — verify with the county assessor before closing.
Climate risk First Street
- Flood 1/10 Low FEMA zone X (unshaded) · 0% chance over 30 yrs
- Wildfire 1/10 Low
- Heat 3/10 Moderate 7 d/yr ≥100°F today · 17 d/yr by 30 yrs out
- Wind 2/10 Low
- Air quality 3/10 Moderate 2 unhealthy d/yr today · 3 by 30 yrs out
Nearby sold comps map
Loading sold comps map…
Walkable amenities ~0.75 mi
Loading nearby amenities…
Taxation est. · year 1
- Rental income
- $18,027
- − Mortgage interest
- −$6,722
- − Property taxes
- −$1,662
- − Insurance
- −$600
- − Repairs & maintenance
- −$1,442
- − Management
- −$1,442
- − Depreciation
- −$3,491
- Taxable income
- $2,668
- Est. tax owed @ 24.0%
- −$640
- After-tax cash flow
- $3,788/yr
For passive investors: Depreciation is non-cash, so a rental often shows a tax loss while cash-flowing — sheltering income. Rental losses are passive: they offset passive income freely, and up to $25,000/yr can offset ordinary (W-2) income if you actively participate and your MAGI is under $100k (phasing out to $0 by $150k); unused losses carry forward. On sale, claimed depreciation is recaptured at up to 25%, and gains may owe capital-gains tax (a 1031 exchange can defer both). Figures are a year-1 estimate at your 24.0% rate — not tax advice; consult a CPA.
Schools (NCES district)
- District
- Fort Wayne Community Schools
- NCES district ID
- 1803630
- Math proficiency
- 22% ▼ -11.00%
- Reading proficiency
- 29% ▼ -7.00%
- Median HH income
- $41,951
- Composite
- 21.68/100
- National rank
- #8275
- State rank
- #263 of 301 in IN
Livability — Fort Wayne
- Score
- 84/100
- State rank
- #6
- US rank
- #676
Category grades
Schools grade is shown separately in the Schools card above.
Census & demographics
- Census place
- Fort Wayne, IN
- County
- Allen County · 326,813 people
- City population
- 326,813
- Metro
- Fort Wayne, IN
- Population (ZIP)
- 19,684
- Household income
- $53,359
- Rent vs Own
- Severe rent burden
- 625.0
Population outlook (Allen County) Hauer SSP2
- Today (2025)
- 394,020 people
- By 2030
- 405,128 · +2.8%
- By 2040
- 423,476 · +7.5%
- By 2050
- 435,137 · +10.4%
- By 2075
- 450,293 · +14.3%
- By 2100
- 424,101 · +7.6%
Race, ethnicity, and origin ACS 2023
- Neighborhood character
- Predominantly White (71%)
- Race & ethnicity
- White 71% Hispanic / Latino 13% Two or more races 9% Black 9% Asian 2%
- Hispanic origin (detail)
- Mexican 10% Puerto Rican 2%
- Common ancestry
- Romanian 3% Lithuanian 2% Slovak 2%
- Foreign-born
- 7% · Canada, Philippines, South Korea
- Languages at home
- 86% English-only · Spanish 10% Korean 2% Other Asian/Pacific 1%
Political lean MEDSL · Allen
- 2024 margin
- R (+12.5) · D 42.9% · R 55.4% · Other 1.7%
- 2008→2024 swing
- -8.1pp toward R · 2008: -4.3pp · 2024: -12.5pp
- All cycles
- 2024: R+12.5 2020: R+11.2 2016: R+19.6 2012: R+16.8 2008: R+4.3
Not yet ingested
- Civics
- —
Market trends
- HPI YoY
- ▼ -288.51%
- Current HPI
- 239.6115
- Rent YoY
- ▲ 6.98%
- Metro
- Fort Wayne, IN
- State GDP YoY
- ▲ 2.90%
- F500 in state
- 18
Industry mix (Fortune 500 HQ in IN)
| Industry | F500 HQs | Revenue |
|---|---|---|
| Industrial Machinery | 2 | $37B |
|
||
| Healthcare | 1 | $177B |
|
||
| Pharmaceuticals | 1 | $45B |
|
||
| Metals / Steel | 1 | $18B |
|
||
| Agriculture | 1 | $17B |
|
||
| Packaging | 1 | $12B |
|
||
Price history
2 events — show timeline
- 2026-06-06 Pending — IRMLS
- 2026-06-05 Listed $120,000 IRMLS
Property tax history
+11.6%/yrLatest (2024): $1,662 · +36.1% YoY. Source: county tax records.
Cash-flow waterfall
monthlySold comps — $/sqft
last 12 mo · ≤1 miLoading sold comps…