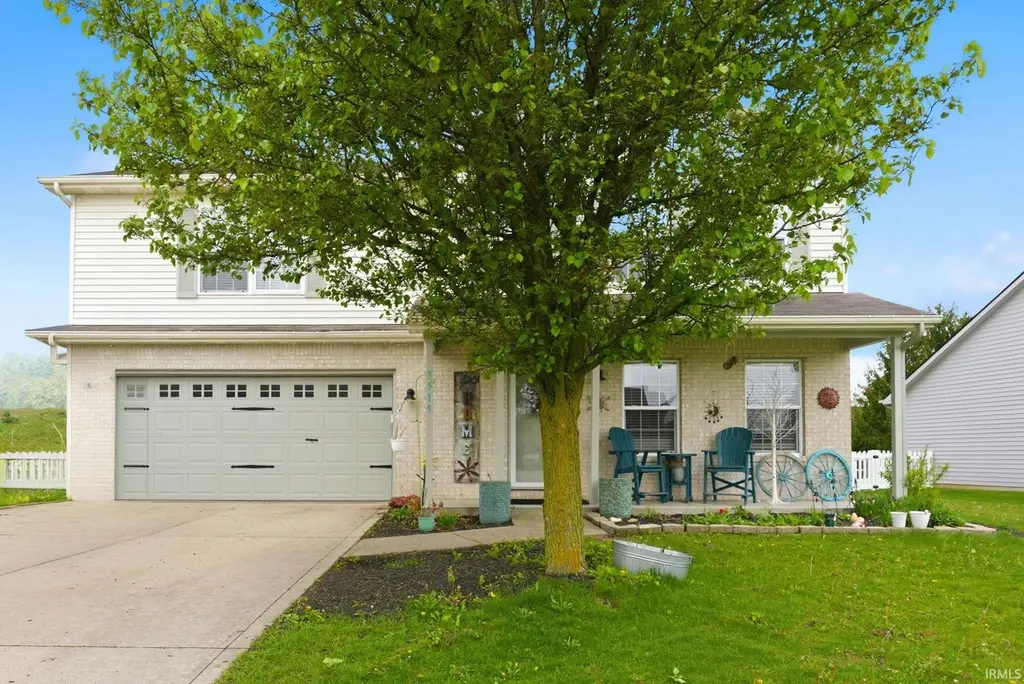
3515 Astoria Way · Huntertown, IN
Flood risk 1/10 · Minimal
- FEMA flood zone
- X (unshaded)
- Chance of flooding over 30 yrs
- 0.0%
- Est. flood insurance / yr
- $507 – $1,088
Fire risk 1/10 · Minimal
- Est. fire insurance / yr
- $717 – $1,331
Heat risk 3/10 · Minor
- Hot days now (above 99°F)
- 7 days/yr
- Hot days in 30 yrs
- 17 days/yr
Wind risk 2/10 · Minimal
- Chance of severe wind over 30 yrs
- —
Air-quality risk 2/10 · Minimal
- Unhealthy air days now
- 2 days/yr
- Unhealthy air days in 30 yrs
- 2 days/yr
Risk factors via First Street. Map © Google.
Why this score? — see what drove the D- grade
The composite is a weighted blend of 9 inputs, each scored 0–100. Each bar is that input's sub-score; the figure is the points it added to the 100-point composite (weight × sub-score).
- Cash flow +12.7/30.0
- ARV discount +5.3/15.0
- Schools +4.9/10.0
- Rent growth +4.4/5.0
- DSCR +3.8/10.0
- Livability +3.5/5.0
- 1% rule +2.8/10.0
- Condition / age +2.5/5.0
- Appreciation +0.0/10.0
$339,900
🖨 Deal sheet 📄 Offer letter ✓ Due diligence
Listing remarks
Beautiful 2,600sqft home featuring four large bedrooms and two full bathrooms on the second floor. Master bedroom has three closets and a private en-suite. Half-bath is located downstairs. This home is sitting on a quiet cul-de-sac in a golf-cart friendly community with the best neighbors a young family can ask for. The HOA fees have been paid for 2026 at $313.00/year which is one of the cheaper fees including a community pool within walking distance of the home. Nice quiet setting within minutes to a variety of shopping centers. Prime location for Carroll School District. HVAC system is six years old with top-of-the-line A/C and furnace. The system can be controlled through your smart phon
Key facts
- 9,225 sq ft lot
- 2 garage spots
- Pool
Property features AI
Finance
- HOA & community: Homeowners association; Community pool; Sidewalks; Annual association fee of $313 (about $26.08/month)
Exterior
- Parking: Attached garage with garage door opener; 2 garage spaces
- Utilities: Public water; Public sewer
- Home design: Single family residence (site-built); 2 stories
- Construction: Vinyl siding; Slab foundation; Built as site-built home
- Exterior features: Private pool (association); Cul-de-sac lot; Level lot
Interior
- Kitchen: Dishwasher; Microwave; Refrigerator; Convection oven
- Bedrooms: Total of 8 rooms (bedroom count not separately specified)
- Bathrooms: 2 full bathrooms; 1 half bathroom; 1 main-level bathroom
- Heating & cooling: Central air; Zoned cooling; Natural gas heating; Zoned heating; Forced air; Floor furnace
- Interior features: Walk-in closets; Pantry; Breakfast bar; Kitchen island; Open floorplan; Stone counters
- Laundry & utility: Gas dryer hookup; Main-level laundry
Neighborhood map
What this means for you Summary
Snapshot
- This is a 4-bed/2.5-bath single-family listed at $340k.
Deal economics
- At list price, monthly cash flow is $-40 ($-477/yr) — negative.
- To cash-flow at today's rent, offer at most $333k (2.1% below list).
- To meet the 1% rule (rent ≥ 1% of price), the offer needs to be $265k (22.1% below list).
- Recommended offer: $265k (22.1% below list) — sets the bar for 1% rule.
- Cap rate 6.2% vs local median 4.1% in Huntertown — top-decile yield for the area; either an underpriced asset or a hidden risk that comps aren't pricing in. Stress-test before assuming the spread holds.
Location & tenants
- Location reads 70/100 on livability (#159 in IN) — a middle-class / working-renter tenant base. Strengths: employment A+, cost of living A+, housing A+; Watch: amenities F, commute F, health & safety F.
- Northwest Allen County Schools (rural): math 51% / reading 58% proficiency, ranked #25 of 301 in IN (top 8%) — acceptable for families but not a draw, mixed tenant base, ~2y average lease; only 11% free/reduced lunch — higher-income household profile.
- Zoned schools: Eel River Elementary School (math 56% / reading 41%, grade D, #304 of 994 statewide, top 31%, 412 students, 29% FRL); Carroll Middle School (math 39% / reading 55%, grade D+, #65 of 330 statewide, top 21%, 994 students, 29% FRL); Carroll High School (math 59% / reading 86%, grade B+, #10 of 369 statewide, top 3%, 2,554 students, 21% FRL) — zoned schools average 26% FRL vs 11% district-wide (15 pts higher); higher-poverty schools than district average — tighter screening recommended.
- Market conditions: Rents rising fast (+7.6%/yr); 327 active listings in the ZIP; 2 comparable units currently listed for rent nearby; solid renter incomes; 1,861 units permitted in Allen County in 2024 (576 in 5+ unit buildings).
- This rent runs 39% of the median local income ($81k/yr) — at the standard rent-burdened threshold; future hikes will face affordability resistance.
Forward outlook
- Local home prices are declining (-3.0%/yr); year-one equity from $2k of loan paydown is wiped out by about $10k of value loss. Plan a longer hold.
- Allen County population projected at +10% by 2050 — modest demand growth; plan on rents tracking national, not racing it.
Negotiation context
- It's been on market 28 days — a 2% lower offer ($335k) is reasonable based on typical stale-listing flexibility.
- 6 sale attempts since 12y ago with the ask held roughly flat each time — persistent listings suggest the price (not the market) is what's stuck; bring a comps-based counter.
Questions for the listing agent
- What do current leases actually rent for vs. the listed asking? Can we see a recent rent roll and the last 12 months of T-12 income?
- What does the HOA fee cover, when was the last increase, and are there any pending special assessments or reserve-fund shortfalls?
- Is there a deadline driving the sale (1031 exchange, divorce, estate, relocation)? That informs how much negotiation room exists.
- The area grade is low — what's the realistic commute time and amenity access for the typical tenant pool here? Any planned neighborhood developments (good or bad) we should know about?
- What's the average days-on-market for RENTAL listings here right now (not sales)? A rising rental-DOM trend means longer vacancies and softer asking-rent achievability than the comps imply.
- What's the recent tenant-quality profile in this submarket — average credit score on applications, eviction rate, late-payment / NSF rate, and stable-employment percentage? A property-management company in the area should have these aggregated.
- How much new for-sale + rental construction is in the pipeline within 1–3 miles? Heavy new supply typically softens prices + rents 12–24 months out; constrained supply supports both.
Investment metrics
- 1% rule
- 0.78% ✗
- Cap rate
- 6.15%
- Cash-on-cash
- -0.50%
- DSCR
- 0.98
- GRM
- 10.7
CMA / ARV
- ARV (median comp)
- $323,981
- List price
- $339,900
- Delta
- 4.91%
- Verdict
- FAIR
- Comps
- 20 within 1.0 mi
Show comp detail 12 sales within ~0.75 mi
| Address | Dist | Beds/Ba | Sqft | Sold | Price | $/sf | Match |
|---|---|---|---|---|---|---|---|
| 3515 Astoria Way | 0.00mi | 4/2.5 | 2,607 (+1%) | 0mo | $335,000 | $129 | 98 |
| 12967 Solo Ln | 0.43mi | 5/3.0 (+1) | 2,600 (+1%) | 3mo | $371,805 | $143 | 70 |
| 4313 Great Hollow Ct | 0.49mi | 4/2.5 | 2,438 (-6%) | 2mo | $475,000 | $195 | 66 |
| 12926 Rey Cv | 0.52mi | 5/3.0 (+1) | 2,600 (+1%) | 4mo | $381,000 | $147 | 65 |
| 4533 Hammock Dr | 0.62mi | 4/2.5 | 2,478 (-4%) | 5mo | $370,000 | $149 | 60 |
| 12839 Watts Dr | 0.66mi | 5/3.0 (+1) | 2,600 (+1%) | 2mo | $387,130 | $149 | 59 |
| 2981 Skywalker Pass | 0.55mi | 4/2.5 | 2,346 (-9%) | 3mo | $359,900 | $153 | 57 |
| 12804 Watts Dr | 0.68mi | 5/3.0 (+1) | 2,600 (+1%) | 5mo | $348,530 | $134 | 56 |
| 12792 Watts Dr | 0.69mi | 5/3.0 (+1) | 2,600 (+1%) | 5mo | $359,780 | $138 | 56 |
| 12843 Watts Dr | 0.64mi | 4/2.5 | 2,346 (-9%) | 3mo | $350,650 | $149 | 52 |
| 12768 Watts Dr | 0.71mi | 4/2.5 | 2,346 (-9%) | 4mo | $334,900 | $143 | 48 |
| 3036 Water Wheel Run | 0.71mi | 3/3.0 (-1) | 2,879 (+11%) | 0mo | $324,900 | $113 | 40 |
Match score weights: distance 35% · size 25% · config 20% · recency 20%. Top-matched comps best support the ARV.
Projected returns pro-forma
-3.0% appreciation · 7.64% rent growth · sell at horizon
- IRR
- -12.5%
- Equity multiple
- 0.53×
- Total profit
- $-44,756
- Equity at exit
- $50,680
- IRR
- 2.0%
- Equity multiple
- 1.17×
- Total profit
- $15,868
- Equity at exit
- $29,388
Cash invested: $95,172 (down + closing). Projections, not guarantees.
Landlord ↔ Tenant lean methodology
- Overall (STATE)
- 90 Strongly Landlord-Friendly
- State Indiana
- 90 Strongly Landlord-Friendly · R+11
- County
- — inherits STATE
- City
- — inherits STATE
ZIP-level market 46818
- Rents YoY
- 7.6%
- Active inventory
- 327
- Price-to-rent
- 10.7×
Monthly cashflow live
- Estimated rent
- $2,649 medium interval (Pro) →
- Mortgage (P&I)
- −$1,782
- Tax from tax record
- −$183 /mo · $2,190/yr
- Insurance
- −$142
- HOA
- −$26
- Vacancy / Maint / Mgmt
- −$556
- Net cashflow
- $-40
Break-even live
UW: 25.0% down · 7.5% · 30yr · 1.5% tax · 5.0% vac · 8.0% maint · 8.0% mgmt
Financing live
Cash to close
- Down payment
- $84,975
- Closing costs
- $10,197
- Reserves months
- —
- Total cash needed
- —
Loan-product check · same deal, 3 products live
Conventional
25% down · 7.5% · 30yr
- Down + closing
- —
- Monthly P&I
- —
- Monthly cashflow
- —
- DSCR
- —
- Eligible?
- —
Personal DTI + credit; lowest rate.
DSCR
20% down · 8.5% · 30yr
- Down + closing
- —
- Monthly P&I
- —
- Monthly cashflow
- —
- DSCR
- —
- Eligible?
- —
No personal income docs; deal must DSCR.
Hard money
10% down · 12.0% · 12mo
- Down + closing
- —
- Monthly P&I
- —
- Monthly cashflow
- —
- DSCR
- —
- Eligible?
- —
Short-term bridge; refi at stabilization.
Rent comps 2 comps
| Address | Beds | Baths | Sqft | Rent | $/sqft | DOM | Units | Dist |
|---|---|---|---|---|---|---|---|---|
| 3205 Water Wheel Run Fort Wayne, IN | 4.0 | 2.5 | 2382 | $2,500 | $1.05 | 43d | 1 | 0.71mi |
| 5045 Portney Pl Fort Wayne, IN | 4.0 | 2.5 | 2226 | $2,300 | $1.03 | 43d | 1 | 0.95mi |
HOA detail
- Monthly dues
- $26 · $312/yr
- Likely covers
- pool
Listing history 12 events
-
2026-05-16price $339,900 1442-char remark
-
2026-04-26$349,900 Active 1442-char remark
-
2026-04-23historical $349,900 1442-char remark
-
2020-06-30soldstatus $241,000
-
2020-06-30$249,800
-
2020-06-19soldstatus $241,000
-
2020-04-30$249,800
-
2017-07-03soldstatus $179,900
-
2017-05-19$179,900
-
2015-10-17soldstatus $169,900
-
2015-08-26$169,900
-
2014-05-02$173,000
ⓘ Source: listings_history table (triggers on properties + properties_extension) + one-shot
backfill from property_details.listing_events for pre-trigger history.
Tax reassessment forecast IN · Partial reset (capped growth)
- Current annual tax
- $2,190 · $183/mo
- Projected year-2 tax
- $2,540 · $212/mo
- Expected delta
- +$350/yr (+$29/mo · 16.0%)
ⓘ Screening estimate from a state-policy table — verify with the county assessor before closing.
Climate risk First Street
- Flood 1/10 Low FEMA zone X (unshaded) · 0% chance over 30 yrs
- Wildfire 1/10 Low
- Heat 3/10 Moderate 7 d/yr ≥99°F today · 17 d/yr by 30 yrs out
- Wind 2/10 Low
- Air quality 2/10 Low 2 unhealthy d/yr today · 2 by 30 yrs out
Nearby sold comps map
Loading sold comps map…
Walkable amenities ~0.75 mi
Loading nearby amenities…
Taxation est. · year 1
- Rental income
- $31,790
- − Mortgage interest
- −$19,040
- − Property taxes
- −$2,190
- − Insurance
- −$1,700
- − Repairs & maintenance
- −$2,543
- − Management
- −$2,543
- − HOA
- −$312
- − Depreciation
- −$9,888
- Taxable loss
- −$6,425
- Est. tax savings @ 24.0%
- +$1,542
- After-tax cash flow
- $1,065/yr
For passive investors: Depreciation is non-cash, so a rental often shows a tax loss while cash-flowing — sheltering income. Rental losses are passive: they offset passive income freely, and up to $25,000/yr can offset ordinary (W-2) income if you actively participate and your MAGI is under $100k (phasing out to $0 by $150k); unused losses carry forward. On sale, claimed depreciation is recaptured at up to 25%, and gains may owe capital-gains tax (a 1031 exchange can defer both). Figures are a year-1 estimate at your 24.0% rate — not tax advice; consult a CPA.
Schools (NCES district)
- District
- Northwest Allen County Schools
- NCES district ID
- 1808250
- Math proficiency
- 51% ▼ -6.00%
- Reading proficiency
- 58% ▼ -5.00%
- Median HH income
- $78,952
- Composite
- 49.26/100
- National rank
- #2027
- State rank
- #25 of 301 in IN
Livability — Huntertown
- Score
- 70/100
- State rank
- #159
- US rank
- #7771
Category grades
Schools grade is shown separately in the Schools card above.
Census & demographics
- Census place
- Huntertown, IN
- County
- Allen County · 326,813 people
- Metro
- Fort Wayne, IN
- Population (ZIP)
- 21,954
- Household income
- $81,066
- Rent vs Own
- Severe rent burden
- 101.0
Population outlook (Allen County) Hauer SSP2
- Today (2025)
- 394,020 people
- By 2030
- 405,128 · +2.8%
- By 2040
- 423,476 · +7.5%
- By 2050
- 435,137 · +10.4%
- By 2075
- 450,293 · +14.3%
- By 2100
- 424,101 · +7.6%
Race, ethnicity, and origin ACS 2023
- Neighborhood character
- Predominantly White (79%)
- Race & ethnicity
- White 79% Two or more races 8% Hispanic / Latino 7% Black 4% Asian 3%
- Hispanic origin (detail)
- Mexican 6%
- Common ancestry
- Italian 4% Slovak 3% Romanian 2%
- Foreign-born
- 8% · Canada, Vietnam, Philippines
- Languages at home
- 90% English-only · Spanish 4% Other Asian/Pacific 1% Vietnamese 1%
Political lean MEDSL · Allen
- 2024 margin
- R (+12.5) · D 42.9% · R 55.4% · Other 1.7%
- 2008→2024 swing
- -8.1pp toward R · 2008: -4.3pp · 2024: -12.5pp
- All cycles
- 2024: R+12.5 2020: R+11.2 2016: R+19.6 2012: R+16.8 2008: R+4.3
Not yet ingested
- Civics
- —
Market trends
- HPI YoY
- ▼ -217.71%
- Current HPI
- 228.1539
- Rent YoY
- ▲ 7.64%
- Metro
- Fort Wayne, IN
- State GDP YoY
- ▲ 2.90%
- F500 in state
- 18
Industry mix (Fortune 500 HQ in IN)
| Industry | F500 HQs | Revenue |
|---|---|---|
| Industrial Machinery | 2 | $37B |
|
||
| Healthcare | 1 | $177B |
|
||
| Pharmaceuticals | 1 | $45B |
|
||
| Metals / Steel | 1 | $18B |
|
||
| Agriculture | 1 | $17B |
|
||
| Packaging | 1 | $12B |
|
||
Price history
+93.6% since first listed14 events — show timeline
- 2026-06-15 Sold (MLS) $335,000 IRMLS
- 2026-05-25 Pending — IRMLS
- 2026-05-16 Price Changed $339,900 IRMLS
- 2026-04-26 Listed $349,900 IRMLS
- 2026-04-23 Coming Soon $349,900 IRMLS
- 2020-06-30 Listed $249,800 MIBOR as Distributed by MLS Grid
- 2020-06-30 Sold (MLS) $241,000 MIBOR as Distributed by MLS Grid
- 2020-06-19 Sold (MLS) $241,000 IRMLS
- 2020-04-30 Listed $249,800 IRMLS
- 2017-07-03 Sold (MLS) $179,900 IRMLS
- 2017-05-19 Listed $179,900 IRMLS
- 2015-10-17 Sold (MLS) $169,900 IRMLS
- 2015-08-26 Listed $169,900 IRMLS
- 2014-05-02 Listed $173,000 IRMLS
Property tax history
+1.9%/yrLatest (2024): $2,190 · +2.5% YoY. Source: county tax records.
Cash-flow waterfall
monthlySold comps — $/sqft
last 12 mo · ≤1 miLoading sold comps…