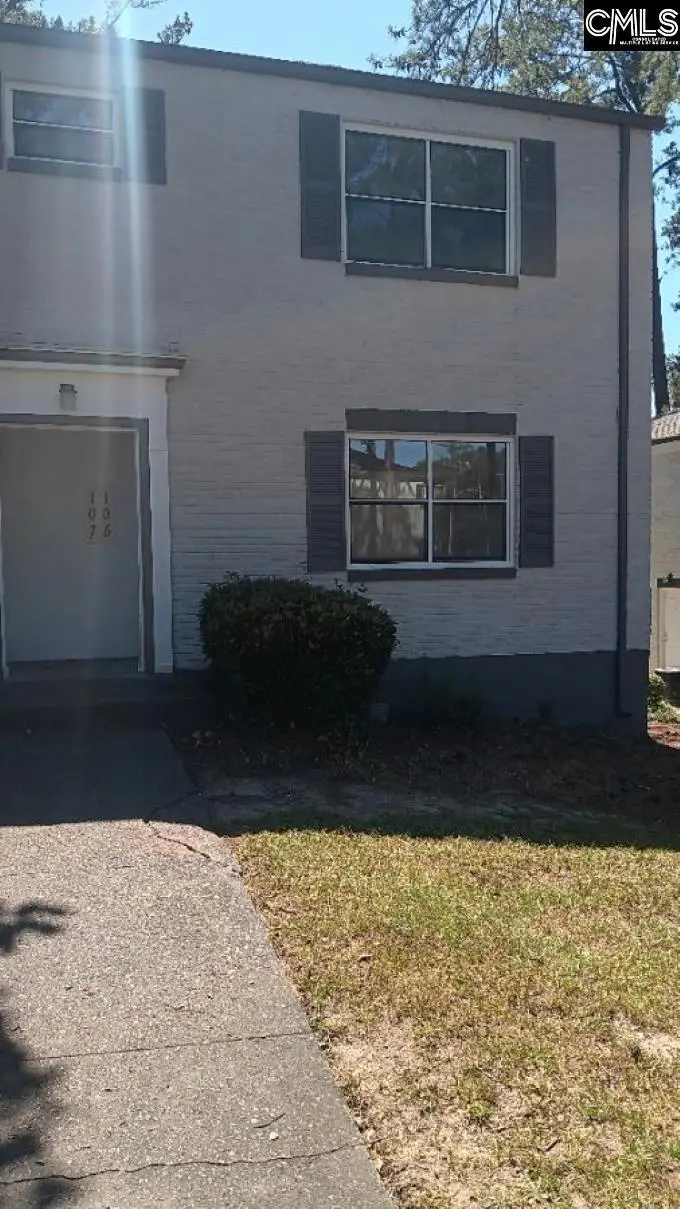
4600 Fort Jackson Blvd #106 · Columbia, SC
Flood risk No data
- FEMA flood zone
- —
- Chance of flooding over 30 yrs
- —
- Est. flood insurance / yr
- —
Fire risk No data
- Est. fire insurance / yr
- —
Heat risk No data
- Hot days now (above threshold)
- —
- Hot days in 30 yrs
- —
Wind risk No data
- Chance of severe wind over 30 yrs
- —
Air-quality risk No data
- Unhealthy air days now
- —
- Unhealthy air days in 30 yrs
- —
Risk factors via First Street. Map © Google.
Why this score? — see what drove the C+ grade
The composite is a weighted blend of 9 inputs, each scored 0–100. Each bar is that input's sub-score; the figure is the points it added to the 100-point composite (weight × sub-score).
- Cash flow +26.4/30.0
- DSCR +9.0/10.0
- 1% rule +8.1/10.0
- ARV discount +7.5/15.0
- Livability +3.9/5.0
- Rent growth +3.0/5.0
- Schools +2.6/10.0
- Condition / age +2.5/5.0
- Appreciation +0.0/10.0
$89,000
🖨 Deal sheet (PDF) 📄 Offer letter ✓ Due diligence
Listing remarks
Great investment opportunity at 4600 Fort Jackson Blvd! Tenant-occupied condo offering immediate rental income and conveniently located near Fort Jackson, downtown Columbia, USC, shopping, dining, and major roadways. Ideal for investors looking to add to their rental portfolio or expand into the Columbia rental market. HOA maintains exterior and common areas for easier ownership. Seller is also offering Units 105, 106, and 112 as a portfolio package. Units may be purchased individually or together. Please do not disturb tenant. Showings by appointment only. Disclaimer: CMLS has not reviewed and, therefore, does not endorse vendors who may appear in listings.
Key facts
- $23 HOA
- 4 parking spots
- Built 1949
Tags
Property features AI
Finance
- Other: Directions: Take I-77 to Fort Jackson Blvd; see Hampton Hills Condos on your left
- HOA & community: Property is part of an association
Exterior
- Parking: Space for 4 vehicles
- Utilities: Public sewer
- Home design: Condo unit (address includes unit #106)
- Construction: Slab foundation
- Exterior features: Brick exterior above foundation; Paved road access; Public water
Interior
- Bedrooms: Master bedroom on the second floor
- Bathrooms: One full bathroom
- Heating & cooling: Central heating; Central air conditioning
- Interior features: Total heated area approximately 1,200
Neighborhood map
What this means for you Summary
Snapshot
- This is a 2-bed/1.0-bath condo listed at $89k.
Deal economics
- At list price, monthly cash flow is $233 ($3k/yr) — positive.
- The deal already cash-flows at list — no discount required.
- Meets the 1% rule at list price ($1k rent vs $89k).
- Recommended offer: $86k (3.0% below list) — sets the bar for market timing.
- Cap rate 9.4% vs local median 5.0% in Columbia — top-decile yield for the area; either an underpriced asset or a hidden risk that comps aren't pricing in. Stress-test before assuming the spread holds.
Location & tenants
- Location reads 78/100 on livability (#18 in SC, #2,436 nationally) — a middle-class / working-renter tenant base. Strengths: amenities A+, commute A+, cost of living A+; Watch: employment D, crime F.
- Richland 01 (urban): math 26% / reading 36% proficiency, ranked #54 of 80 in SC (top 68%) — families likely to look elsewhere, expect single-tenant / working-renter base with shorter leases; 64% free/reduced lunch — lower-income household profile, screen leases tightly.
- Zoned schools: Brennen Elementary (math 61% / reading 63%, grade B, #73 of 597 statewide, top 12%, 806 students, 100% FRL); A. C. Flora High (math 42% / reading 92%, grade B, #73 of 196 statewide, top 41%, 1,352 students, 100% FRL) — zoned schools average 100% FRL vs 64% district-wide (36 pts higher); higher-poverty schools than district average — tighter screening recommended.
- Zoned-school proficiency averages 64% at this address vs 31% district-wide (+34 pts) — the actual schools serving this property are materially stronger than the Richland 01 average implies; a family-tenant draw the district grade alone would hide.
- Market conditions: Rents rising (+2.1%/yr); 299 active listings in the ZIP; 21 comparable units currently listed for rent nearby; rentals at typical pace (median 25d on market — plan ~3-4 weeks tenant-placement turnaround); 3,472 units permitted in Richland County in 2024 (1,096 in 5+ unit buildings).
Forward outlook
- Local home prices are declining (-3.0%/yr); year-one equity from $615 of loan paydown is wiped out by about $3k of value loss. Plan a longer hold.
- Richland County population projected at +30% by 2050 — long-run rental-demand tailwind backs the buy-and-hold thesis.
Negotiation context
- It's been on market 36 days — a 3% lower offer ($86k) is reasonable based on typical stale-listing flexibility.
- 2 sale attempts with the ask held roughly flat each time — persistent listings suggest the price (not the market) is what's stuck; bring a comps-based counter.
- Current owner paid $70k; 27% above their basis — modest negotiation headroom, anchor on the comps not their cost.
Risks & watch-outs
- Watch-outs: built in 1949 — expect roof / HVAC / electrical / plumbing capex.
Questions for the listing agent
- It's been on market 36 days. Have you received any prior offers? Is the seller open to a 3% concession, seller financing, or rate buy-down credit?
- Built in 1949 — when were the roof, HVAC, electrical panel, plumbing, and water heater last replaced?
- What does the HOA fee cover, when was the last increase, and are there any pending special assessments or reserve-fund shortfalls?
- Any open or pending special assessments — roof, HVAC, plumbing, elevator, façade? What's the per-unit balance and payoff schedule, and is the seller paying it off at close or rolling it to the buyer?
- Is there a deadline driving the sale (1031 exchange, divorce, estate, relocation)? That informs how much negotiation room exists.
- Schools are D-rated, which usually means shorter tenancies and higher turnover. Who's the typical renter profile here, and what's been the actual vacancy rate?
- Crime grade is F in this area — have there been break-ins, vandalism, or insurance claims at this property in the last 3 years? What carrier currently insures it and at what premium?
- What's the average days-on-market for RENTAL listings here right now (not sales)? A rising rental-DOM trend means longer vacancies and softer asking-rent achievability than the comps imply.
- What's the recent tenant-quality profile in this submarket — average credit score on applications, eviction rate, late-payment / NSF rate, and stable-employment percentage? A property-management company in the area should have these aggregated.
- How much new apartment / multifamily construction is in the pipeline within 1–3 miles? Heavy new supply (>2% of stock underway) typically softens rents 12–24 months out; light construction supports rent growth.
Investment metrics
- 1% rule
- 1.31% ✓
- Cap rate
- 9.43%
- Cash-on-cash
- 11.21%
- DSCR
- 1.50
- GRM
- 6.4
CMA / ARV
No comps found within radius.
Projected returns pro-forma
-3.0% appreciation · 2.08% rent growth · sell at horizon
- IRR
- -0.6%
- Equity multiple
- 0.98×
- Total profit
- $-607
- Equity at exit
- $13,270
- IRR
- 8.0%
- Equity multiple
- 1.58×
- Total profit
- $14,502
- Equity at exit
- $7,695
Cash invested: $24,920 (down + closing). Projections, not guarantees.
Landlord ↔ Tenant lean methodology
- Overall (STATE)
- 90 Strongly Landlord-Friendly
- State South Carolina
- 90 Strongly Landlord-Friendly · R+6
- County
- — inherits STATE
- City
- — inherits STATE
ZIP-level market 29209
- Rents YoY
- 2.1%
- Active inventory
- 299
- Price-to-rent
- 6.4×
Monthly cashflow live
- Estimated rent
- $1,168 high interval (Pro) →
- Mortgage (P&I)
- −$467
- Tax from tax record
- −$163 /mo · $1,955/yr
- Insurance
- −$37
- HOA
- −$23
- Vacancy / Maint / Mgmt
- −$245
- Net cashflow
- $233
Break-even live
Sensitivity live
| Price | -10% $283 | -5% $258 | +0% $233 | +5% $208 | +10% $182 |
|---|---|---|---|---|---|
| Rent | -10% $140 | -5% $187 | +0% $233 | +5% $279 | +10% $325 |
| Rate | -1.0pp $278 | -0.5pp $255 | base $233 | +0.5pp $210 | +1.0pp $186 |
UW: 25.0% down · 7.5% · 30yr · 1.5% tax · 5.0% vac · 8.0% maint · 8.0% mgmt
Financing live
Cash to close
- Down payment
- $22,250
- Closing costs
- $2,670
- Reserves months
- —
- Total cash needed
- —
Loan-product check · same deal, 3 products live
Conventional
25% down · 7.5% · 30yr
- Down + closing
- —
- Monthly P&I
- —
- Monthly cashflow
- —
- DSCR
- —
- Eligible?
- —
Personal DTI + credit; lowest rate.
DSCR
20% down · 8.5% · 30yr
- Down + closing
- —
- Monthly P&I
- —
- Monthly cashflow
- —
- DSCR
- —
- Eligible?
- —
No personal income docs; deal must DSCR.
Hard money
10% down · 12.0% · 12mo
- Down + closing
- —
- Monthly P&I
- —
- Monthly cashflow
- —
- DSCR
- —
- Eligible?
- —
Short-term bridge; refi at stabilization.
Rent comps 21 comps
| Address | Beds | Baths | Sqft | Rent | $/sqft | DOM | Units | Dist |
|---|---|---|---|---|---|---|---|---|
| 4600 Fort Jackson Blvd Columbia, SC | 2.0 | 1.0 | 940 | $995 | $1.06 | 12d | 1 | 0.00mi |
| 225 Myron Cir Unit 225 Columbia, SC | 2.0 | 1.0 | 850 | $905 | $1.06 | 15d | 1 | 0.03mi |
| 4600 Fort Jackson Blvd Columbia, SC | 2.0 | 1.0 | 940 | $965 | $1.03 | 15d | 2 | 0.17mi |
| 4600 Fort Jackson Blvd Columbia, SC | 2.0 | 1.0 | 895 | $955 | $1.07 | 24d | 3 | 0.17mi |
| 914 Woodlawn Ave Columbia, SC | 3.0 | 2.0 | 1300 | $1,800 | $1.38 | 24d | 1 | 0.58mi |
| 715 Montague Rd Columbia, SC | 2.0 | 1.0 | 1000 | $1,180 | $1.18 | 24d | 1 | 0.59mi |
| 6530 Davidson Rd Columbia, SC | 2.0–3.0 | 2.0 | 1208 | $1,425 | $1.18 | 24d | 4 | 0.65mi |
| 915 Brandon Ave Columbia, SC | 2.0 | 1.0 | 1200 | $1,500 | $1.25 | 24d | 1 | 0.66mi |
| 712 Brandon Ave Unit 712 Brand Columbia, SC | 1.0 | 1.0 | 800 | $1,095 | $1.37 | 24d | 1 | 0.79mi |
| 822 Cedar Ter Unit 824 Columbia, SC | 1.0 | 1.0 | 775 | $895 | $1.15 | 15d | 1 | 0.79mi |
| 807 Cedar Ter Columbia, SC | 2.0 | 1.0 | 937 | $1,200 | $1.28 | 15d | 1 | 0.79mi |
| 500 Gills Creek Pkwy Columbia, SC | 1.0–2.0 | 1.0–2.0 | 807 | $1,375 | $1.70 | 12d | 27 | 0.97mi |
| 501 Pelham Dr Columbia, SC | 1.0–2.0 | 1.0–2.0 | 805 | $1,625 | $2.02 | 3d | 24 | 1.07mi |
| 4319 Wilmot Ave Columbia, SC | 3.0 | 1.0 | 1000 | $1,650 | $1.65 | 24d | 1 | 1.08mi |
| 317 Beltline Blvd Unit 1 Columbia, SC | 3.0 | 1.0 | 1150 | $1,200 | $1.04 | 24d | 1 | 1.12mi |
| 320 S Beltline Blvd Columbia, SC | 2.0 | 1.0 | 800 | $1,048 | $1.31 | 24d | 5 | 1.13mi |
| 4103 Devine St Columbia, SC | 1.0 | 1.0 | 785 | $1,072 | $1.37 | 24d | 1 | 1.16mi |
| 524 S Beltline Blvd Columbia, SC | 2.0 | 1.0 | 1050 | $1,300 | $1.24 | 24d | 1 | 1.27mi |
| 3800 Wilmot Ave Columbia, SC | 2.0 | 1.0 | 720 | $1,500 | $2.08 | 24d | 1 | 1.41mi |
| 721 Deerwood St Columbia, SC | 2.0 | 1.0 | 1000 | $1,150 | $1.15 | 15d | 1 | 1.44mi |
| 403 Wormwood Ln Unit H Columbia, SC | 2.0 | 2.0 | 1080 | $1,345 | $1.25 | 24d | 1 | 1.47mi |
HOA detail condo
- Monthly dues
- $23 · $276/yr
- Assessments
- None detected in remarks — confirm with the listing agent.
Listing history 21 events
-
2026-06-21days on market $89,000 Active 36 DOM
-
2026-06-18days on market $89,000 Active 33 DOM
-
2026-06-17days on market $89,000 Active 32 DOM
-
2026-06-16days on market $89,000 Active 31 DOM
-
2026-06-15days on market $89,000 Active 30 DOM
-
2026-06-14days on market $89,000 Active 28 DOM
-
2026-06-10days on market $89,000 Active 25 DOM
-
2026-06-09days on market $89,000 Active 24 DOM
-
2026-06-08days on market $89,000 Active 23 DOM
-
2026-06-07days on market $89,000 Active 22 DOM
-
2026-06-03days on market $89,000 Active 18 DOM
-
2026-06-03days on market $89,000 Active 17 DOM
-
2026-06-01days on market $89,000 Active 16 DOM
-
2026-05-31days on market $89,000 Active 15 DOM
-
2026-05-16$89,000 Active
-
2026-01-06price $85,000
-
2025-11-28price $89,000
-
2025-11-12$94,000 Active
-
2023-09-25soldstatus $70,000
-
2002-11-25soldstatus $78,000
-
1987-12-01soldstatus $36,750
ⓘ Source: listings_history table (triggers on properties + properties_extension) + one-shot
backfill from property_details.listing_events for pre-trigger history.
Tax reassessment forecast SC · Resets to sale price
- Current annual tax
- $1,955 · $163/mo
- Projected year-2 tax
- $1,955 · $163/mo
- Expected delta
- $0/yr ($0/mo · 0.0%)
ⓘ Screening estimate from a state-policy table — verify with the county assessor before closing.
Nearby sold comps map
Loading sold comps map…
Walkable amenities ~0.75 mi
Loading nearby amenities…
Taxation est. · year 1
- Rental income
- $14,012
- − Mortgage interest
- −$4,985
- − Property taxes
- −$1,955
- − Insurance
- −$445
- − Repairs & maintenance
- −$1,121
- − Management
- −$1,121
- − HOA
- −$276
- − Depreciation
- −$2,589
- Taxable income
- $1,520
- Est. tax owed @ 24.0%
- −$365
- After-tax cash flow
- $2,428/yr
For passive investors: Depreciation is non-cash, so a rental often shows a tax loss while cash-flowing — sheltering income. Rental losses are passive: they offset passive income freely, and up to $25,000/yr can offset ordinary (W-2) income if you actively participate and your MAGI is under $100k (phasing out to $0 by $150k); unused losses carry forward. On sale, claimed depreciation is recaptured at up to 25%, and gains may owe capital-gains tax (a 1031 exchange can defer both). Figures are a year-1 estimate at your 24.0% rate — not tax advice; consult a CPA.
Schools (NCES district)
- District
- Richland 01
- NCES district ID
- 4503360
- Math proficiency
- 26% ▼ -7.00%
- Reading proficiency
- 36% ▼ -5.00%
- Median HH income
- $38,931
- Composite
- 25.94/100
- National rank
- #7335
- State rank
- #54 of 80 in SC
Livability — Columbia
- Score
- 78/100
- State rank
- #18
- US rank
- #2436
Category grades
Schools grade is shown separately in the Schools card above.
Census & demographics
- Census place
- Columbia, SC
- County
- Richland County · 389,530 people
- City population
- 335,994
- Metro
- Columbia, SC
- Population (ZIP)
- 38,041
- Household income
- $58,772
- Rent vs Own
- Severe rent burden
- 1716.0
Population outlook (Richland County) Hauer SSP2
- Today (2025)
- 459,667 people
- By 2030
- 487,524 · +6.1%
- By 2040
- 542,035 · +17.9%
- By 2050
- 595,371 · +29.5%
- By 2075
- 732,998 · +59.5%
- By 2100
- 820,415 · +78.5%
Race, ethnicity, and origin ACS 2023
- Neighborhood character
- Diverse neighborhood (Simpson 0.62)
- Race & ethnicity
- Black 48% White 39% Two or more races 6% Hispanic / Latino 6% Asian 2%
- Hispanic origin (detail)
- Mexican 3% Puerto Rican 2%
- Common ancestry
- Slovak 2% Serbian 2% Italian 1%
- Foreign-born
- 6% · Canada, Jamaica
- Languages at home
- 93% English-only · Spanish 3% Arabic 1% Other Indo-European 1%
Political lean MEDSL · Richland
- 2024 margin
- Solid D (+34.6) · D 66.4% · R 31.8% · Other 1.8%
- 2008→2024 swing
- +5.7pp toward D · 2008: 28.9pp · 2024: 34.6pp
- All cycles
- 2024: D+34.6 2020: D+38.3 2016: D+32.9 2012: D+33.3 2008: D+28.9
Not yet ingested
- Civics
- —
Market trends
- HPI YoY
- ▼ -142.10%
- Current HPI
- 205.5679
- Rent YoY
- ▲ 2.08%
- Metro
- Columbia, SC
- State GDP YoY
- ▲ 4.51%
- F500 in state
- 2
Industry mix (Fortune 500 HQ in SC)
| Industry | F500 HQs | Revenue |
|---|---|---|
| Packaging | 1 | $7B |
|
||
Price history
+142.2% since first listed7 events — show timeline
- 2026-05-16 Listed $89,000 Consolidated MLS
- 2026-01-06 Price Changed $85,000 Consolidated MLS
- 2025-11-28 Price Changed $89,000 Consolidated MLS
- 2025-11-12 Listed $94,000 Consolidated MLS
- 2023-09-25 Sold (Public Records) $70,000 Public Records
- 2002-11-25 Sold (Public Records) $78,000 Public Records
- 1987-12-01 Sold (Public Records) $36,750 Public Records
Property tax history
+5.8%/yrLatest (2025): $1,955 · +2.1% YoY. Source: county tax records.
Cash-flow waterfall
monthlySold comps — $/sqft
last 12 mo · ≤1 miLoading sold comps…