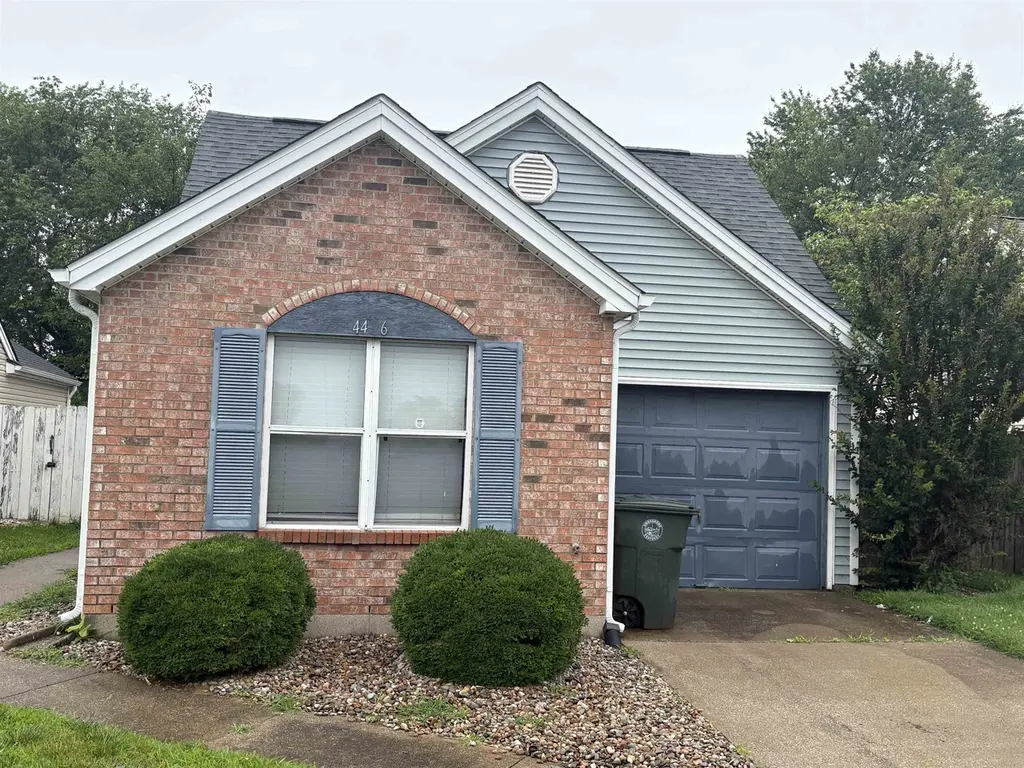
4426 Strickland Dr · Owensboro, KY
Flood risk 1/10 · Minimal
- FEMA flood zone
- X (unshaded)
- Chance of flooding over 30 yrs
- 0.0%
- Est. flood insurance / yr
- $507 – $1,088
Fire risk 1/10 · Minimal
- Est. fire insurance / yr
- $839 – $1,559
Heat risk 5/10 · Moderate
- Hot days now (above 108°F)
- 7 days/yr
- Hot days in 30 yrs
- 19 days/yr
Wind risk 2/10 · Minimal
- Chance of severe wind over 30 yrs
- 4.0%
Air-quality risk 2/10 · Minimal
- Unhealthy air days now
- 1 days/yr
- Unhealthy air days in 30 yrs
- 1 days/yr
Risk factors via First Street. Map © Google.
Why this score? — see what drove the D grade
The composite is a weighted blend of 9 inputs, each scored 0–100. Each bar is that input's sub-score; the figure is the points it added to the 100-point composite (weight × sub-score).
- Cash flow +14.0/30.0
- ARV discount +9.4/15.0
- DSCR +4.2/10.0
- Livability +3.6/5.0
- Schools +3.2/10.0
- 1% rule +3.1/10.0
- Rent growth +2.5/5.0
- Condition / age +2.5/5.0
- Appreciation +0.0/10.0
$165,000
🖨 Deal sheet 📄 Offer letter ✓ Due diligence
Listing remarks MLS
Great location on this patio home. Home features a replaced roof in 2016, freshly painted interior, and privacy fenced backyard with large storage building. This home has a very convenient location that gives you quick access to downtown Owensboro, South Frederica Street, and the growing Hwy 54 corridor.
Key facts
- 4,370 sq ft lot
- Built 1990
Property features AI
Finance
- Other: Located in the WindSong subdivision
- Financial info:
- HOA & community:
Exterior
- Parking:
- Security:
- Utilities: Natural gas available; Public sewer
- Home design: Single-family residence; 1 story
- Construction: Frame construction with vinyl siding; Slab foundation; Built area above grade approximately 1,000
- Exterior features: Level lot
Interior
- Kitchen: Range; Refrigerator
- Bedrooms:
- Flooring: Vinyl
- Bathrooms: 2 full bathrooms
- Heating & cooling: Forced air heating; Heating present
- Interior features: Gas water heater; Vinyl flooring
- Laundry & utility:
Neighborhood map
What this means for you Summary
Snapshot
- This is a 3-bed/2.0-bath single-family listed at $165k.
Deal economics
- At list price, monthly cash flow is $21 ($256/yr) — positive.
- The deal already cash-flows at list — no discount required.
- To meet the 1% rule (rent ≥ 1% of price), the offer needs to be $134k (19.0% below list).
- Recommended offer: $134k (19.0% below list) — sets the bar for 1% rule.
- Cap rate 6.4% vs local median 3.1% in Owensboro — top-decile yield for the area; either an underpriced asset or a hidden risk that comps aren't pricing in. Stress-test before assuming the spread holds.
Location & tenants
- Location reads 71/100 on livability (#148 in KY) — a middle-class / working-renter tenant base. Strengths: cost of living A+, housing A+, health & safety B; Watch: employment D+, crime D-, amenities F.
- Daviess County (suburban): math 33% / reading 41% proficiency, ranked #43 of 165 in KY (top 26%) — families likely to look elsewhere, expect single-tenant / working-renter base with shorter leases.
- Zoned schools: F T Burns Elementary School (math 27% / reading 37%, grade F, #348 of 676 statewide, top 55%, 479 students, 74% FRL); F T Burns Middle School (math 23% / reading 40%, grade F, #125 of 217 statewide, top 63%, 710 students, 67% FRL); Apollo High School (math 33% / reading 34%, grade F, #92 of 254 statewide, top 36%, 1,440 students, 55% FRL) — zoned schools average 65% FRL vs 42% district-wide (23 pts higher); higher-poverty schools than district average — tighter screening recommended.
- Market conditions: 297 active listings in the ZIP; 1 comparable units currently listed for rent nearby; 226 units permitted in Daviess County in 2024 (6 in 5+ unit buildings).
Forward outlook
- Local home prices are declining (-3.0%/yr); year-one equity from $1k of loan paydown is wiped out by about $5k of value loss. Plan a longer hold.
- Daviess County population projected at +6% by 2050 — modest demand growth; plan on rents tracking national, not racing it.
Negotiation context
- Only 1 days on market — expect competitive offers; lowballing is unlikely to land.
- 3 sale attempts since 13y ago with the ask held roughly flat each time — persistent listings suggest the price (not the market) is what's stuck; bring a comps-based counter.
- Current owner paid $91k; list at $165k implies a 81% gain — meaningful room to come down on a strong offer.
Risks & watch-outs
- Climate carrying-cost: extreme-heat days projected 7→19/yr by 2055 (HVAC capex compounding) — expect insurance premiums to compound above CPI over the hold.
Questions for the listing agent
- Is there a deadline driving the sale (1031 exchange, divorce, estate, relocation)? That informs how much negotiation room exists.
- Crime grade is D in this area — have there been break-ins, vandalism, or insurance claims at this property in the last 3 years? What carrier currently insures it and at what premium?
- The area grade is low — what's the realistic commute time and amenity access for the typical tenant pool here? Any planned neighborhood developments (good or bad) we should know about?
- What's the average days-on-market for RENTAL listings here right now (not sales)? A rising rental-DOM trend means longer vacancies and softer asking-rent achievability than the comps imply.
- What's the recent tenant-quality profile in this submarket — average credit score on applications, eviction rate, late-payment / NSF rate, and stable-employment percentage? A property-management company in the area should have these aggregated.
- How much new for-sale + rental construction is in the pipeline within 1–3 miles? Heavy new supply typically softens prices + rents 12–24 months out; constrained supply supports both.
Investment metrics
- 1% rule
- 0.81% ✗
- Cap rate
- 6.45%
- Cash-on-cash
- 0.55%
- DSCR
- 1.02
- GRM
- 10.3
CMA / ARV
- ARV (on-the-fly)
- $172,172
- Comps found
- 12
Show comp detail 12 sales within ~0.75 mi
| Address | Dist | Beds/Ba | Sqft | Sold | Price | $/sf | Match |
|---|---|---|---|---|---|---|---|
| 4406 Strickland Dr | 0.04mi | 3/2.0 | 968 (-3%) | 8mo | $165,000 | $170 | 86 |
| 2500 Haviland Dr | 0.08mi | 2/2.0 (-1) | 975 (-3%) | 1mo | $176,000 | $181 | 86 |
| 2422 Haviland Dr | 0.13mi | 2/2.0 (-1) | 975 (-3%) | 2mo | $175,000 | $179 | 83 |
| 2427 Latrobe Ave | 0.27mi | 3/2.0 | 1,028 (+3%) | 1mo | $200,000 | $195 | 82 |
| 4555 Cove Pointe | 0.30mi | 3/1.0 | 1,015 (+1%) | 6mo | $160,000 | $158 | 75 |
| 2517 Latrobe Ave | 0.28mi | 3/1.5 | 1,044 (+4%) | 4mo | $180,000 | $172 | 74 |
| 2436 Strickland Dr | 0.18mi | 3/1.5 | 1,044 (+4%) | 10mo | $171,500 | $164 | 74 |
| 4410 Strickland Dr | 0.03mi | 2/2.0 (-1) | 888 (-11%) | 9mo | $165,000 | $186 | 67 |
| 4321 Mcintire Xing | 0.26mi | 2/1.0 (-1) | 960 (-4%) | 7mo | $155,500 | $162 | 66 |
| 2501 Strickland Dr | 0.20mi | 3/1.0 | 1,126 (+12%) | 8mo | $190,000 | $169 | 59 |
| 4474 Strickland Dr | 0.09mi | 2/1.0 (-1) | 873 (-13%) | 10mo | $145,000 | $166 | 57 |
| 3838 Rudy Martin Dr | 0.61mi | 3/1.0 | 925 (-8%) | 9mo | $166,000 | $179 | 48 |
Match score weights: distance 35% · size 25% · config 20% · recency 20%. Top-matched comps best support the ARV.
Projected returns pro-forma
-3.0% appreciation · 3.0% rent growth · sell at horizon
- IRR
- -15.5%
- Equity multiple
- 0.45×
- Total profit
- $-25,421
- Equity at exit
- $24,602
- IRR
- -7.0%
- Equity multiple
- 0.55×
- Total profit
- $-20,566
- Equity at exit
- $14,266
Cash invested: $46,200 (down + closing). Projections, not guarantees.
Landlord ↔ Tenant lean methodology
- Overall (STATE)
- 83 Strongly Landlord-Friendly
- State Kentucky
- 83 Strongly Landlord-Friendly · R+16
- County
- — inherits STATE
- City
- — inherits STATE
ZIP-level market 42301
- Home prices YoY
- -31.0%
- Active inventory
- 297
- Price-to-rent
- 10.3×
Monthly cashflow live
- Estimated rent
- $1,337 medium interval (Pro) →
- Mortgage (P&I)
- −$865
- Tax from tax record
- −$101 /mo · $1,209/yr
- Insurance
- −$69
- HOA
- −$0
- Vacancy / Maint / Mgmt
- −$281
- Net cashflow
- $21
Break-even live
UW: 25.0% down · 7.5% · 30yr · 1.5% tax · 5.0% vac · 8.0% maint · 8.0% mgmt
Financing live
Cash to close
- Down payment
- $41,250
- Closing costs
- $4,950
- Reserves months
- —
- Total cash needed
- —
Loan-product check · same deal, 3 products live
Conventional
25% down · 7.5% · 30yr
- Down + closing
- —
- Monthly P&I
- —
- Monthly cashflow
- —
- DSCR
- —
- Eligible?
- —
Personal DTI + credit; lowest rate.
DSCR
20% down · 8.5% · 30yr
- Down + closing
- —
- Monthly P&I
- —
- Monthly cashflow
- —
- DSCR
- —
- Eligible?
- —
No personal income docs; deal must DSCR.
Hard money
10% down · 12.0% · 12mo
- Down + closing
- —
- Monthly P&I
- —
- Monthly cashflow
- —
- DSCR
- —
- Eligible?
- —
Short-term bridge; refi at stabilization.
Rent comps 1 comps
| Address | Beds | Baths | Sqft | Rent | $/sqft | DOM | Units | Dist |
|---|---|---|---|---|---|---|---|---|
| 2100 Tamarack Rd Unit 4A Owensboro, KY | 2.0 | 1.0 | 800 | $795 | $0.99 | 44d | 1 | 1.11mi |
Listing history 2 events
-
2026-06-07status $165,000 Pending 1 DOM
-
2026-06-05$165,000 Active 1 DOM
ⓘ Source: listings_history table (triggers on properties + properties_extension) + one-shot
backfill from property_details.listing_events for pre-trigger history.
Tax reassessment forecast KY · Resets to sale price
- Current annual tax
- $1,209 · $101/mo
- Projected year-2 tax
- $1,419 · $118/mo
- Expected delta
- +$210/yr (+$17/mo · 17.4%)
ⓘ Screening estimate from a state-policy table — verify with the county assessor before closing.
Climate risk First Street
- Flood 1/10 Low FEMA zone X (unshaded) · 0% chance over 30 yrs
- Wildfire 1/10 Low
- Heat 5/10 Major 7 d/yr ≥108°F today · 19 d/yr by 30 yrs out
- Wind 2/10 Low 4% chance of damaging wind over 30 yrs
- Air quality 2/10 Low 1 unhealthy d/yr today · 1 by 30 yrs out
Nearby sold comps map
Loading sold comps map…
Walkable amenities ~0.75 mi
Loading nearby amenities…
Taxation est. · year 1
- Rental income
- $16,043
- − Mortgage interest
- −$9,243
- − Property taxes
- −$1,209
- − Insurance
- −$825
- − Repairs & maintenance
- −$1,283
- − Management
- −$1,283
- − Depreciation
- −$4,800
- Taxable loss
- −$2,601
- Est. tax savings @ 24.0%
- +$624
- After-tax cash flow
- $880/yr
For passive investors: Depreciation is non-cash, so a rental often shows a tax loss while cash-flowing — sheltering income. Rental losses are passive: they offset passive income freely, and up to $25,000/yr can offset ordinary (W-2) income if you actively participate and your MAGI is under $100k (phasing out to $0 by $150k); unused losses carry forward. On sale, claimed depreciation is recaptured at up to 25%, and gains may owe capital-gains tax (a 1031 exchange can defer both). Figures are a year-1 estimate at your 24.0% rate — not tax advice; consult a CPA.
Schools (NCES district)
- District
- Daviess County
- NCES district ID
- 2101470
- Math proficiency
- 33% ▼ -17.00%
- Reading proficiency
- 41% ▼ -16.00%
- Median HH income
- $52,303
- Composite
- 32.2/100
- National rank
- #5778
- State rank
- #43 of 165 in KY
Livability — Owensboro
- Score
- 71/100
- State rank
- #148
- US rank
- #7153
Category grades
Schools grade is shown separately in the Schools card above.
Census & demographics
- Census place
- Owensboro, KY
- County
- Daviess County · 87,564 people
- City population
- 87,564
- Metro
- Owensboro, KY
- Population (ZIP)
- 45,445
- Household income
- $66,885
- Rent vs Own
- Severe rent burden
- 1228.0
Population outlook (Daviess County) Hauer SSP2
- Today (2025)
- 103,810 people
- By 2030
- 105,722 · +1.8%
- By 2040
- 108,731 · +4.7%
- By 2050
- 110,295 · +6.2%
- By 2075
- 113,056 · +8.9%
- By 2100
- 106,257 · +2.4%
Race, ethnicity, and origin ACS 2023
- Neighborhood character
- Predominantly White (82%)
- Race & ethnicity
- White 82% Black 6% Two or more races 5% Hispanic / Latino 4% Asian 3%
- Common ancestry
- Slovak 3% Italian 1% Romanian 1%
- Foreign-born
- 5% · Canada, Philippines
- Languages at home
- 92% English-only · Spanish 4% Other Asian/Pacific 2%
Political lean MEDSL · Daviess
- 2024 margin
- Solid R (+31.9) · D 33.3% · R 65.2% · Other 1.5%
- 2008→2024 swing
- -21.8pp toward R · 2008: -10.1pp · 2024: -31.9pp
- All cycles
- 2024: R+31.9 2020: R+27.9 2016: R+32.2 2012: R+21.1 2008: R+10.1
Not yet ingested
- Civics
- —
Market trends
- HPI YoY
- ▼ -106.96%
- Current HPI
- 238.2395
- Rent YoY
- —
- Metro
- Owensboro, KY
- State GDP YoY
- ▲ 1.81%
- F500 in state
- 4
Industry mix (Fortune 500 HQ in KY)
| Industry | F500 HQs | Revenue |
|---|---|---|
| Healthcare | 1 | $118B |
|
||
| Food / Beverage | 1 | $7B |
|
||
Price history
+106.5% since first listed6 events — show timeline
- 2026-06-04 Listed $165,000 GORAMLS
- 2018-12-04 Sold (Public Records) $91,000 Public Records
- 2018-12-04 Sold (MLS) $91,000 GORAMLS
- 2018-09-22 Listed $94,900 GORAMLS
- 2013-07-17 Sold (MLS) $74,450 GORAMLS
- 2013-04-03 Listed $79,900 GORAMLS
Property tax history
-5.3%/yrLatest (2025): $1,209 · -2.2% YoY. Source: county tax records.
Cash-flow waterfall
monthlySold comps — $/sqft
last 12 mo · ≤1 miLoading sold comps…