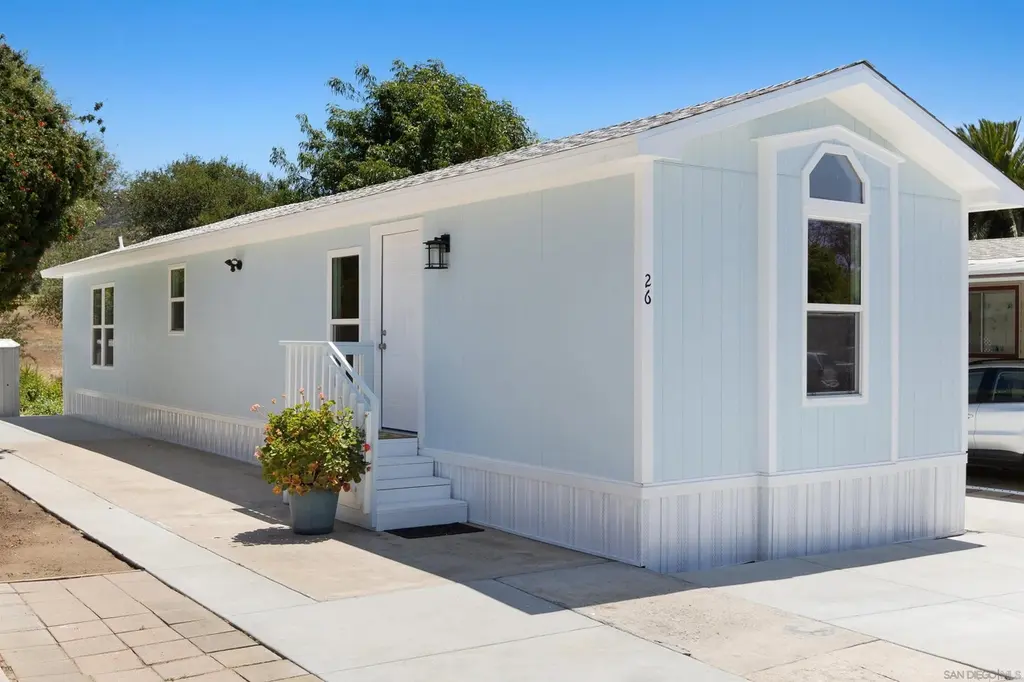
2030 Black Canyon Rd #26 · Ramona, CA
Flood risk 8/10 · Major
- FEMA flood zone
- X (shaded)
- Chance of flooding over 30 yrs
- 0.99%
- Est. flood insurance / yr
- $507 – $1,088
Fire risk 10/10 · Severe
- Est. fire insurance / yr
- $659 – $1,223
Heat risk 6/10 · Moderate
- Hot days now (above 97°F)
- 7 days/yr
- Hot days in 30 yrs
- 22 days/yr
Wind risk 1/10 · Minimal
- Chance of severe wind over 30 yrs
- —
Air-quality risk 5/10 · Moderate
- Unhealthy air days now
- 9 days/yr
- Unhealthy air days in 30 yrs
- 10 days/yr
Risk factors via First Street. Map © Google.
Why this score? — see what drove the C+ grade
The composite is a weighted blend of 9 inputs, each scored 0–100. Each bar is that input's sub-score; the figure is the points it added to the 100-point composite (weight × sub-score).
- Cash flow +27.2/30.0
- DSCR +9.4/10.0
- ARV discount +7.5/15.0
- 1% rule +7.4/10.0
- Schools +4.3/10.0
- Livability +3.2/5.0
- Rent growth +2.9/5.0
- Condition / age +2.5/5.0
- Appreciation +0.0/10.0
$174,000
🖨 Deal sheet 📄 Offer letter ✓ Due diligence
Listing remarks MLS
Unlock Ramona’s best value! This 840 sq ft, 2BR/2BA home in Canyon Ridge Estates has the essentials—laminate floors, indoor laundry, peaceful rural living—and plenty of potential to make it your own.
Key facts
- 2 parking spots
- Built 1988
- Listed 49 days
Property features AI
Finance
- Other: Directions: Highway 78 to Magnolia which turns into Black Canyon Rd.
- HOA & community: Trash service through association; Located in Canyon Ridge Estates; Senior community
Exterior
- Parking: 2 parking spaces
- Security: Carbon monoxide detector(s); Smoke detector(s); Security lights
- Utilities: Public water and shared well; Water connected; Sewer connected; Electricity available and connected; Cable available; Propane available
- Home design: Manufactured home; Single-story
- Construction: Composition roof; Updated/remodeled condition
- Exterior features: Has view; Shed(s)
Interior
- Kitchen: Dishwasher not listed; Free-standing range; Propane cooktop; Microwave; Disposal
- Bedrooms: 2 possible bedrooms
- Flooring: Carpet; Laminate; Tile
- Bathrooms: 2 full bathrooms
- Heating & cooling: Propane heating (propane appliances noted)
- Interior features: Updated/remodeled interior; Disposal; Microwave; Free-standing range; Propane cooktop; Gas water heater
- Laundry & utility: Washer hookup; Washer and dryer listed; Common area laundry
Neighborhood map
What this means for you Summary
Snapshot
- This is a 2-bed/2.0-bath manufactured listed at $174k.
Deal economics
- At list price, monthly cash flow is $431 ($5k/yr) — positive.
- The deal already cash-flows at list — no discount required.
- Meets the 1% rule at list price ($2k rent vs $174k).
- Recommended offer: $169k (3.0% below list) — sets the bar for market timing.
- Cap rate 9.7% vs local median 2.0% in Ramona — top-decile yield for the area; either an underpriced asset or a hidden risk that comps aren't pricing in. Stress-test before assuming the spread holds.
Location & tenants
- Location reads 65/100 on livability (#374 in CA) — a middle-class / working-renter tenant base. Strengths: employment A, commute B+; Watch: amenities C-, crime D+, schools D.
- Ramona City Unified (town): math 32% / reading 63% proficiency, ranked #144 of 517 in CA (top 28%) — families likely to look elsewhere, expect single-tenant / working-renter base with shorter leases.
- Market conditions: Rents rising (+1.7%/yr); 177 active listings in the ZIP; high-income renter base; 11,759 units permitted in San Diego County in 2024 (7,244 in 5+ unit buildings).
Forward outlook
- Local home prices are declining (-3.0%/yr); year-one equity from $1k of loan paydown is wiped out by about $5k of value loss. Plan a longer hold.
- San Diego County population projected at +20% by 2050 — long-run rental-demand tailwind backs the buy-and-hold thesis.
Negotiation context
- It's been on market 49 days — a 3% lower offer ($169k) is reasonable based on typical stale-listing flexibility.
- 3 sale attempts with the ask held roughly flat each time — persistent listings suggest the price (not the market) is what's stuck; bring a comps-based counter.
- Current owner paid $49k; list at $174k implies a 255% gain — meaningful room to come down on a strong offer.
Risks & watch-outs
- Watch-outs: flood insurance adds $66/mo.
- Climate carrying-cost: severe flood risk; severe wildfire risk; extreme-heat days projected 7→22/yr by 2055 (HVAC capex compounding) — expect insurance premiums to compound above CPI over the hold.
Questions for the listing agent
- It's been on market 49 days. Have you received any prior offers? Is the seller open to a 3% concession, seller financing, or rate buy-down credit?
- What's the actual annual flood-insurance premium (NFIP or private), and is the property in a SFHA with mandatory coverage?
- Is there a deadline driving the sale (1031 exchange, divorce, estate, relocation)? That informs how much negotiation room exists.
- Schools are D-rated, which usually means shorter tenancies and higher turnover. Who's the typical renter profile here, and what's been the actual vacancy rate?
- Crime grade is D in this area — have there been break-ins, vandalism, or insurance claims at this property in the last 3 years? What carrier currently insures it and at what premium?
- What's the average days-on-market for RENTAL listings here right now (not sales)? A rising rental-DOM trend means longer vacancies and softer asking-rent achievability than the comps imply.
- What's the recent tenant-quality profile in this submarket — average credit score on applications, eviction rate, late-payment / NSF rate, and stable-employment percentage? A property-management company in the area should have these aggregated.
- How much new for-sale + rental construction is in the pipeline within 1–3 miles? Heavy new supply typically softens prices + rents 12–24 months out; constrained supply supports both.
Investment metrics
- 1% rule
- 1.24% ✓
- Cap rate
- 9.72%
- Cash-on-cash
- 12.25%
- DSCR
- 1.54
- GRM
- 6.7
CMA / ARV
No comps found within radius.
Projected returns pro-forma
-3.0% appreciation · 1.71% rent growth · sell at horizon
- IRR
- -1.9%
- Equity multiple
- 0.93×
- Total profit
- $-3,442
- Equity at exit
- $25,944
- IRR
- 6.3%
- Equity multiple
- 1.44×
- Total profit
- $21,607
- Equity at exit
- $15,044
Cash invested: $48,720 (down + closing). Projections, not guarantees.
Landlord ↔ Tenant lean methodology
- Overall (STATE)
- 18 Strongly Tenant-Friendly
- State California
- 18 Strongly Tenant-Friendly · D+13
- County
- — inherits STATE
- City
- — inherits STATE
ZIP-level market 92065
- Rents YoY
- 1.7%
- Active inventory
- 177
- Price-to-rent
- 6.7×
Monthly cashflow live
- Estimated rent
- $2,152 medium interval (Pro) →
- Mortgage (P&I)
- −$912
- Tax est. 1.5%
- −$218 /mo · $2,610/yr
- Insurance
- −$72
- Flood insurance flood zone
- −$66 /mo · $798/yr
- HOA
- −$0
- Vacancy / Maint / Mgmt
- −$452
- Net cashflow
- $431
Break-even live
UW: 25.0% down · 7.5% · 30yr · 1.5% tax · 5.0% vac · 8.0% maint · 8.0% mgmt
Financing live
Cash to close
- Down payment
- $43,500
- Closing costs
- $5,220
- Reserves months
- —
- Total cash needed
- —
Loan-product check · same deal, 3 products live
Conventional
25% down · 7.5% · 30yr
- Down + closing
- —
- Monthly P&I
- —
- Monthly cashflow
- —
- DSCR
- —
- Eligible?
- —
Personal DTI + credit; lowest rate.
DSCR
20% down · 8.5% · 30yr
- Down + closing
- —
- Monthly P&I
- —
- Monthly cashflow
- —
- DSCR
- —
- Eligible?
- —
No personal income docs; deal must DSCR.
Hard money
10% down · 12.0% · 12mo
- Down + closing
- —
- Monthly P&I
- —
- Monthly cashflow
- —
- DSCR
- —
- Eligible?
- —
Short-term bridge; refi at stabilization.
Listing history 25 events
-
2026-06-18days on market $174,000 Active 49 DOM
-
2026-06-17days on market $174,000 Active 48 DOM
-
2026-06-16days on market $174,000 Active 47 DOM
-
2026-06-15days on market $174,000 Active 46 DOM
-
2026-06-13days on market $174,000 Active 44 DOM
-
2026-06-13days on market $174,000 Active 43 DOM
-
2026-06-10price $174,000 Active 40 DOM
-
2026-06-09days on market $179,999 Active 40 DOM
-
2026-06-08days on market $179,999 Active 39 DOM
-
2026-06-07days on market $179,999 Active 38 DOM
-
2026-06-04days on market $179,999 Active 35 DOM
-
2026-06-03days on market $179,999 Active 34 DOM
-
2026-06-02days on market $179,999 Active 33 DOM
-
2026-06-02remarks 699-char remark
-
2026-06-01days on market $179,999 Active 32 DOM
-
2026-05-31days on market $179,999 Active 31 DOM
-
2026-04-30$179,999 Active 1110-char remark
-
2026-01-09soldstatus $49,000 Closed Sale 217-char remark
Show marketing remark (217 chars)
Unlock Ramona’s best value! This 840 sq ft, 2BR/2BA home in Canyon Ridge Estates has the essentials—laminate floors, indoor laundry, peaceful rural living—and plenty of potential to make it your own.
-
2025-12-15status Pending Sale 217-char remark
Show marketing remark (217 chars)
Unlock Ramona’s best value! This 840 sq ft, 2BR/2BA home in Canyon Ridge Estates has the essentials—laminate floors, indoor laundry, peaceful rural living—and plenty of potential to make it your own.
-
2025-12-09$49,000 Active 217-char remark
Show marketing remark (217 chars)
Unlock Ramona’s best value! This 840 sq ft, 2BR/2BA home in Canyon Ridge Estates has the essentials—laminate floors, indoor laundry, peaceful rural living—and plenty of potential to make it your own.
-
2025-12-06historical
-
2025-10-16price $85,000
-
2025-08-14price $99,500
-
2025-07-23price $110,000
-
2025-06-28$120,000 Active
ⓘ Source: listings_history table (triggers on properties + properties_extension) + one-shot
backfill from property_details.listing_events for pre-trigger history.
Climate risk First Street
- Flood 8/10 Severe FEMA zone X (shaded) · 99% chance over 30 yrs
- Wildfire 10/10 Extreme
- Heat 6/10 Major 7 d/yr ≥97°F today · 22 d/yr by 30 yrs out
- Wind 1/10 Low
- Air quality 5/10 Major 9 unhealthy d/yr today · 10 by 30 yrs out
Nearby sold comps map
Loading sold comps map…
Walkable amenities ~0.75 mi
Loading nearby amenities…
Taxation est. · year 1
- Rental income
- $25,819
- − Mortgage interest
- −$9,747
- − Property taxes
- −$2,610
- − Insurance
- −$1,667
- − Repairs & maintenance
- −$2,065
- − Management
- −$2,065
- − Depreciation
- −$5,062
- Taxable income
- $2,602
- Est. tax owed @ 24.0%
- −$624
- After-tax cash flow
- $4,545/yr
For passive investors: Depreciation is non-cash, so a rental often shows a tax loss while cash-flowing — sheltering income. Rental losses are passive: they offset passive income freely, and up to $25,000/yr can offset ordinary (W-2) income if you actively participate and your MAGI is under $100k (phasing out to $0 by $150k); unused losses carry forward. On sale, claimed depreciation is recaptured at up to 25%, and gains may owe capital-gains tax (a 1031 exchange can defer both). Figures are a year-1 estimate at your 24.0% rate — not tax advice; consult a CPA.
Schools (NCES district)
- District
- Ramona City Unified
- NCES district ID
- 0631710
- Math proficiency
- 32% ▼ -6.00%
- Reading proficiency
- 63% ▲ 10.00%
- Median HH income
- $79,226
- Composite
- 43.38/100
- National rank
- #3023
- State rank
- #144 of 517 in CA
Livability — Ramona
- Score
- 65/100
- State rank
- #374
- US rank
- #12777
Category grades
Schools grade is shown separately in the Schools card above.
Census & demographics
- Census place
- Ramona, CA
- County
- San Diego County · 3,178,799 people
- City population
- 36,752
- Metro
- San Diego-Chula Vista-Carlsbad, CA
- Population (ZIP)
- 36,752
- Household income
- $125,285
- Rent vs Own
- Severe rent burden
- 850.0
Population outlook (San Diego County) Hauer SSP2
- Today (2025)
- 3,678,185 people
- By 2030
- 3,856,546 · +4.8%
- By 2040
- 4,171,407 · +13.4%
- By 2050
- 4,421,607 · +20.2%
- By 2075
- 4,831,599 · +31.4%
- By 2100
- 4,832,502 · +31.4%
Race, ethnicity, and origin ACS 2023
- Neighborhood character
- Majority White (61%)
- Race & ethnicity
- White 61% Hispanic / Latino 31% Two or more races 18% Asian 2%
- Hispanic origin (detail)
- Mexican 27%
- Common ancestry
- Lithuanian 3% Italian 2% Slovak 2%
- Foreign-born
- 12% · Canada
- Languages at home
- 76% English-only · Spanish 21% Other Indo-European 1%
Political lean MEDSL · San Diego
- 2024 margin
- D (+16.8) · D 56.9% · R 40.1% · Other 2.9%
- 2008→2024 swing
- +6.6pp toward D · 2008: 10.2pp · 2024: 16.8pp
- All cycles
- 2024: D+16.8 2020: D+22.8 2016: D+17.8 2012: D+5.1 2008: D+10.2
Not yet ingested
- Civics
- —
Market trends
- HPI YoY
- ▼ -595.55%
- Current HPI
- 301.465
- Rent YoY
- ▲ 1.71%
- Metro
- San Diego-Chula Vista-Carlsbad, CA
- State GDP YoY
- ▲ 3.21%
- F500 in state
- 116
Industry mix (Fortune 500 HQ in CA)
| Industry | F500 HQs | Revenue |
|---|---|---|
| Technology | 27 | $1,492B |
|
||
| Financial Services | 3 | $174B |
|
||
| Retail | 3 | $44B |
|
||
| Insurance | 3 | $26B |
|
||
| Media / Entertainment | 2 | $115B |
|
||
| Pharmaceuticals / Biotech | 2 | $62B |
|
||
Price history
+45.0% since first listed10 events — show timeline
- 2026-06-09 Price Changed $174,000 SDMLS
- 2026-04-30 Listed $179,999 SDMLS
- 2026-01-09 Sold (MLS) $49,000 CRMLS
- 2025-12-15 Pending — CRMLS
- 2025-12-09 Listed $49,000 CRMLS
- 2025-12-06 Listing Removed — SDMLS
- 2025-10-16 Price Changed $85,000 SDMLS
- 2025-08-14 Price Changed $99,500 SDMLS
- 2025-07-23 Price Changed $110,000 SDMLS
- 2025-06-28 Listed $120,000 SDMLS
Cash-flow waterfall
monthlySold comps — $/sqft
last 12 mo · ≤1 miLoading sold comps…