 🏷️ Likely Rental
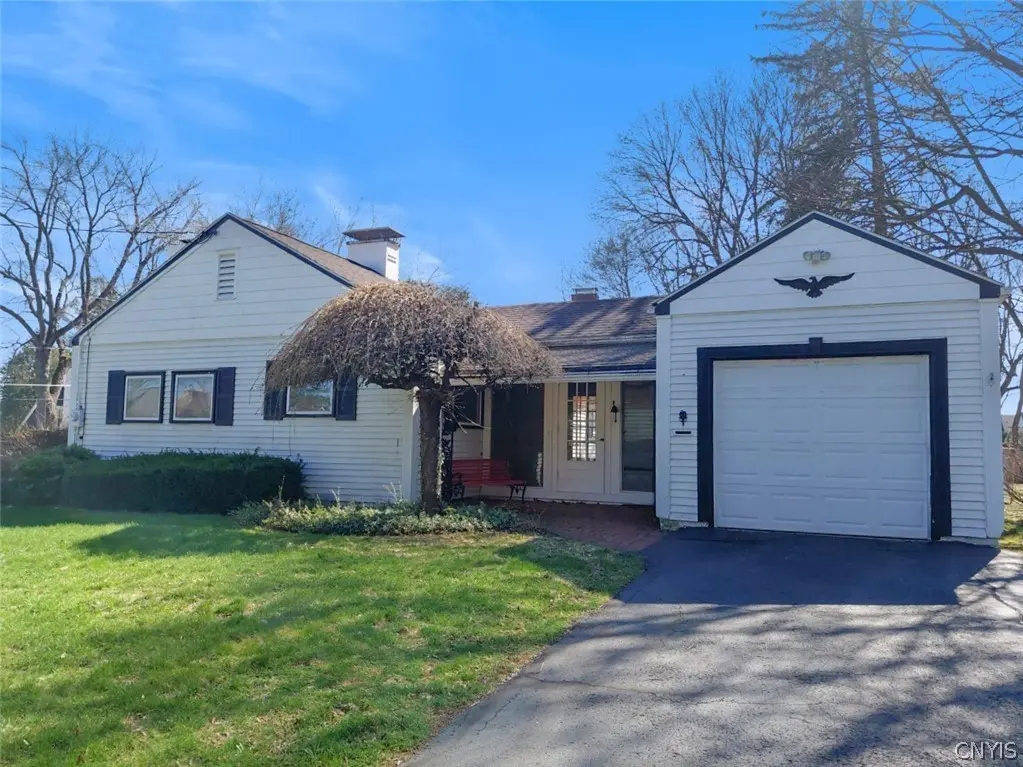
200 Ambergate Rd · De Witt, NY
Flood risk 1/10 · Minimal
- FEMA flood zone
- X (unshaded)
- Chance of flooding over 30 yrs
- 0.0%
- Est. flood insurance / yr
- $473 – $860
Fire risk 2/10 · Minimal
- Est. fire insurance / yr
- $691 – $1,283
Heat risk 3/10 · Minor
- Hot days now (above 96°F)
- 7 days/yr
- Hot days in 30 yrs
- 16 days/yr
Wind risk 1/10 · Minimal
- Chance of severe wind over 30 yrs
- 0.0%
Air-quality risk 2/10 · Minimal
- Unhealthy air days now
- 0 days/yr
- Unhealthy air days in 30 yrs
- 1 days/yr
Risk factors via First Street. Map © Google.
Why this score? — see what drove the C grade
The composite is a weighted blend of 9 inputs, each scored 0–100. Each bar is that input's sub-score; the figure is the points it added to the 100-point composite (weight × sub-score).
- Cash flow +15.4/30.0
- ARV discount +15.0/15.0
- 1% rule +7.1/10.0
- Schools +6.2/10.0
- DSCR +4.7/10.0
- Rent growth +2.5/5.0
- Livability +2.5/5.0
- Condition / age +2.5/5.0
- Appreciation +0.0/10.0
$179,950
🖨 Deal sheet 📄 Offer letter ✓ Due diligence
Listing remarks MLS
Home is being sold "AS IS"-occupied. Do not step on property; do not disturb occupants. Subject property is being sold occupied with any and all occupants in AS IS/WHERE IS condition. Neither the seller nor the listing broker can verify the existence of any lease agreement, either written or verbal, nor any rental amount being paid, due or owing. Please DO NOT disturb the occupants. Access for inspections or other purposes is NOT guaranteed. No viewings are allowed.
Key facts
- 7,841 sq ft lot
- Garage
- Built 1952
Neighborhood map
What this means for you Summary
Snapshot
- This is a 3-bed/1.5-bath single-family listed at $180k.
Deal economics
- At list price, monthly cash flow is $69 ($827/yr) — positive.
- The deal already cash-flows at list — no discount required.
- Meets the 1% rule at list price ($2k rent vs $180k).
- Recommended offer: $175k (3.0% below list) — sets the bar for market timing.
- Cap rate 6.8% vs local median 3.8% in De Witt — top-decile yield for the area; either an underpriced asset or a hidden risk that comps aren't pricing in. Stress-test before assuming the spread holds.
Location & tenants
- Location reads: area grade C — affects rentability + tenant quality, not the cash-flow math above.
- Jamesville-Dewitt Central School District (suburban): math 69% / reading 71% proficiency, ranked #124 of 590 in NY (top 21%) — strong family-tenant draw, lease renewals of 3-5y typical; only 13% free/reduced lunch — higher-income household profile.
- Market conditions: 32 active listings in the ZIP; 2 comparable units currently listed for rent nearby; 616 units permitted in Onondaga County in 2024 (256 in 5+ unit buildings).
Forward outlook
- Local home prices are declining (-3.0%/yr); year-one equity from $1k of loan paydown is wiped out by about $5k of value loss. Plan a longer hold.
- Onondaga County population projected to shrink 9% by 2050 — rents likely to lag national; underwrite the cash flow, not the appreciation.
Negotiation context
- It's been on market 51 days — a 3% lower offer ($175k) is reasonable based on typical stale-listing flexibility.
Risks & watch-outs
- Watch-outs: property tax is 4.2% of price; built in 1952 — expect roof / HVAC / electrical / plumbing capex.
Questions for the listing agent
- It's been on market 51 days. Have you received any prior offers? Is the seller open to a 3% concession, seller financing, or rate buy-down credit?
- Built in 1952 — when were the roof, HVAC, electrical panel, plumbing, and water heater last replaced?
- Property tax is high relative to price — has the assessment been appealed recently, and will the sale trigger a re-assessment?
- Is there a deadline driving the sale (1031 exchange, divorce, estate, relocation)? That informs how much negotiation room exists.
- What's the average days-on-market for RENTAL listings here right now (not sales)? A rising rental-DOM trend means longer vacancies and softer asking-rent achievability than the comps imply.
- What's the recent tenant-quality profile in this submarket — average credit score on applications, eviction rate, late-payment / NSF rate, and stable-employment percentage? A property-management company in the area should have these aggregated.
- How much new for-sale + rental construction is in the pipeline within 1–3 miles? Heavy new supply typically softens prices + rents 12–24 months out; constrained supply supports both.
Investment metrics
- 1% rule
- 1.21% ✓
- Cap rate
- 6.75%
- Cash-on-cash
- 1.64%
- DSCR
- 1.07
- GRM
- 6.9
CMA / ARV
- ARV (median comp)
- $261,558
- List price
- $179,950
- Delta
- -31.20%
- Verdict
- UNDERPRICED
- Comps
- 7 within 1.0 mi
Show comp detail 1 sale within ~0.75 mi
| Address | Dist | Beds/Ba | Sqft | Sold | Price | $/sf | Match |
|---|---|---|---|---|---|---|---|
| 107 Stonecrest Dr | 0.66mi | 4/1.5 (+1) | 980 (+13%) | 11mo | $265,000 | $270 | 33 |
Match score weights: distance 35% · size 25% · config 20% · recency 20%. Top-matched comps best support the ARV.
Projected returns pro-forma
-3.0% appreciation · 3.0% rent growth · sell at horizon
- IRR
- -13.5%
- Equity multiple
- 0.51×
- Total profit
- $-24,487
- Equity at exit
- $26,831
- IRR
- -4.3%
- Equity multiple
- 0.71×
- Total profit
- $-14,516
- Equity at exit
- $15,559
Cash invested: $50,386 (down + closing). Projections, not guarantees.
Landlord ↔ Tenant lean methodology
- Overall (STATE)
- 15 Strongly Tenant-Friendly
- State New York
- 15 Strongly Tenant-Friendly · D+10
- County
- — inherits STATE
- City
- — inherits STATE
ZIP-level market 13214
- Home prices YoY
- -10.3%
- Active inventory
- 32
- Price-to-rent
- 6.9×
Monthly cashflow live
- Estimated rent
- $2,181 medium interval (Pro) →
- Mortgage (P&I)
- −$944
- Tax from tax record
- −$635 /mo · $7,622/yr
- Insurance
- −$75
- HOA
- −$0
- Vacancy / Maint / Mgmt
- −$458
- Net cashflow
- $69
Break-even live
UW: 25.0% down · 7.5% · 30yr · 1.5% tax · 5.0% vac · 8.0% maint · 8.0% mgmt
Financing live
Cash to close
- Down payment
- $44,988
- Closing costs
- $5,398
- Reserves months
- —
- Total cash needed
- —
Loan-product check · same deal, 3 products live
Conventional
25% down · 7.5% · 30yr
- Down + closing
- —
- Monthly P&I
- —
- Monthly cashflow
- —
- DSCR
- —
- Eligible?
- —
Personal DTI + credit; lowest rate.
DSCR
20% down · 8.5% · 30yr
- Down + closing
- —
- Monthly P&I
- —
- Monthly cashflow
- —
- DSCR
- —
- Eligible?
- —
No personal income docs; deal must DSCR.
Hard money
10% down · 12.0% · 12mo
- Down + closing
- —
- Monthly P&I
- —
- Monthly cashflow
- —
- DSCR
- —
- Eligible?
- —
Short-term bridge; refi at stabilization.
Rent comps 2 comps
| Address | Beds | Baths | Sqft | Rent | $/sqft | DOM | Units | Dist |
|---|---|---|---|---|---|---|---|---|
| 4449 E Genesee St Syracuse, NY | 3.0 | 1.0 | 1100 | $2,100 | $1.91 | 13d | 1 | 0.19mi |
| 27 Wexford Rd Syracuse, NY | 4.0 | 1.0 | 1000 | $2,300 | $2.30 | 21d | 1 | 0.30mi |
Listing history 2 events
-
2026-05-08price $179,950 480-char remark
Show marketing remark (480 chars)
Home is being sold "AS IS"-occupied. Do not step on property; do not disturb occupants. Subject property is being sold occupied with any and all occupants in AS IS/WHERE IS condition. Neither the seller nor the listing broker can verify the existence of any lease agreement, either written or verbal, nor any rental amount being paid, due or owing. Please DO NOT disturb the occupants. Access for inspections or other purposes is NOT guaranteed. No viewings are allowed.
-
2026-04-07$189,950 Active 480-char remark
Show marketing remark (480 chars)
Home is being sold "AS IS"-occupied. Do not step on property; do not disturb occupants. Subject property is being sold occupied with any and all occupants in AS IS/WHERE IS condition. Neither the seller nor the listing broker can verify the existence of any lease agreement, either written or verbal, nor any rental amount being paid, due or owing. Please DO NOT disturb the occupants. Access for inspections or other purposes is NOT guaranteed. No viewings are allowed.
ⓘ Source: listings_history table (triggers on properties + properties_extension) + one-shot
backfill from property_details.listing_events for pre-trigger history.
Tax reassessment forecast NY · Partial reset (capped growth)
- Current annual tax
- $7,622 · $635/mo
- Projected year-2 tax
- $7,622 · $635/mo
- Expected delta
- $0/yr ($0/mo · 0.0%)
ⓘ Screening estimate from a state-policy table — verify with the county assessor before closing.
Climate risk First Street
- Flood 1/10 Low FEMA zone X (unshaded) · 0% chance over 30 yrs
- Wildfire 2/10 Low
- Heat 3/10 Moderate 7 d/yr ≥96°F today · 16 d/yr by 30 yrs out
- Wind 1/10 Low 0% chance of damaging wind over 30 yrs
- Air quality 2/10 Low 0 unhealthy d/yr today · 1 by 30 yrs out
Nearby sold comps map
Loading sold comps map…
Walkable amenities ~0.75 mi
Loading nearby amenities…
Taxation est. · year 1
- Rental income
- $26,167
- − Mortgage interest
- −$10,080
- − Property taxes
- −$7,622
- − Insurance
- −$900
- − Repairs & maintenance
- −$2,093
- − Management
- −$2,093
- − Depreciation
- −$5,235
- Taxable loss
- −$1,856
- Est. tax savings @ 24.0%
- +$445
- After-tax cash flow
- $1,272/yr
For passive investors: Depreciation is non-cash, so a rental often shows a tax loss while cash-flowing — sheltering income. Rental losses are passive: they offset passive income freely, and up to $25,000/yr can offset ordinary (W-2) income if you actively participate and your MAGI is under $100k (phasing out to $0 by $150k); unused losses carry forward. On sale, claimed depreciation is recaptured at up to 25%, and gains may owe capital-gains tax (a 1031 exchange can defer both). Figures are a year-1 estimate at your 24.0% rate — not tax advice; consult a CPA.
Schools (NCES district)
- District
- Jamesville-Dewitt Central School District
- NCES district ID
- 3609090
- Math proficiency
- 69% ▼ -8.00%
- Reading proficiency
- 71% ▲ 3.00%
- Median HH income
- $74,483
- Composite
- 61.71/100
- National rank
- #739
- State rank
- #124 of 590 in NY
Livability — De Witt
No livability data for this city. (Only ~50 U.S. cities are tracked.)
Census & demographics
- Census place
- De Witt, NY
- City population
- 8,713
- Population (ZIP)
- 8,713
Population outlook (Onondaga County) Hauer SSP2
- Today (2025)
- 467,894 people
- By 2030
- 463,381 · -1.0%
- By 2040
- 447,697 · -4.3%
- By 2050
- 426,399 · -8.9%
- By 2075
- 373,661 · -20.1%
- By 2100
- 307,967 · -34.2%
Race, ethnicity, and origin ACS 2023
- Neighborhood character
- Predominantly White (67%)
- Race & ethnicity
- White 67% Black 14% Two or more races 9% Hispanic / Latino 7% Asian 5% Native American 1%
- Hispanic origin (detail)
- Dominican 3%
- Common ancestry
- Romanian 6% Lithuanian 3% Italian 2%
- Foreign-born
- 8% · Canada, China, Vietnam
- Languages at home
- 84% English-only · Spanish 7% Chinese 2% Other Indo-European 2%
Political lean MEDSL · Onondaga
- 2024 margin
- D (+17.3) · D 58.6% · R 41.4%
- 2008→2024 swing
- -3.0pp toward R · 2008: 20.3pp · 2024: 17.3pp
- All cycles
- 2024: D+17.3 2020: D+20.6 2016: D+12.8 2012: D+21.1 2008: D+20.3
Not yet ingested
- Civics
- —
Market trends
- HPI YoY
- ▼ -38.16%
- Current HPI
- 333.2268
- Rent YoY
- —
- Metro
- —
- State GDP YoY
- ▲ 2.60%
- F500 in state
- 92
Industry mix (Fortune 500 HQ in NY)
| Industry | F500 HQs | Revenue |
|---|---|---|
| Financial Services | 10 | $950B |
|
||
| Consumer Goods | 9 | $162B |
|
||
| Insurance | 4 | $225B |
|
||
| Telecommunications | 2 | $144B |
|
||
| Pharmaceuticals | 2 | $112B |
|
||
| Media / Entertainment | 2 | $69B |
|
||
Price history
-5.3% since first listed2 events — show timeline
- 2026-05-08 Price Changed $179,950 CNYIS
- 2026-04-07 Listed $189,950 CNYIS
Property tax history
+5.4%/yrLatest (2025): $7,622 · +2.7% YoY. Source: county tax records.
Cash-flow waterfall
monthlySold comps — $/sqft
last 12 mo · ≤1 miLoading sold comps…