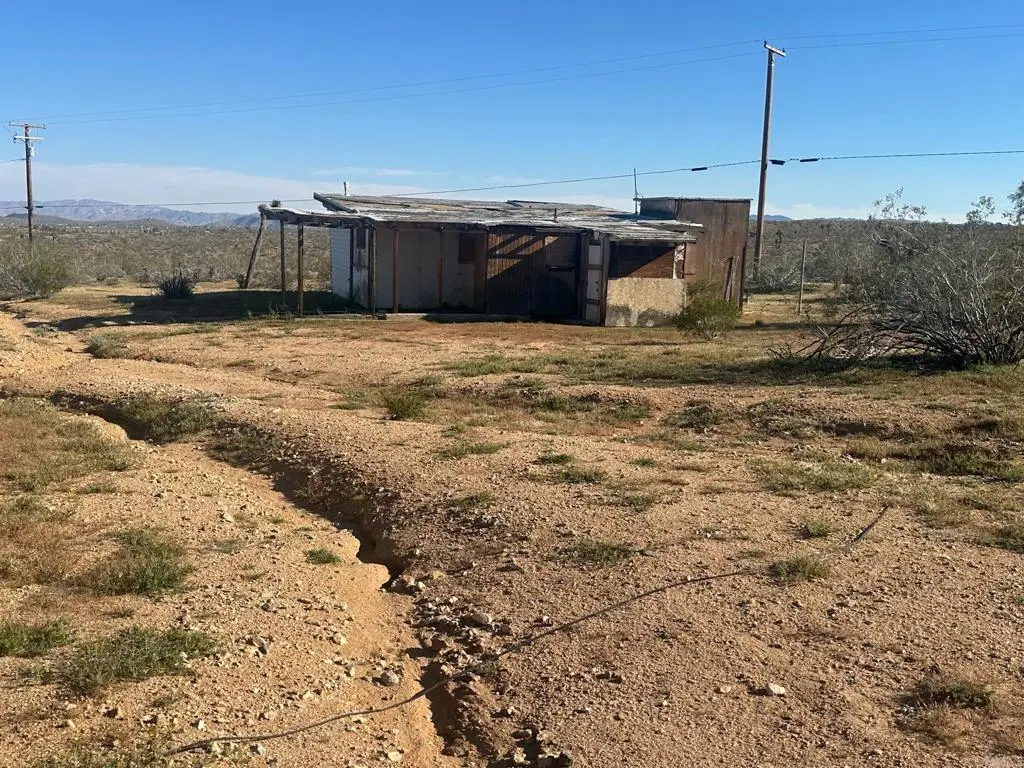
988 Old Woman Springs Rd · Homestead Valley, CA
Flood risk 1/10 · Minimal
- FEMA flood zone
- D
- Chance of flooding over 30 yrs
- 0.0%
- Est. flood insurance / yr
- $544 – $1,084
Fire risk 5/10 · Moderate
- Est. fire insurance / yr
- $659 – $1,223
Heat risk 6/10 · Moderate
- Hot days now (above 98°F)
- 9 days/yr
- Hot days in 30 yrs
- 26 days/yr
Wind risk 1/10 · Minimal
- Chance of severe wind over 30 yrs
- —
Air-quality risk 5/10 · Moderate
- Unhealthy air days now
- 7 days/yr
- Unhealthy air days in 30 yrs
- 10 days/yr
Risk factors via First Street. Map © Google.
Why this score? — see what drove the D+ grade
The composite is a weighted blend of 9 inputs, each scored 0–100. Each bar is that input's sub-score; the figure is the points it added to the 100-point composite (weight × sub-score).
- ARV discount +15.0/15.0
- Cash flow +13.3/30.0
- DSCR +4.0/10.0
- Rent growth +3.5/5.0
- 1% rule +2.7/10.0
- Livability +2.5/5.0
- Condition / age +2.5/5.0
- Schools +2.2/10.0
- Appreciation +0.0/10.0
$240,000
🖨 Deal sheet (PDF) 📄 Offer letter ✓ Due diligence
Key facts
- 5 acre lot
- Garage
- Built 1956
Property features AI
Finance
- Other: Lot size source: Public records; Living area source: Public records; Parcel number available
- Financial info: Assessments: Unknown
- HOA & community: Community contains 1 unit
Exterior
- Parking: Attached garage with space for 1 vehicle (1 total parking space)
- Security: No security information provided
- Utilities: Sewer: Other; No water source specified
- Home design: Attached property with one common wall; Single-story; Entry at front door; Zoned D; Rural, mountainous community
- Construction: Construction materials and year built not provided; Foundation and roof details not provided
- Exterior features: No pool; Desert front and desert back landscaping; Property has a view
Interior
- Kitchen: No kitchen appliance or feature details provided
- Bedrooms: Information not provided
- Flooring: No flooring information provided
- Bathrooms: Two full bathrooms
- Heating & cooling: No heating or cooling information provided
- Interior features: Front door entry; One-level living; Entry and additional details: see remarks
- Laundry & utility: No laundry facilities on site
Neighborhood map
What this means for you Summary
Snapshot
- This is a 2-bed/1.0-bath single-family listed at $240k.
Deal economics
- At list price, monthly cash flow is $-2 ($-19/yr) — negative.
- To cash-flow at today's rent, offer at most $240k (0.1% below list).
- To meet the 1% rule (rent ≥ 1% of price), the offer needs to be $185k (23.0% below list).
- Recommended offer: $185k (23.0% below list) — sets the bar for 1% rule.
- Cap rate 6.3% vs local median 3.7% in Homestead Valley — top-decile yield for the area; either an underpriced asset or a hidden risk that comps aren't pricing in. Stress-test before assuming the spread holds.
Location & tenants
- Location reads 49/100 on livability (#1,167 in CA) — a working-class tenant base; expect higher turnover. Strengths: housing A+; Watch: schools F, amenities F, commute F.
- Morongo Unified (town): math 15% / reading 38% proficiency, ranked #395 of 517 in CA (top 76%) — low school quality limits family demand, transient renter base, plan for 1-2y turnover.
- Market conditions: Rents rising fast (+4.1%/yr); 563 active listings in the ZIP; 5,458 units permitted in San Bernardino County in 2024 (1,500 in 5+ unit buildings).
- This rent runs 38% of the median local income ($58k/yr) — at the standard rent-burdened threshold; future hikes will face affordability resistance.
Forward outlook
- Local home prices are declining (-3.0%/yr); year-one equity from $2k of loan paydown is wiped out by about $7k of value loss. Plan a longer hold.
- San Bernardino County population projected at +15% by 2050 — modest demand growth; plan on rents tracking national, not racing it.
Negotiation context
- It's been on market 38 days — a 3% lower offer ($233k) is reasonable based on typical stale-listing flexibility.
- 2 sale attempts since 11y ago with the ask held roughly flat each time — persistent listings suggest the price (not the market) is what's stuck; bring a comps-based counter.
- Current owner paid $35k; list at $240k implies a 586% gain — meaningful room to come down on a strong offer.
Risks & watch-outs
- Watch-outs: built in 1956 — expect roof / HVAC / electrical / plumbing capex.
- Climate carrying-cost: moderate wildfire risk; extreme-heat days projected 9→26/yr by 2055 (HVAC capex compounding) — expect insurance premiums to compound above CPI over the hold.
Questions for the listing agent
- What do current leases actually rent for vs. the listed asking? Can we see a recent rent roll and the last 12 months of T-12 income?
- It's been on market 38 days. Have you received any prior offers? Is the seller open to a 23% concession, seller financing, or rate buy-down credit?
- Built in 1956 — when were the roof, HVAC, electrical panel, plumbing, and water heater last replaced?
- Is there a deadline driving the sale (1031 exchange, divorce, estate, relocation)? That informs how much negotiation room exists.
- Schools are F-rated, which usually means shorter tenancies and higher turnover. Who's the typical renter profile here, and what's been the actual vacancy rate?
- The area grade is low — what's the realistic commute time and amenity access for the typical tenant pool here? Any planned neighborhood developments (good or bad) we should know about?
- What's the average days-on-market for RENTAL listings here right now (not sales)? A rising rental-DOM trend means longer vacancies and softer asking-rent achievability than the comps imply.
- What's the recent tenant-quality profile in this submarket — average credit score on applications, eviction rate, late-payment / NSF rate, and stable-employment percentage? A property-management company in the area should have these aggregated.
- How much new for-sale + rental construction is in the pipeline within 1–3 miles? Heavy new supply typically softens prices + rents 12–24 months out; constrained supply supports both.
Investment metrics
- 1% rule
- 0.77% ✗
- Cap rate
- 6.29%
- Cash-on-cash
- -0.03%
- DSCR
- 1.00
- GRM
- 10.8
CMA / ARV
- ARV (median comp)
- $453,879
- List price
- $240,000
- Delta
- -47.12%
- Verdict
- UNDERPRICED
- Comps
- 4 within 1.0 mi
Projected returns pro-forma
-3.0% appreciation · 4.12% rent growth · sell at horizon
- IRR
- -15.3%
- Equity multiple
- 0.45×
- Total profit
- $-36,978
- Equity at exit
- $35,785
- IRR
- -5.2%
- Equity multiple
- 0.64×
- Total profit
- $-23,867
- Equity at exit
- $20,751
Cash invested: $67,200 (down + closing). Projections, not guarantees.
Landlord ↔ Tenant lean methodology
- Overall (STATE)
- 18 Strongly Tenant-Friendly
- State California
- 18 Strongly Tenant-Friendly · D+13
- County
- — inherits STATE
- City
- — inherits STATE
ZIP-level market 92284
- Home prices YoY
- -33.1%
- Rents YoY
- 4.1%
- Active inventory
- 563
- Price-to-rent
- 10.8×
Monthly cashflow live
- Estimated rent
- $1,848 medium interval (Pro) →
- Mortgage (P&I)
- −$1,259
- Tax from tax record
- −$103 /mo · $1,236/yr
- Insurance
- −$100
- HOA
- −$0
- Vacancy / Maint / Mgmt
- −$388
- Net cashflow
- $-2
Break-even live
Sensitivity live
| Price | -10% $134 | -5% $66 | +0% $-2 | +5% $-69 | +10% $-137 |
|---|---|---|---|---|---|
| Rent | -10% $-148 | -5% $-75 | +0% $-2 | +5% $71 | +10% $144 |
| Rate | -1.0pp $119 | -0.5pp $59 | base $-2 | +0.5pp $-64 | +1.0pp $-127 |
UW: 25.0% down · 7.5% · 30yr · 1.5% tax · 5.0% vac · 8.0% maint · 8.0% mgmt
Financing live
Cash to close
- Down payment
- $60,000
- Closing costs
- $7,200
- Reserves months
- —
- Total cash needed
- —
Loan-product check · same deal, 3 products live
Conventional
25% down · 7.5% · 30yr
- Down + closing
- —
- Monthly P&I
- —
- Monthly cashflow
- —
- DSCR
- —
- Eligible?
- —
Personal DTI + credit; lowest rate.
DSCR
20% down · 8.5% · 30yr
- Down + closing
- —
- Monthly P&I
- —
- Monthly cashflow
- —
- DSCR
- —
- Eligible?
- —
No personal income docs; deal must DSCR.
Hard money
10% down · 12.0% · 12mo
- Down + closing
- —
- Monthly P&I
- —
- Monthly cashflow
- —
- DSCR
- —
- Eligible?
- —
Short-term bridge; refi at stabilization.
Listing history 18 events
-
2026-06-18days on market $240,000 Active 38 DOM
-
2026-06-17days on market $240,000 Active 37 DOM
-
2026-06-16days on market $240,000 Active 36 DOM
-
2026-06-15days on market $240,000 Active 35 DOM
-
2026-06-13days on market $240,000 Active 33 DOM
-
2026-06-13days on market $240,000 Active 32 DOM
-
2026-06-09days on market $240,000 Active 29 DOM
-
2026-06-08days on market $240,000 Active 28 DOM
-
2026-06-07days on market $240,000 Active 27 DOM
-
2026-06-04days on market $240,000 Active 24 DOM
-
2026-06-03days on market $240,000 Active 23 DOM
-
2026-06-02days on market $240,000 Active 22 DOM
-
2026-06-01days on market $240,000 Active 21 DOM
-
2026-05-31days on market $240,000 Active 20 DOM
-
2026-05-11$240,000 Active 100-char remark
-
2016-10-30historical
-
2015-10-19$109,900 Active
-
1984-03-05soldstatus $35,000
ⓘ Source: listings_history table (triggers on properties + properties_extension) + one-shot
backfill from property_details.listing_events for pre-trigger history.
Tax reassessment forecast CA · Resets to sale price
- Current annual tax
- $1,236 · $103/mo
- Projected year-2 tax
- $1,824 · $152/mo
- Expected delta
- +$588/yr (+$49/mo · 47.6%)
ⓘ Screening estimate from a state-policy table — verify with the county assessor before closing.
Climate risk First Street
- Flood 1/10 Low FEMA zone D · 0% chance over 30 yrs
- Wildfire 5/10 Major
- Heat 6/10 Major 9 d/yr ≥98°F today · 26 d/yr by 30 yrs out
- Wind 1/10 Low
- Air quality 5/10 Major 7 unhealthy d/yr today · 10 by 30 yrs out
Nearby sold comps map
Loading sold comps map…
Walkable amenities ~0.75 mi
Loading nearby amenities…
Taxation est. · year 1
- Rental income
- $22,177
- − Mortgage interest
- −$13,444
- − Property taxes
- −$1,236
- − Insurance
- −$1,200
- − Repairs & maintenance
- −$1,774
- − Management
- −$1,774
- − Depreciation
- −$6,982
- Taxable loss
- −$4,233
- Est. tax savings @ 24.0%
- +$1,016
- After-tax cash flow
- $997/yr
For passive investors: Depreciation is non-cash, so a rental often shows a tax loss while cash-flowing — sheltering income. Rental losses are passive: they offset passive income freely, and up to $25,000/yr can offset ordinary (W-2) income if you actively participate and your MAGI is under $100k (phasing out to $0 by $150k); unused losses carry forward. On sale, claimed depreciation is recaptured at up to 25%, and gains may owe capital-gains tax (a 1031 exchange can defer both). Figures are a year-1 estimate at your 24.0% rate — not tax advice; consult a CPA.
Schools (NCES district)
- District
- Morongo Unified
- NCES district ID
- 0625860
- Math proficiency
- 15% ▼ -12.00%
- Reading proficiency
- 38% ▼ -3.00%
- Median HH income
- $39,399
- Composite
- 22.19/100
- National rank
- #8156
- State rank
- #395 of 517 in CA
Livability — Homestead Valley
- Score
- 49/100
- State rank
- #1167
- US rank
- #25885
Category grades
Schools grade is shown separately in the Schools card above.
Census & demographics
- Census place
- Homestead Valley, CA
- County
- San Bernardino County · 2,030,291 people
- Metro
- Riverside-San Bernardino-Ontario, CA
- Population (ZIP)
- 25,415
- Household income
- $58,373
- Rent vs Own
- Severe rent burden
- 1132.0
Population outlook (San Bernardino County) Hauer SSP2
- Today (2025)
- 2,300,329 people
- By 2030
- 2,378,907 · +3.4%
- By 2040
- 2,523,137 · +9.7%
- By 2050
- 2,642,388 · +14.9%
- By 2075
- 2,880,769 · +25.2%
- By 2100
- 2,909,436 · +26.5%
Race, ethnicity, and origin ACS 2023
- Neighborhood character
- Diverse neighborhood (Simpson 0.55)
- Race & ethnicity
- White 62% Hispanic / Latino 25% Two or more races 18% Black 2% Native American 2% Asian 2% Pacific Islander 1%
- Hispanic origin (detail)
- Mexican 20%
- Common ancestry
- Italian 4% Romanian 2% Slovak 2%
- Foreign-born
- 9% · Canada
- Languages at home
- 82% English-only · Spanish 14% Other Indo-European 1% Other Asian/Pacific 1%
Political lean MEDSL · San Bernardino
- 2024 margin
- Toss-up / Even · D 47.5% · R 49.7% · Other 2.8%
- 2008→2024 swing
- -8.5pp toward R · 2008: 6.3pp · 2024: -2.1pp
- All cycles
- 2024: R+2.1 2020: D+10.7 2016: D+9.8 2012: D+5.4 2008: D+6.3
Not yet ingested
- Civics
- —
Market trends
- HPI YoY
- ▼ -241.13%
- Current HPI
- 486.7185
- Rent YoY
- ▲ 4.12%
- Metro
- Riverside-San Bernardino-Ontario, CA
- State GDP YoY
- ▲ 3.21%
- F500 in state
- 116
Industry mix (Fortune 500 HQ in CA)
| Industry | F500 HQs | Revenue |
|---|---|---|
| Technology | 27 | $1,492B |
|
||
| Financial Services | 3 | $174B |
|
||
| Retail | 3 | $44B |
|
||
| Insurance | 3 | $26B |
|
||
| Media / Entertainment | 2 | $115B |
|
||
| Pharmaceuticals / Biotech | 2 | $62B |
|
||
Price history
+585.7% since first listed4 events — show timeline
- 2026-05-11 Listed $240,000 CRMLS
- 2016-10-30 Listing Removed — CRMLS
- 2015-10-19 Listed $109,900 CRMLS
- 1984-03-05 Sold (Public Records) $35,000 Public Records
Property tax history
+6.0%/yrLatest (2025): $1,236 · +8.6% YoY. Source: county tax records.
Cash-flow waterfall
monthlySold comps — $/sqft
last 12 mo · ≤1 miLoading sold comps…