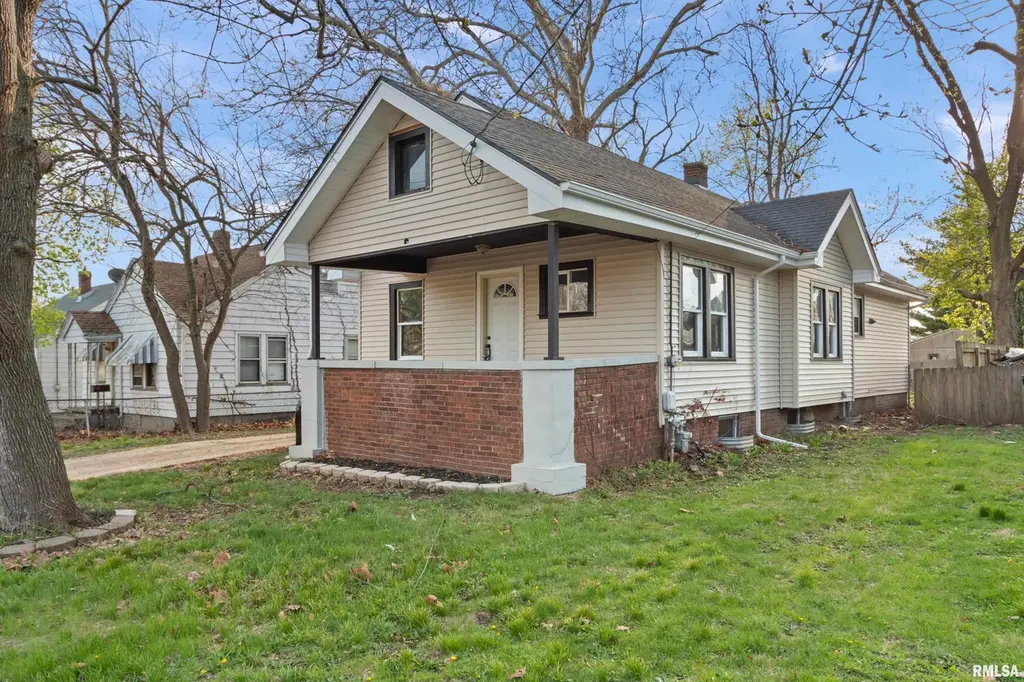
2811 N Wisconsin Ave · Peoria, IL
Flood risk 1/10 · Minimal
- FEMA flood zone
- X
- Chance of flooding over 30 yrs
- 0.0%
- Est. flood insurance / yr
- $473 – $860
Fire risk 1/10 · Minimal
- Est. fire insurance / yr
- $804 – $1,492
Heat risk 3/10 · Minor
- Hot days now (above 105°F)
- 7 days/yr
- Hot days in 30 yrs
- 18 days/yr
Wind risk 2/10 · Minimal
- Chance of severe wind over 30 yrs
- 1.0%
Air-quality risk 3/10 · Minor
- Unhealthy air days now
- 1 days/yr
- Unhealthy air days in 30 yrs
- 3 days/yr
Risk factors via First Street. Map © Google.
Why this score? — see what drove the C grade
The composite is a weighted blend of 9 inputs, each scored 0–100. Each bar is that input's sub-score; the figure is the points it added to the 100-point composite (weight × sub-score).
- Cash flow +23.8/30.0
- DSCR +7.7/10.0
- ARV discount +7.5/15.0
- 1% rule +5.5/10.0
- Livability +3.7/5.0
- Rent growth +3.4/5.0
- Condition / age +2.5/5.0
- Schools +1.1/10.0
- Appreciation +0.0/10.0
$99,900
🖨 Deal sheet (PDF) 📄 Offer letter ✓ Due diligence
Listing remarks
Fresh, stylish, and completely move-in ready—welcome to 2811 N Wisconsin in Peoria! This beautifully renovated 3-bedroom, 1-bath home offers 892 square feet of thoughtfully updated living space, perfect for easy, modern living. Step inside to find durable and sleek LVT flooring flowing seamlessly throughout, complemented by fresh paint and updated light fixtures that give the entire home a bright, contemporary feel. The kitchen shines with updated appliances and a clean, functional layout designed for everyday convenience. Each bedroom offers comfortable space and versatility, whether for sleeping, working from home, or creating your own personal retreat. Located just minutes from Peo
Key facts
- 5,662 sq ft lot
- Parking
- Built 1925
Property features AI
Finance
- HOA & community: No association fee
Exterior
- Parking: Gravel parking (no garage)
- Utilities: Public water; Public sewer
- Home design: Single family residence; Residential zoning; Built in 1925; Full unfinished basement; One story with additional/upper and lower levels
- Construction: Shingle roof; 1925 construction
- Exterior features: Level lot; Paved road access; Shingle roof
Interior
- Kitchen: Refrigerator included
- Bedrooms: 3 bedrooms (Main, Upper, Lower; primary bedrooms on Main) ; Egress windows in bedrooms; Bedroom dimensions include examples: 12×10, 11×11, 11×10
- Flooring: Luxury vinyl plank flooring in main living areas and bedrooms; Other flooring in basement/laundry
- Bathrooms: 1 full bathroom
- Heating & cooling: Forced air heating; Gas water heater; Central air conditioning
- Interior features: Attic storage; Cable available; Ceiling fan(s)
- Laundry & utility: Basement laundry area
Neighborhood map
What this means for you Summary
Snapshot
- This is a 2-bed/1.0-bath single-family listed at $100k.
Deal economics
- At list price, monthly cash flow is $193 ($2k/yr) — positive.
- The deal already cash-flows at list — no discount required.
- Meets the 1% rule at list price ($1k rent vs $100k).
- Recommended offer: $98k (1.5% below list) — sets the bar for market timing.
- Cap rate 8.6% vs local median 5.6% in Peoria — top-decile yield for the area; either an underpriced asset or a hidden risk that comps aren't pricing in. Stress-test before assuming the spread holds.
Location & tenants
- Location reads 73/100 on livability (#270 in IL) — a middle-class / working-renter tenant base. Strengths: commute A+, cost of living A+, housing A+; Watch: employment D+, crime F.
- Peoria SD 150 (urban): math 11% / reading 14% proficiency, ranked #554 of 620 in IL (top 89%) — low school quality limits family demand, transient renter base, plan for 1-2y turnover; 70% free/reduced lunch — lower-income household profile, screen leases tightly.
- Zoned schools: Peoria High School (math 4% / reading 7%, grade F, #609 of 693 statewide, top 88%, 1,447 students, 0% FRL) — zoned schools average 0% FRL vs 70% district-wide (70 pts lower); this property's tenant base skews higher-income than the district average.
- Market conditions: Rents rising (+3.5%/yr); 104 active listings in the ZIP; 20 comparable units currently listed for rent nearby; rentals at typical pace (median 14d on market — plan ~3-4 weeks tenant-placement turnaround); lower-income renter base — watch delinquency; 73 units permitted in Peoria County in 2024 (0 in 5+ unit buildings).
- This rent runs 30% of the median local income ($42k/yr) — at the standard rent-burdened threshold; future hikes will face affordability resistance.
Forward outlook
- Local home prices are declining (-3.0%/yr); year-one equity from $691 of loan paydown is wiped out by about $3k of value loss. Plan a longer hold.
- Peoria County population projected at -11% by 2050 — secular population decline; favor cash flow + early exit over multi-decade hold.
Negotiation context
- It's been on market 17 days — a 2% lower offer ($98k) is reasonable based on typical stale-listing flexibility.
- Current owner paid $79k; 26% above their basis — modest negotiation headroom, anchor on the comps not their cost.
Risks & watch-outs
- Watch-outs: built in 1925 — expect roof / HVAC / electrical / plumbing capex.
Questions for the listing agent
- Built in 1925 — when were the roof, HVAC, electrical panel, plumbing, and water heater last replaced?
- Is there a deadline driving the sale (1031 exchange, divorce, estate, relocation)? That informs how much negotiation room exists.
- Schools are F-rated, which usually means shorter tenancies and higher turnover. Who's the typical renter profile here, and what's been the actual vacancy rate?
- Crime grade is F in this area — have there been break-ins, vandalism, or insurance claims at this property in the last 3 years? What carrier currently insures it and at what premium?
- What's the average days-on-market for RENTAL listings here right now (not sales)? A rising rental-DOM trend means longer vacancies and softer asking-rent achievability than the comps imply.
- What's the recent tenant-quality profile in this submarket — average credit score on applications, eviction rate, late-payment / NSF rate, and stable-employment percentage? A property-management company in the area should have these aggregated.
- How much new for-sale + rental construction is in the pipeline within 1–3 miles? Heavy new supply typically softens prices + rents 12–24 months out; constrained supply supports both.
Investment metrics
- 1% rule
- 1.05% ✓
- Cap rate
- 8.61%
- Cash-on-cash
- 8.26%
- DSCR
- 1.37
- GRM
- 8.0
CMA / ARV
- ARV (on-the-fly)
- $62,440
- Comps found
- 12
Show comp detail 12 sales within ~0.75 mi
| Address | Dist | Beds/Ba | Sqft | Sold | Price | $/sf | Match |
|---|---|---|---|---|---|---|---|
| 2710 N California Ave | 0.23mi | 2/1.0 | 908 (+2%) | 1mo | $35,100 | $39 | 86 |
| 2809 N California Ave | 0.25mi | 1/1.0 (-1) | 856 (-4%) | 3mo | $25,000 | $29 | 74 |
| 924 E Maywood Ave | 0.18mi | 2/1.0 | 1,000 (+12%) | 3mo | $70,000 | $70 | 69 |
| 511 E Pasadena Ave | 0.44mi | 2/1.0 | 840 (-6%) | 6mo | $83,000 | $99 | 64 |
| 716 E Kansas St | 0.73mi | 2/1.0 | 896 (+0%) | 2mo | $26,666 | $30 | 64 |
| 412 E Republic St | 0.62mi | 2/1.0 | 925 (+4%) | 1mo | $26,200 | $28 | 64 |
| 1317 E Elmhurst Ave | 0.64mi | 2/1.0 | 918 (+3%) | 2mo | $44,000 | $48 | 64 |
| 2804 N Peoria Ave | 0.35mi | 2/1.0 | 768 (-14%) | 3mo | $60,000 | $78 | 58 |
| 603 E Thrush Ave | 0.51mi | 3/1.0 (+1) | 960 (+8%) | 3mo | $30,000 | $31 | 56 |
| 3120 N Linnhill Ct | 0.65mi | 2/1.0 | 962 (+8%) | 0mo | $139,900 | $145 | 56 |
| 1002 E Willcox Ave | 0.21mi | 3/2.0 (+1) | 1,023 (+15%) | 1mo | $89,000 | $87 | 56 |
| 112 E Gift Ave | 0.46mi | 3/2.0 (+1) | 971 (+9%) | 2mo | $90,000 | $93 | 53 |
Match score weights: distance 35% · size 25% · config 20% · recency 20%. Top-matched comps best support the ARV.
Projected returns pro-forma
-3.0% appreciation · 3.49% rent growth · sell at horizon
- IRR
- -3.2%
- Equity multiple
- 0.88×
- Total profit
- $-3,428
- Equity at exit
- $14,895
- IRR
- 6.9%
- Equity multiple
- 1.53×
- Total profit
- $14,875
- Equity at exit
- $8,638
Cash invested: $27,972 (down + closing). Projections, not guarantees.
Landlord ↔ Tenant lean methodology
- Overall (STATE)
- 43 Moderately Tenant-Leaning
- State Illinois
- 43 Moderately Tenant-Leaning · D+7
- County
- — inherits STATE
- City
- — inherits STATE
ZIP-level market 61603
- Home prices YoY
- -31.8%
- Rents YoY
- 3.5%
- Active inventory
- 104
- Price-to-rent
- 8.0×
Monthly cashflow live
- Estimated rent
- $1,046 high interval (Pro) →
- Mortgage (P&I)
- −$524
- Tax from tax record
- −$69 /mo · $822/yr
- Insurance
- −$42
- HOA
- −$0
- Vacancy / Maint / Mgmt
- −$220
- Net cashflow
- $193
Break-even live
Sensitivity live
| Price | -10% $249 | -5% $221 | +0% $193 | +5% $164 | +10% $136 |
|---|---|---|---|---|---|
| Rent | -10% $110 | -5% $151 | +0% $193 | +5% $234 | +10% $275 |
| Rate | -1.0pp $243 | -0.5pp $218 | base $193 | +0.5pp $167 | +1.0pp $140 |
UW: 25.0% down · 7.5% · 30yr · 1.5% tax · 5.0% vac · 8.0% maint · 8.0% mgmt
Financing live
Cash to close
- Down payment
- $24,975
- Closing costs
- $2,997
- Reserves months
- —
- Total cash needed
- —
Loan-product check · same deal, 3 products live
Conventional
25% down · 7.5% · 30yr
- Down + closing
- —
- Monthly P&I
- —
- Monthly cashflow
- —
- DSCR
- —
- Eligible?
- —
Personal DTI + credit; lowest rate.
DSCR
20% down · 8.5% · 30yr
- Down + closing
- —
- Monthly P&I
- —
- Monthly cashflow
- —
- DSCR
- —
- Eligible?
- —
No personal income docs; deal must DSCR.
Hard money
10% down · 12.0% · 12mo
- Down + closing
- —
- Monthly P&I
- —
- Monthly cashflow
- —
- DSCR
- —
- Eligible?
- —
Short-term bridge; refi at stabilization.
Rent comps 20 comps
| Address | Beds | Baths | Sqft | Rent | $/sqft | DOM | Units | Dist |
|---|---|---|---|---|---|---|---|---|
| 737 E Gift Ave Unit 737 Peoria, IL | 2.0 | 1.0 | 800 | $1,125 | $1.41 | 44d | 1 | 0.17mi |
| 2121 N Prospect Rd Peoria, IL | 3.0 | 1.0 | 946 | $802 | $0.85 | 14d | 1 | 0.69mi |
| 3912 N Atlantic Ave Peoria Heights, IL | 2.0 | 1.0 | 825 | $1,100 | $1.33 | 44d | 1 | 0.98mi |
| 2207 N Ellis St Peoria, IL | 2.0 | 1.0 | 864 | $999 | $1.16 | 14d | 1 | 1.10mi |
| 812 W Macqueen Ave Peoria, IL | 2.0 | 1.0 | 822 | $795 | $0.97 | 44d | 1 | 1.20mi |
| 2302 NE Monroe St Peoria, IL | 3.0 | 1.0 | 1100 | $875 | $0.80 | 14d | 1 | 1.20mi |
| 811 E Lake Ave Peoria Heights, IL | 2.0 | 1.0 | 576 | $875 | $1.52 | 14d | 1 | 1.21mi |
| 901 NE Glen Oak Ave Unit 2 Peoria, IL | 3.0 | 1.0 | 1120 | $1,200 | $1.07 | 21d | 1 | 1.22mi |
| 1505 N Peoria Ave Peoria, IL | 1.0 | 1.0 | 525 | $1,006 | $1.92 | 14d | 4 | 1.22mi |
| 126 E Lake Ave Peoria, IL | 2.0 | 1.0 | 950 | $1,050 | $1.11 | 14d | 9 | 1.26mi |
| 506 Caroline St Unit B Peoria, IL | 2.0 | 1.0 | 1000 | $900 | $0.90 | 14d | 1 | 1.26mi |
| 813 E Sciota Ave Peoria Heights, IL | 2.0 | 2.0 | 800 | $1,400 | $1.75 | 14d | 1 | 1.28mi |
| 905 W Thrush Ave Peoria, IL | 2.0 | 1.0 | 750 | $950 | $1.27 | 21d | 1 | 1.29mi |
| 228 E Oak Cliff Ct Unit A2 Peoria, IL | 2.0 | 1.0 | 1000 | $1,050 | $1.05 | 14d | 1 | 1.30mi |
| 903 W Brons Ave Peoria, IL | 3.0 | 1.0 | 971 | $995 | $1.02 | 44d | 1 | 1.31mi |
| 3108 N Parish Ave Peoria, IL | 3.0 | 1.5 | 967 | $1,750 | $1.81 | 44d | 1 | 1.35mi |
| 249 E Oak Cliff Ct Unit 4 Peoria, IL | 2.0 | 1.0 | 600 | $800 | $1.33 | 14d | 1 | 1.39mi |
| W Crestwood Dr Peoria, IL | 1.0–2.0 | 1.0 | 800 | $975 | $1.22 | 14d | 4 | 1.43mi |
| 2214 N Linsley St Peoria, IL | 2.0 | 1.0 | 575 | $550 | $0.96 | 44d | 1 | 1.44mi |
| 811 W Purtscher Dr Peoria, IL | 3.0 | 1.0 | 864 | $1,100 | $1.27 | 44d | 1 | 1.49mi |
Listing history 3 events
-
2026-04-30status Pending
-
2026-04-13$99,900 Active
-
2006-08-03soldstatus $79,000
ⓘ Source: listings_history table (triggers on properties + properties_extension) + one-shot
backfill from property_details.listing_events for pre-trigger history.
Tax reassessment forecast IL · Partial reset (capped growth)
- Current annual tax
- $822 · $69/mo
- Projected year-2 tax
- $1,545 · $129/mo
- Expected delta
- +$723/yr (+$60/mo · 87.9%)
ⓘ Screening estimate from a state-policy table — verify with the county assessor before closing.
Climate risk First Street
- Flood 1/10 Low FEMA zone X · 0% chance over 30 yrs
- Wildfire 1/10 Low
- Heat 3/10 Moderate 7 d/yr ≥105°F today · 18 d/yr by 30 yrs out
- Wind 2/10 Low 100% chance of damaging wind over 30 yrs
- Air quality 3/10 Moderate 1 unhealthy d/yr today · 3 by 30 yrs out
Nearby sold comps map
Loading sold comps map…
Walkable amenities ~0.75 mi
Loading nearby amenities…
Taxation est. · year 1
- Rental income
- $12,555
- − Mortgage interest
- −$5,596
- − Property taxes
- −$822
- − Insurance
- −$500
- − Repairs & maintenance
- −$1,004
- − Management
- −$1,004
- − Depreciation
- −$2,906
- Taxable income
- $722
- Est. tax owed @ 24.0%
- −$173
- After-tax cash flow
- $2,137/yr
For passive investors: Depreciation is non-cash, so a rental often shows a tax loss while cash-flowing — sheltering income. Rental losses are passive: they offset passive income freely, and up to $25,000/yr can offset ordinary (W-2) income if you actively participate and your MAGI is under $100k (phasing out to $0 by $150k); unused losses carry forward. On sale, claimed depreciation is recaptured at up to 25%, and gains may owe capital-gains tax (a 1031 exchange can defer both). Figures are a year-1 estimate at your 24.0% rate — not tax advice; consult a CPA.
Schools (NCES district)
- District
- Peoria SD 150
- NCES district ID
- 1731230
- Math proficiency
- 11% ▼ -5.00%
- Reading proficiency
- 14% ▼ -4.00%
- Median HH income
- $41,951
- Composite
- 10.92/100
- National rank
- #9751
- State rank
- #554 of 620 in IL
Livability — Peoria
- Score
- 73/100
- State rank
- #270
- US rank
- #5096
Category grades
Schools grade is shown separately in the Schools card above.
Census & demographics
- Census place
- Peoria, IL
- County
- Peoria County · 120,495 people
- City population
- 114,670
- Metro
- Peoria, IL
- Population (ZIP)
- 15,356
- Household income
- $41,618
- Rent vs Own
- Severe rent burden
- 849.0
Population outlook (Peoria County) Hauer SSP2
- Today (2025)
- 183,007 people
- By 2030
- 179,643 · -1.8%
- By 2040
- 171,782 · -6.1%
- By 2050
- 163,508 · -10.7%
- By 2075
- 140,178 · -23.4%
- By 2100
- 114,493 · -37.4%
Race, ethnicity, and origin ACS 2023
- Neighborhood character
- Diverse neighborhood (Simpson 0.68)
- Race & ethnicity
- Black 43% White 36% Two or more races 12% Hispanic / Latino 10% Asian 1%
- Hispanic origin (detail)
- Mexican 7%
- Common ancestry
- Italian 2% Slovak 1% Lithuanian 1%
- Foreign-born
- 7% · Canada
- Languages at home
- 91% English-only · Spanish 6% Tagalog/Filipino 1%
Political lean MEDSL · Peoria
- 2024 margin
- Toss-up / Even · D 51.5% · R 46.9% · Other 1.6%
- 2008→2024 swing
- -9.2pp toward R · 2008: 13.9pp · 2024: 4.7pp
- All cycles
- 2024: D+4.7 2020: D+6.3 2016: D+2.8 2012: D+4.4 2008: D+13.9
Not yet ingested
- Civics
- —
Market trends
- HPI YoY
- ▼ -65.98%
- Current HPI
- 141.5343
- Rent YoY
- ▲ 3.49%
- Metro
- Peoria, IL
- State GDP YoY
- ▲ 1.59%
- F500 in state
- 60
Industry mix (Fortune 500 HQ in IL)
| Industry | F500 HQs | Revenue |
|---|---|---|
| Insurance | 4 | $201B |
|
||
| Consumer Goods | 4 | $87B |
|
||
| Industrial Machinery | 3 | $64B |
|
||
| Healthcare | 2 | $55B |
|
||
| Retail / Pharmacy | 1 | $148B |
|
||
| Agriculture / Food | 1 | $86B |
|
||
Price history
+26.5% since first listed3 events — show timeline
- 2026-04-30 Pending — RMLSA as Distributed by MLS Grid
- 2026-04-13 Listed $99,900 RMLSA as Distributed by MLS Grid
- 2006-08-03 Sold (Public Records) $79,000 Public Records
Property tax history
-5.6%/yrLatest (2024): $822 · +4.8% YoY. Source: county tax records.
Cash-flow waterfall
monthlySold comps — $/sqft
last 12 mo · ≤1 miLoading sold comps…