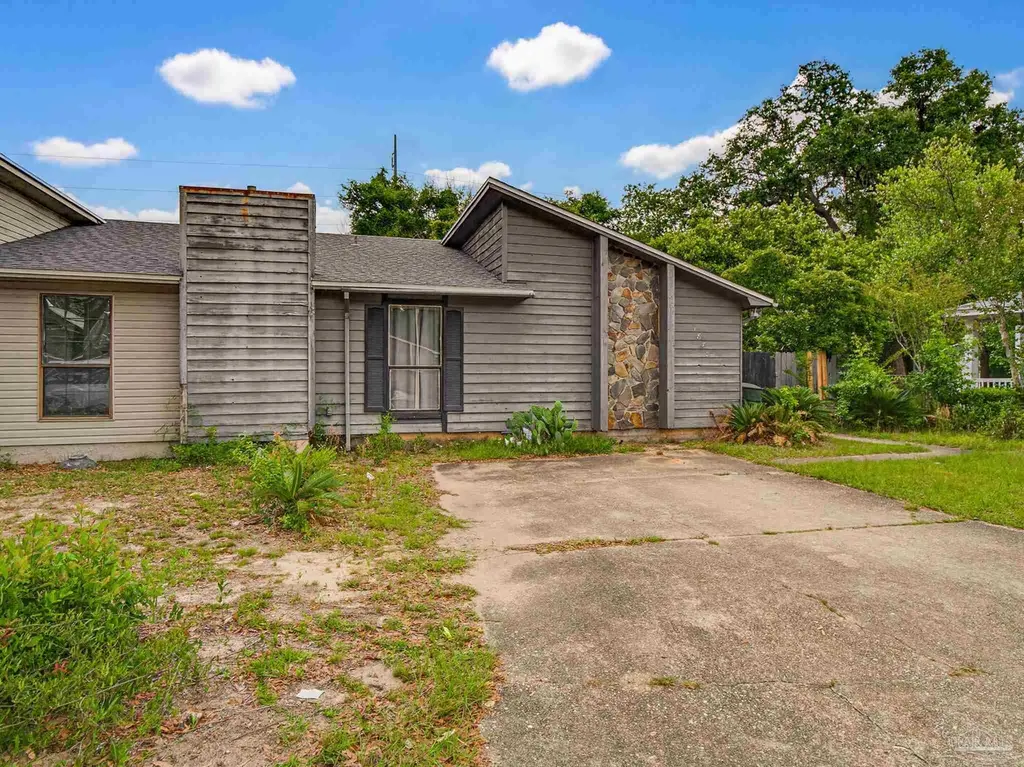
1838 San Dollar Cir · Ferry Pass, FL
Flood risk 1/10 · Minimal
- FEMA flood zone
- X (unshaded)
- Chance of flooding over 30 yrs
- 0.0%
- Est. flood insurance / yr
- $507 – $1,088
Fire risk 1/10 · Minimal
- Est. fire insurance / yr
- $947 – $1,759
Heat risk 10/10 · Severe
- Hot days now (above 106°F)
- 7 days/yr
- Hot days in 30 yrs
- 22 days/yr
Wind risk 9/10 · Severe
- Chance of severe wind over 30 yrs
- 99.0%
Air-quality risk 1/10 · Minimal
- Unhealthy air days now
- 0 days/yr
- Unhealthy air days in 30 yrs
- 0 days/yr
Risk factors via First Street. Map © Google.
Why this score? — see what drove the B+ grade
The composite is a weighted blend of 9 inputs, each scored 0–100. Each bar is that input's sub-score; the figure is the points it added to the 100-point composite (weight × sub-score).
- Cash flow +30.0/30.0
- ARV discount +15.0/15.0
- DSCR +10.0/10.0
- 1% rule +8.8/10.0
- Schools +3.6/10.0
- Rent growth +3.4/5.0
- Livability +3.2/5.0
- Condition / age +2.5/5.0
- Appreciation +0.0/10.0
$115,000
🖨 Deal sheet (PDF) 📄 Offer letter ✓ Due diligence
Listing remarks MLS
2br/1.5ba attached single family residence awaits. This home has over 1,400 sqft of living space with generous room sizes. The kitchen has a center island, electric stove and dishwasher. Priced to sell, this home won't last long!
Key facts
- Centrally located
- Open living area
- Private gated entry
Tags
Property features AI
Finance
- Other: County-maintained road; Green features: insulated walls, ridge vent; Has fireplace
- HOA & community: No association
Exterior
- Parking: 2 spaces per unit; Driveway; Open parking
- Utilities: Public water; Public sewer; Circuit breaker electrical
- Home design: Attached property; One-story; Resale
- Construction: Frame construction; Slab foundation
- Exterior features: Back yard fencing; Located on a cul-de-sac; Shingle roof
Interior
- Kitchen: Laminate counters
- Bedrooms: Master bedroom on the first floor (approx. 13 x 15); Second bedroom on the first floor (approx. 11 x 12)
- Flooring: Tile; Vinyl
- Bathrooms: 1 full bathroom; 1 half bathroom
- Heating & cooling: Central heating; Fireplace(s) (heating); Central air; Ceiling fan(s)
- Interior features: Bonus room; Living/dining combo
- Laundry & utility: Electric water heater
Neighborhood map
What this means for you Summary
Snapshot
- This is a 2-bed/2.0-bath townhouse listed at $115k.
Deal economics
- At list price, monthly cash flow is $562 ($7k/yr) — positive.
- The deal already cash-flows at list — no discount required.
- Meets the 1% rule at list price ($2k rent vs $115k).
- Cap rate 12.2% vs local median 4.4% in Ferry Pass — top-decile yield for the area; either an underpriced asset or a hidden risk that comps aren't pricing in. Stress-test before assuming the spread holds.
Location & tenants
- Location reads 65/100 on livability (#664 in FL) — a middle-class / working-renter tenant base. Strengths: cost of living A+, housing A+; Watch: employment C-, schools D, amenities F.
- Escambia (suburban): math 40% / reading 45% proficiency, ranked #56 of 73 in FL (top 77%) — families likely to look elsewhere, expect single-tenant / working-renter base with shorter leases.
- Market conditions: Rents rising (+3.6%/yr); 173 active listings in the ZIP; 23 comparable units currently listed for rent nearby; rentals at typical pace (median 15d on market — plan ~3-4 weeks tenant-placement turnaround); 1,479 units permitted in Escambia County in 2024 (0 in 5+ unit buildings).
Forward outlook
- Local home prices are declining (-3.0%/yr); year-one equity from $795 of loan paydown is wiped out by about $3k of value loss. Plan a longer hold.
- Escambia County population projected at +13% by 2050 — modest demand growth; plan on rents tracking national, not racing it.
- At projected returns (-3.0% appreciation + 3.6% rent growth), your $32k cash investment doubles in ~6 years — after that, you're playing with house money.
Negotiation context
- Only 3 days on market — expect competitive offers; lowballing is unlikely to land.
- 4 sale attempts since 26y ago with the ask held roughly flat each time — persistent listings suggest the price (not the market) is what's stuck; bring a comps-based counter.
- Current owner paid $34k; list at $115k implies a 243% gain — meaningful room to come down on a strong offer.
Risks & watch-outs
- Climate carrying-cost: severe wind risk, 99% chance of damaging wind over 30y; extreme-heat days projected 7→22/yr by 2055 (HVAC capex compounding) — expect insurance premiums to compound above CPI over the hold.
Questions for the listing agent
- Is there a deadline driving the sale (1031 exchange, divorce, estate, relocation)? That informs how much negotiation room exists.
- Schools are D-rated, which usually means shorter tenancies and higher turnover. Who's the typical renter profile here, and what's been the actual vacancy rate?
- What's the average days-on-market for RENTAL listings here right now (not sales)? A rising rental-DOM trend means longer vacancies and softer asking-rent achievability than the comps imply.
- What's the recent tenant-quality profile in this submarket — average credit score on applications, eviction rate, late-payment / NSF rate, and stable-employment percentage? A property-management company in the area should have these aggregated.
- How much new for-sale + rental construction is in the pipeline within 1–3 miles? Heavy new supply typically softens prices + rents 12–24 months out; constrained supply supports both.
Investment metrics
- 1% rule
- 1.38% ✓
- Cap rate
- 12.16%
- Cash-on-cash
- 20.95%
- DSCR
- 1.93
- GRM
- 6.0
CMA / ARV
- ARV (on-the-fly)
- $217,440
- Comps found
- 12
Show comp detail 12 sales within ~0.75 mi
| Address | Dist | Beds/Ba | Sqft | Sold | Price | $/sf | Match |
|---|---|---|---|---|---|---|---|
| 1951 Creighton Rd | 0.08mi | 3/1.5 (+1) | 1,330 (-8%) | 6mo | $166,000 | $125 | 72 |
| 7174 Village Ln | 0.35mi | 3/2.5 (+1) | 1,537 (+7%) | 1mo | $232,000 | $151 | 65 |
| 7139 Village Ln | 0.34mi | 3/2.5 (+1) | 1,537 (+7%) | 4mo | $224,900 | $146 | 62 |
| 7131 Village Ln | 0.34mi | 3/2.5 (+1) | 1,537 (+7%) | 4mo | $227,900 | $148 | 62 |
| 7143 Village Ln | 0.34mi | 3/2.5 (+1) | 1,537 (+7%) | 4mo | $234,900 | $153 | 62 |
| 7163 Village Ln | 0.36mi | 3/2.5 (+1) | 1,537 (+7%) | 6mo | $234,000 | $152 | 60 |
| 7071 Cedar Grove Rd Unit 6A | 0.43mi | 3/2.5 (+1) | 1,543 (+7%) | 1mo | $225,900 | $146 | 60 |
| 7151 Village Ln | 0.35mi | 3/2.5 (+1) | 1,553 (+8%) | 5mo | $234,900 | $151 | 60 |
| 7059 Cedar Grove Rd Unit 3A | 0.43mi | 3/2.5 (+1) | 1,543 (+7%) | 2mo | $238,900 | $155 | 59 |
| 7135 Village Ln | 0.34mi | 3/2.5 (+1) | 1,537 (+7%) | 8mo | $236,900 | $154 | 59 |
| 7183 Village Ln | 0.38mi | 3/2.5 (+1) | 1,553 (+8%) | 4mo | $234,900 | $151 | 59 |
| 7123 Village Ln | 0.33mi | 3/2.5 (+1) | 1,553 (+8%) | 7mo | $249,000 | $160 | 58 |
Match score weights: distance 35% · size 25% · config 20% · recency 20%. Top-matched comps best support the ARV.
Projected returns pro-forma
-3.0% appreciation · 3.63% rent growth · sell at horizon
- IRR
- 14.0%
- Equity multiple
- 1.56×
- Total profit
- $18,154
- Equity at exit
- $17,147
- IRR
- 23.2%
- Equity multiple
- 3.05×
- Total profit
- $65,991
- Equity at exit
- $9,943
Cash invested: $32,200 (down + closing). Projections, not guarantees.
Landlord ↔ Tenant lean methodology
- Overall (STATE)
- 87 Strongly Landlord-Friendly
- State Florida
- 87 Strongly Landlord-Friendly · R+3
- County
- — inherits STATE
- City
- — inherits STATE
ZIP-level market 32504
- Home prices YoY
- -30.9%
- Rents YoY
- 3.6%
- Active inventory
- 173
- Price-to-rent
- 6.0×
Monthly cashflow live
- Estimated rent
- $1,592 high interval (Pro) →
- Mortgage (P&I)
- −$603
- Tax from tax record
- −$45 /mo · $537/yr
- Insurance
- −$48
- HOA
- −$0
- Vacancy / Maint / Mgmt
- −$334
- Net cashflow
- $562
Break-even live
Sensitivity live
| Price | -10% $627 | -5% $595 | +0% $562 | +5% $530 | +10% $497 |
|---|---|---|---|---|---|
| Rent | -10% $436 | -5% $499 | +0% $562 | +5% $625 | +10% $688 |
| Rate | -1.0pp $620 | -0.5pp $591 | base $562 | +0.5pp $532 | +1.0pp $502 |
UW: 25.0% down · 7.5% · 30yr · 1.5% tax · 5.0% vac · 8.0% maint · 8.0% mgmt
Financing live
Cash to close
- Down payment
- $28,750
- Closing costs
- $3,450
- Reserves months
- —
- Total cash needed
- —
Loan-product check · same deal, 3 products live
Conventional
25% down · 7.5% · 30yr
- Down + closing
- —
- Monthly P&I
- —
- Monthly cashflow
- —
- DSCR
- —
- Eligible?
- —
Personal DTI + credit; lowest rate.
DSCR
20% down · 8.5% · 30yr
- Down + closing
- —
- Monthly P&I
- —
- Monthly cashflow
- —
- DSCR
- —
- Eligible?
- —
No personal income docs; deal must DSCR.
Hard money
10% down · 12.0% · 12mo
- Down + closing
- —
- Monthly P&I
- —
- Monthly cashflow
- —
- DSCR
- —
- Eligible?
- —
Short-term bridge; refi at stabilization.
Rent comps 23 comps
| Address | Beds | Baths | Sqft | Rent | $/sqft | DOM | Units | Dist |
|---|---|---|---|---|---|---|---|---|
| 1843 San Dollar Cir Unit 1843 Pensacola, FL | 2.0 | 1.0 | 920 | $1,400 | $1.52 | 24d | 1 | 0.05mi |
| 7074 Javelin Ct Pensacola, FL | 3.0 | 2.5 | 1543 | $1,850 | $1.20 | 15d | 30 | 0.20mi |
| 7104 Cedar Grove Way Ferry Pass, FL | 3.0 | 2.5 | 1534 | $1,850 | $1.21 | 15d | 37 | 0.38mi |
| 6409 Concord Way Pensacola, FL | 2.0 | 2.0 | 990 | $2,100 | $2.12 | 24d | 1 | 0.46mi |
| 7322 Mangum Dr Unit 7322 Pensacola, FL | 2.0 | 2.0 | 1100 | $1,450 | $1.32 | 24d | 1 | 0.49mi |
| 2106 Schwab Ct Unit B Pensacola, FL | 2.0 | 1.5 | 960 | $1,595 | $1.66 | 15d | 1 | 0.52mi |
| 7650 Kipling St Unit 1 Pensacola, FL | 3.0 | 2.0 | 1200 | $1,300 | $1.08 | 24d | 1 | 0.64mi |
| 700 College Blvd Pensacola, FL | 1.0–2.0 | 1.0–2.0 | 850 | $1,381 | $1.62 | 15d | 9 | 0.85mi |
| 711 Underwood Ave Pensacola, FL | 3.0 | 1.0–2.5 | 950 | $1,472 | $1.55 | 15d | 25 | 0.85mi |
| 3205 E Olive Rd Pensacola, FL | 1.0–2.0 | 1.0–2.0 | 900 | $1,540 | $1.71 | 15d | 8 | 0.91mi |
| 7101 Joy St Unit I5 Pensacola, FL | 3.0 | 2.0 | 1183 | $1,950 | $1.65 | 24d | 1 | 0.94mi |
| 7155 N 9th Ave Pensacola, FL | 1.0–2.0 | 1.0 | 850 | $1,575 | $1.85 | 15d | 4 | 0.97mi |
| 7171 N 9th Ave Unit D6 Pensacola, FL | 2.0 | 2.0 | 1204 | $1,450 | $1.20 | 15d | 1 | 1.04mi |
| 6016 Sewell St Pensacola, FL | 3.0 | 1.5 | 1377 | $1,650 | $1.20 | 24d | 1 | 1.06mi |
| 2813 Langley Ave Pensacola, FL | 2.0 | 2.0 | 1078 | $1,450 | $1.35 | 24d | 1 | 1.06mi |
| 8053 Malibu Cir Pensacola, FL | 3.0 | 2.0 | 1575 | $1,810 | $1.15 | 15d | 1 | 1.07mi |
| 7601 N 9th Ave Pensacola, FL | 1.0–2.0 | 1.0–2.0 | 855 | $1,467 | $1.72 | 15d | 7 | 1.27mi |
| 8108 Ridgefield Rd Pensacola, FL | 3.0 | 2.0 | 1485 | $2,000 | $1.35 | 15d | 1 | 1.35mi |
| 4051 E Olive Rd Pensacola, FL | 1.0–2.0 | 1.0–2.0 | 855 | $1,425 | $1.67 | 24d | 37 | 1.41mi |
| 1857 Atwood Dr Pensacola, FL | 1.0–2.0 | 1.0–1.5 | 892 | $1,399 | $1.57 | 24d | 1 | 1.41mi |
| 6115 N Davis Hwy Pensacola, FL | 1.0–3.0 | 1.0–2.0 | 1112 | $1,625 | $1.46 | 15d | 10 | 1.48mi |
| 7840 Lilac Ln Pensacola, FL | 1.0–3.0 | 1.0–2.0 | 1025 | $1,690 | $1.65 | 15d | 16 | 1.49mi |
| 3730 Forest Glen Dr Pensacola, FL | 3.0 | 2.0 | 1107 | $1,660 | $1.50 | 24d | 1 | 1.49mi |
Listing history 11 events
-
2026-05-24$115,000 Active
-
2012-01-20soldstatus $33,501 231-char remark
Show marketing remark (231 chars)
2br/1.5ba attached single family residence awaits. This home has over 1,400 sqft of living space with generous room sizes. The kitchen has a center island, electric stove and dishwasher. Priced to sell, this home won't last long!
-
2011-12-22$32,000 231-char remark
Show marketing remark (231 chars)
2br/1.5ba attached single family residence awaits. This home has over 1,400 sqft of living space with generous room sizes. The kitchen has a center island, electric stove and dishwasher. Priced to sell, this home won't last long!
-
2001-10-03soldstatus $51,900
-
2001-10-03soldstatus $51,900
-
2001-09-28soldstatus $51,900 157-char remark
Show marketing remark (157 chars)
WELL KEPT TOWNHOME ON LARGE CUL-DE -SAC. FAMILY ROOM WITH FIREPLACE. INSIDE LAUNDRY ROOM. OUTSIDE STORAGE AREA. LARGE KITCHEN WITH ISLAND. UPDATED DISHWASHER
-
2001-08-21$49,999 157-char remark
Show marketing remark (157 chars)
WELL KEPT TOWNHOME ON LARGE CUL-DE -SAC. FAMILY ROOM WITH FIREPLACE. INSIDE LAUNDRY ROOM. OUTSIDE STORAGE AREA. LARGE KITCHEN WITH ISLAND. UPDATED DISHWASHER
-
2000-11-19historical
-
2000-05-19$54,850
-
1994-04-26soldstatus $49,000
-
1984-11-01soldstatus $42,600
ⓘ Source: listings_history table (triggers on properties + properties_extension) + one-shot
backfill from property_details.listing_events for pre-trigger history.
Tax reassessment forecast FL · Resets to sale price
- Current annual tax
- $537 · $45/mo
- Projected year-2 tax
- $954 · $80/mo
- Expected delta
- +$417/yr (+$35/mo · 77.7%)
ⓘ Screening estimate from a state-policy table — verify with the county assessor before closing.
Climate risk First Street
- Flood 1/10 Low FEMA zone X (unshaded) · 0% chance over 30 yrs
- Wildfire 1/10 Low
- Heat 10/10 Extreme 7 d/yr ≥106°F today · 22 d/yr by 30 yrs out
- Wind 9/10 Extreme 99% chance of damaging wind over 30 yrs
- Air quality 1/10 Low 0 unhealthy d/yr today · 0 by 30 yrs out
Nearby sold comps map
Loading sold comps map…
Walkable amenities ~0.75 mi
Loading nearby amenities…
Taxation est. · year 1
- Rental income
- $19,109
- − Mortgage interest
- −$6,442
- − Property taxes
- −$537
- − Insurance
- −$575
- − Repairs & maintenance
- −$1,529
- − Management
- −$1,529
- − Depreciation
- −$3,345
- Taxable income
- $5,152
- Est. tax owed @ 24.0%
- −$1,236
- After-tax cash flow
- $5,511/yr
For passive investors: Depreciation is non-cash, so a rental often shows a tax loss while cash-flowing — sheltering income. Rental losses are passive: they offset passive income freely, and up to $25,000/yr can offset ordinary (W-2) income if you actively participate and your MAGI is under $100k (phasing out to $0 by $150k); unused losses carry forward. On sale, claimed depreciation is recaptured at up to 25%, and gains may owe capital-gains tax (a 1031 exchange can defer both). Figures are a year-1 estimate at your 24.0% rate — not tax advice; consult a CPA.
Schools (NCES district)
- District
- Escambia
- NCES district ID
- 1200510
- Math proficiency
- 40% ▼ -9.00%
- Reading proficiency
- 45% ▼ -4.00%
- Median HH income
- $44,649
- Composite
- 36.04/100
- National rank
- #4773
- State rank
- #56 of 73 in FL
Livability — Ferry Pass
- Score
- 65/100
- State rank
- #664
- US rank
- #13543
Category grades
Schools grade is shown separately in the Schools card above.
Census & demographics
- Census place
- Ferry Pass, FL
- County
- Escambia County · 301,722 people
- City population
- 43,072
- Metro
- Pensacola-Ferry Pass-Brent, FL
- Population (ZIP)
- 22,153
- Household income
- $72,672
- Rent vs Own
- Severe rent burden
- 533.0
Population outlook (Escambia County) Hauer SSP2
- Today (2025)
- 334,637 people
- By 2030
- 345,779 · +3.3%
- By 2040
- 364,828 · +9.0%
- By 2050
- 378,514 · +13.1%
- By 2075
- 403,220 · +20.5%
- By 2100
- 386,125 · +15.4%
Race, ethnicity, and origin ACS 2023
- Neighborhood character
- Predominantly White (69%)
- Race & ethnicity
- White 69% Black 13% Two or more races 10% Hispanic / Latino 6% Asian 4%
- Hispanic origin (detail)
- Mexican 2%
- Common ancestry
- Lithuanian 3% Italian 2% Slovak 2%
- Foreign-born
- 7% · Canada, China, Jamaica
- Languages at home
- 92% English-only · Spanish 2% Chinese 2% Other Indo-European 1%
Political lean MEDSL · Escambia
- 2024 margin
- R (+19.5) · D 39.7% · R 59.2% · Other 1.1%
- 2008→2024 swing
- -0.2pp no change · 2008: -19.3pp · 2024: -19.5pp
- All cycles
- 2024: R+19.5 2020: R+15.1 2016: R+20.6 2012: R+20.6 2008: R+19.3
Not yet ingested
- Civics
- —
Market trends
- HPI YoY
- ▼ -119.75%
- Current HPI
- 268.2214
- Rent YoY
- ▲ 3.63%
- Metro
- Pensacola-Ferry Pass-Brent, FL
- State GDP YoY
- ▲ 3.28%
- F500 in state
- 36
Industry mix (Fortune 500 HQ in FL)
| Industry | F500 HQs | Revenue |
|---|---|---|
| Industrial Technology | 2 | $29B |
|
||
| Insurance | 2 | $17B |
|
||
| Retail | 1 | $60B |
|
||
| Technology Distribution | 1 | $58B |
|
||
| Homebuilding | 1 | $35B |
|
||
| Technology Manufacturing | 1 | $35B |
|
||
Price history
+170.0% since first listed11 events — show timeline
- 2026-05-24 Listed $115,000 PARMLS
- 2012-01-20 Sold (MLS) $33,501 PARMLS
- 2011-12-22 Listed $32,000 PARMLS
- 2001-10-03 Sold (Public Records) $51,900 Public Records
- 2001-10-03 Sold (Public Records) $51,900 Public Records
- 2001-09-28 Sold (MLS) $51,900 PARMLS
- 2001-08-21 Listed $49,999 PARMLS
- 2000-11-19 Listing Removed — PARMLS
- 2000-05-19 Listed $54,850 PARMLS
- 1994-04-26 Sold (Public Records) $49,000 Public Records
- 1984-11-01 Sold (Public Records) $42,600 Public Records
Property tax history
+5.9%/yrLatest (2025): $537 · +31.9% YoY. Source: county tax records.
Cash-flow waterfall
monthlySold comps — $/sqft
last 12 mo · ≤1 miLoading sold comps…