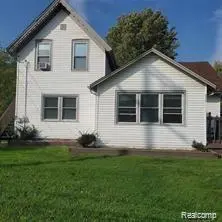
4414 S Martin Luther King JR Blvd · Lansing, MI
Flood risk 1/10 · Minimal
- FEMA flood zone
- X (unshaded)
- Chance of flooding over 30 yrs
- 0.0%
- Est. flood insurance / yr
- $473 – $860
Fire risk 1/10 · Minimal
- Est. fire insurance / yr
- $784 – $1,456
Heat risk 2/10 · Minimal
- Hot days now (above 97°F)
- 7 days/yr
- Hot days in 30 yrs
- 16 days/yr
Wind risk 2/10 · Minimal
- Chance of severe wind over 30 yrs
- —
Air-quality risk 2/10 · Minimal
- Unhealthy air days now
- 1 days/yr
- Unhealthy air days in 30 yrs
- 2 days/yr
Risk factors via First Street. Map © Google.
Why this score? — see what drove the B grade
The composite is a weighted blend of 9 inputs, each scored 0–100. Each bar is that input's sub-score; the figure is the points it added to the 100-point composite (weight × sub-score).
- Cash flow +25.9/30.0
- ARV discount +15.0/15.0
- 1% rule +9.6/10.0
- DSCR +8.7/10.0
- Livability +4.0/5.0
- Rent growth +3.7/5.0
- Condition / age +2.5/5.0
- Schools +1.9/10.0
- Appreciation +0.0/10.0
$119,999
🖨 Deal sheet (PDF) 📄 Offer letter ✓ Due diligence
Listing remarks MLS
Welcome to 4414 S Martin Luther King this 2-unit Property offers Main floor with a full kitchen, full bathroom and 3-4 bedrooms. There isa huge 2-3 car attached garage with the property. Huge backyard great for kids and pets. Lots of parking. Property has a newer furnace, oversized water heater and new electric heat on the second floor apartment. Upstairs unit is also set up for a 2-unit rental with 1bedroom live in one and make money from the other one. F-Commercial Zoning- has been used as 2 units but could be converted back to1 unit.
Key facts
- New furnace
- Full kitchen
- Full bathroom
Tags
Neighborhood map
What this means for you Summary
Snapshot
- This is a 3-bed/1.5-bath single-family listed at $120k.
Deal economics
- At list price, monthly cash flow is $295 ($4k/yr) — positive.
- The deal already cash-flows at list — no discount required.
- Meets the 1% rule at list price ($2k rent vs $120k).
- Recommended offer: $106k (12.0% below list) — sets the bar for market timing.
- Cap rate 9.2% vs local median 6.0% in Lansing — top-decile yield for the area; either an underpriced asset or a hidden risk that comps aren't pricing in. Stress-test before assuming the spread holds.
Location & tenants
- Location reads 79/100 on livability (#94 in MI, #2,182 nationally) — a middle-class / working-renter tenant base. Strengths: amenities A+, commute A+, cost of living A+; Watch: employment D, schools F, crime F.
- Lansing Public School District (urban): math 14% / reading 23% proficiency, ranked #650 of 760 in MI (top 86%) — low school quality limits family demand, transient renter base, plan for 1-2y turnover; 68% free/reduced lunch — lower-income household profile, screen leases tightly.
- Market conditions: Rents rising fast (+4.7%/yr); 175 active listings in the ZIP; 4 comparable units currently listed for rent nearby; rentals lingering (median 45d on market — plan ~5-8 weeks vacancy on turnover, expect pricing pressure); 75% of comp listings sitting > 30 days — soft ceiling on asking rent; 350 units permitted in Ingham County in 2024 (186 in 5+ unit buildings).
- This rent runs 39% of the median local income ($55k/yr) — at the standard rent-burdened threshold; future hikes will face affordability resistance.
Forward outlook
- Local home prices are declining (-3.0%/yr); year-one equity from $829 of loan paydown is wiped out by about $4k of value loss. Plan a longer hold.
- Ingham County population projected at +11% by 2050 — modest demand growth; plan on rents tracking national, not racing it.
- At projected returns (-3.0% appreciation + 4.7% rent growth), your $34k cash investment doubles in ~9 years — after that, you're playing with house money.
Negotiation context
- It's been on market 149 days — a 12% lower offer ($106k) is reasonable based on typical stale-listing flexibility.
- 27 sale attempts since 8y ago with the ask held roughly flat each time — persistent listings suggest the price (not the market) is what's stuck; bring a comps-based counter.
- Current owner paid $100k; 20% above their basis — modest negotiation headroom, anchor on the comps not their cost.
Risks & watch-outs
- Watch-outs: property tax is 4.1% of price; built in 1910 — expect roof / HVAC / electrical / plumbing capex.
Questions for the listing agent
- It's been on market 149 days. Have you received any prior offers? Is the seller open to a 12% concession, seller financing, or rate buy-down credit?
- Built in 1910 — when were the roof, HVAC, electrical panel, plumbing, and water heater last replaced?
- Property tax is high relative to price — has the assessment been appealed recently, and will the sale trigger a re-assessment?
- Why hasn't it sold? Are there any deal-killer items the seller is aware of (foundation, flood, title, zoning, code violations)?
- Is there a deadline driving the sale (1031 exchange, divorce, estate, relocation)? That informs how much negotiation room exists.
- Schools are F-rated, which usually means shorter tenancies and higher turnover. Who's the typical renter profile here, and what's been the actual vacancy rate?
- Crime grade is F in this area — have there been break-ins, vandalism, or insurance claims at this property in the last 3 years? What carrier currently insures it and at what premium?
- What's the average days-on-market for RENTAL listings here right now (not sales)? A rising rental-DOM trend means longer vacancies and softer asking-rent achievability than the comps imply.
- What's the recent tenant-quality profile in this submarket — average credit score on applications, eviction rate, late-payment / NSF rate, and stable-employment percentage? A property-management company in the area should have these aggregated.
- How much new for-sale + rental construction is in the pipeline within 1–3 miles? Heavy new supply typically softens prices + rents 12–24 months out; constrained supply supports both.
Investment metrics
- 1% rule
- 1.46% ✓
- Cap rate
- 9.24%
- Cash-on-cash
- 10.53%
- DSCR
- 1.47
- GRM
- 5.7
CMA / ARV
- ARV (median comp)
- $145,968
- List price
- $119,999
- Delta
- -17.79%
- Verdict
- UNDERPRICED
- Comps
- 2 within 1.0 mi
Show comp detail 12 sales within ~0.75 mi
| Address | Dist | Beds/Ba | Sqft | Sold | Price | $/sf | Match |
|---|---|---|---|---|---|---|---|
| 1729 Reo Rd | 0.41mi | 3/1.5 | 1,627 (+2%) | 2mo | $184,900 | $114 | 75 |
| 4916 Tressa Dr | 0.40mi | 3/1.5 | 1,683 (+6%) | 5mo | $145,000 | $86 | 67 |
| 4907 Burchfield Ave | 0.38mi | 3/1.5 | 1,437 (-10%) | 3mo | $140,000 | $97 | 64 |
| 4926 Burchfield Ave | 0.40mi | 3/1.0 | 1,452 (-9%) | 3mo | $183,000 | $126 | 63 |
| 1904 Hillcrest St | 0.57mi | 3/1.0 | 1,514 (-5%) | 2mo | $155,000 | $102 | 61 |
| 4407 Burchfield Ave | 0.25mi | 2/1.5 (-1) | 1,804 (+13%) | 5mo | $125,000 | $69 | 57 |
| 5221 Tulip Ave | 0.65mi | 3/1.0 | 1,501 (-6%) | 4mo | $172,000 | $115 | 55 |
| 3430 Palmer St | 0.69mi | 2/1.0 (-1) | 1,560 (-2%) | 3mo | $170,000 | $109 | 55 |
| 3437 Harold St | 0.67mi | 2/1.5 (-1) | 1,504 (-6%) | 5mo | $153,500 | $102 | 50 |
| 2010 Ferrol St | 0.71mi | 4/1.5 (+1) | 1,472 (-8%) | 4mo | $170,000 | $115 | 46 |
| 825 Ferley St | 0.64mi | 2/2.0 (-1) | 1,426 (-10%) | 5mo | $184,000 | $129 | 41 |
| 4613 Stafford Ave | 0.75mi | 2/1.0 (-1) | 1,378 (-13%) | 5mo | $155,000 | $112 | 31 |
Match score weights: distance 35% · size 25% · config 20% · recency 20%. Top-matched comps best support the ARV.
Projected returns pro-forma
-3.0% appreciation · 4.71% rent growth · sell at horizon
- IRR
- 2.0%
- Equity multiple
- 1.08×
- Total profit
- $2,593
- Equity at exit
- $17,892
- IRR
- 13.6%
- Equity multiple
- 2.20×
- Total profit
- $40,254
- Equity at exit
- $10,375
Cash invested: $33,600 (down + closing). Projections, not guarantees.
Landlord ↔ Tenant lean methodology
- Overall (STATE)
- 62 Landlord-Friendly
- State Michigan
- 62 Landlord-Friendly · EVEN
- County
- — inherits STATE
- City
- — inherits STATE
ZIP-level market 48910
- Rents YoY
- 4.7%
- Active inventory
- 175
- Price-to-rent
- 5.7×
Monthly cashflow live
- Estimated rent
- $1,755 medium interval (Pro) →
- Mortgage (P&I)
- −$629
- Tax from tax record
- −$413 /mo · $4,952/yr
- Insurance
- −$50
- HOA
- −$0
- Vacancy / Maint / Mgmt
- −$369
- Net cashflow
- $295
Break-even live
Sensitivity live
| Price | -10% $363 | -5% $329 | +0% $295 | +5% $261 | +10% $227 |
|---|---|---|---|---|---|
| Rent | -10% $156 | -5% $225 | +0% $295 | +5% $364 | +10% $434 |
| Rate | -1.0pp $355 | -0.5pp $325 | base $295 | +0.5pp $264 | +1.0pp $232 |
UW: 25.0% down · 7.5% · 30yr · 1.5% tax · 5.0% vac · 8.0% maint · 8.0% mgmt
Financing live
Cash to close
- Down payment
- $30,000
- Closing costs
- $3,600
- Reserves months
- —
- Total cash needed
- —
Loan-product check · same deal, 3 products live
Conventional
25% down · 7.5% · 30yr
- Down + closing
- —
- Monthly P&I
- —
- Monthly cashflow
- —
- DSCR
- —
- Eligible?
- —
Personal DTI + credit; lowest rate.
DSCR
20% down · 8.5% · 30yr
- Down + closing
- —
- Monthly P&I
- —
- Monthly cashflow
- —
- DSCR
- —
- Eligible?
- —
No personal income docs; deal must DSCR.
Hard money
10% down · 12.0% · 12mo
- Down + closing
- —
- Monthly P&I
- —
- Monthly cashflow
- —
- DSCR
- —
- Eligible?
- —
Short-term bridge; refi at stabilization.
Rent comps 4 comps
| Address | Beds | Baths | Sqft | Rent | $/sqft | DOM | Units | Dist |
|---|---|---|---|---|---|---|---|---|
| 2612 Fielding Dr Lansing, MI | 2.0 | 1.0 | 1100 | $1,095 | $1.00 | 45d | 1 | 0.99mi |
| 3021 Midwood St Lansing, MI | 4.0 | 2.0 | 2060 | $2,495 | $1.21 | 45d | 1 | 1.32mi |
| 2528 Forest Ave Lansing, MI | 4.0 | 1.0 | 1175 | $1,699 | $1.45 | 45d | 1 | 1.38mi |
| 4106 Stillwell Ave Lansing, MI | 3.0 | 1.5 | 1127 | $2,100 | $1.86 | 22d | 1 | 1.47mi |
Listing history 50 events
-
2026-06-21days on market $119,999 Active 149 DOM
-
2026-06-18days on market $119,999 Active 146 DOM
-
2026-06-17days on market $119,999 Active 145 DOM
-
2026-06-16days on market $119,999 Active 144 DOM
-
2026-06-15days on market $119,999 Active 143 DOM
-
2026-06-14days on market $119,999 Active 141 DOM
-
2026-06-13days on market $119,999 Active 140 DOM
-
2026-06-10days on market $119,999 Active 138 DOM
-
2026-06-09days on market $119,999 Active 137 DOM
-
2026-06-08days on market $119,999 Active 136 DOM
-
2026-06-07days on market $119,999 Active 135 DOM
-
2026-06-05days on market $119,999 Active 132 DOM
-
2026-06-03days on market $119,999 Active 131 DOM
-
2026-06-02days on market $119,999 Active 130 DOM
-
2026-06-01days on market $119,999 Active 129 DOM
-
2026-05-31days on market $119,999 Active 128 DOM
-
2026-05-30days on market $119,999 Active 127 DOM
-
2026-02-05historical
-
2026-01-26$119,999 Active
Show marketing remark (542 chars)
Welcome to 4414 S Martin Luther King this 2-unit Property offers Main floor with a full kitchen, full bathroom and 3-4 bedrooms. There isa huge 2-3 car attached garage with the property. Huge backyard great for kids and pets. Lots of parking. Property has a newer furnace, oversized water heater and new electric heat on the second floor apartment. Upstairs unit is also set up for a 2-unit rental with 1bedroom live in one and make money from the other one. F-Commercial Zoning- has been used as 2 units but could be converted back to1 unit.
-
2026-01-26$119,999 Active 542-char remark
Show marketing remark (542 chars)
Welcome to 4414 S Martin Luther King this 2-unit Property offers Main floor with a full kitchen, full bathroom and 3-4 bedrooms. There isa huge 2-3 car attached garage with the property. Huge backyard great for kids and pets. Lots of parking. Property has a newer furnace, oversized water heater and new electric heat on the second floor apartment. Upstairs unit is also set up for a 2-unit rental with 1bedroom live in one and make money from the other one. F-Commercial Zoning- has been used as 2 units but could be converted back to1 unit.
-
2026-01-23$119,999 Active
-
2026-01-23historical
-
2026-01-23$119,999 Active
-
2026-01-23historical
-
2026-01-22historical
-
2026-01-22historical
-
2026-01-20$119,999 Active
-
2026-01-20$119,999 Active
-
2025-07-07price $119,999
-
2025-07-07price $119,999
-
2025-03-04status Active
-
2025-03-03historical
-
2025-01-02status Active
-
2025-01-02status Active
-
2024-12-16historical
-
2024-12-16historical
-
2024-08-28$139,999 Active
-
2024-08-28$139,999 Active
-
2024-08-28historical
-
2024-08-28historical
-
2024-08-28historical
-
2024-04-14$139,999 Active
-
2024-04-14$139,999 Active
-
2024-04-12historical
-
2024-04-12historical
-
2024-04-12$139,999 Active
-
2022-09-16soldstatus $100,000
-
2022-04-13historical
-
2022-02-02historical
-
2022-02-02historical
ⓘ Source: listings_history table (triggers on properties + properties_extension) + one-shot
backfill from property_details.listing_events for pre-trigger history.
Tax reassessment forecast MI · Partial reset (capped growth)
- Current annual tax
- $4,952 · $413/mo
- Projected year-2 tax
- $4,952 · $413/mo
- Expected delta
- $0/yr ($0/mo · 0.0%)
ⓘ Screening estimate from a state-policy table — verify with the county assessor before closing.
Climate risk First Street
- Flood 1/10 Low FEMA zone X (unshaded) · 0% chance over 30 yrs
- Wildfire 1/10 Low
- Heat 2/10 Low 7 d/yr ≥97°F today · 16 d/yr by 30 yrs out
- Wind 2/10 Low
- Air quality 2/10 Low 1 unhealthy d/yr today · 2 by 30 yrs out
Nearby sold comps map
Loading sold comps map…
Walkable amenities ~0.75 mi
Loading nearby amenities…
Taxation est. · year 1
- Rental income
- $21,066
- − Mortgage interest
- −$6,722
- − Property taxes
- −$4,952
- − Insurance
- −$600
- − Repairs & maintenance
- −$1,685
- − Management
- −$1,685
- − Depreciation
- −$3,491
- Taxable income
- $1,930
- Est. tax owed @ 24.0%
- −$463
- After-tax cash flow
- $3,075/yr
For passive investors: Depreciation is non-cash, so a rental often shows a tax loss while cash-flowing — sheltering income. Rental losses are passive: they offset passive income freely, and up to $25,000/yr can offset ordinary (W-2) income if you actively participate and your MAGI is under $100k (phasing out to $0 by $150k); unused losses carry forward. On sale, claimed depreciation is recaptured at up to 25%, and gains may owe capital-gains tax (a 1031 exchange can defer both). Figures are a year-1 estimate at your 24.0% rate — not tax advice; consult a CPA.
Schools (NCES district)
- District
- Lansing Public School District
- NCES district ID
- 2621150
- Math proficiency
- 14% ▲ 1.00%
- Reading proficiency
- 23% ▲ 3.00%
- Median HH income
- $37,453
- Composite
- 18.76/100
- National rank
- #14002
- State rank
- #650 of 760 in MI
Livability — Lansing
- Score
- 79/100
- State rank
- #94
- US rank
- #2182
Category grades
Schools grade is shown separately in the Schools card above.
Census & demographics
- Census place
- Lansing, MI
- County
- Ingham County · 237,052 people
- City population
- 161,269
- Metro
- Lansing-East Lansing, MI
- Population (ZIP)
- 32,800
- Household income
- $54,712
- Rent vs Own
- Severe rent burden
- 1305.0
Population outlook (Ingham County) Hauer SSP2
- Today (2025)
- 300,362 people
- By 2030
- 307,808 · +2.5%
- By 2040
- 320,492 · +6.7%
- By 2050
- 333,223 · +10.9%
- By 2075
- 373,693 · +24.4%
- By 2100
- 392,021 · +30.5%
Race, ethnicity, and origin ACS 2023
- Neighborhood character
- Diverse neighborhood (Simpson 0.62)
- Race & ethnicity
- White 58% Black 16% Hispanic / Latino 12% Two or more races 12% Asian 4% Native American 1%
- Hispanic origin (detail)
- Mexican 9% Cuban 2%
- Common ancestry
- Romanian 5% Lithuanian 3% Slovak 2%
- Foreign-born
- 9% · Canada, China, Vietnam
- Languages at home
- 87% English-only · Spanish 6% Chinese 1% Other Indo-European 1%
Political lean MEDSL · Ingham
- 2024 margin
- Strong D (+29.7) · D 63.9% · R 34.2% · Other 2.0%
- 2008→2024 swing
- -3.6pp toward R · 2008: 33.3pp · 2024: 29.7pp
- All cycles
- 2024: D+29.7 2020: D+32.2 2016: D+27.6 2012: D+27.9 2008: D+33.3
Not yet ingested
- Civics
- —
Market trends
- HPI YoY
- ▼ -211.82%
- Current HPI
- 196.8087
- Rent YoY
- ▲ 4.71%
- Metro
- Lansing-East Lansing, MI
- State GDP YoY
- ▲ 1.37%
- F500 in state
- 28
Industry mix (Fortune 500 HQ in MI)
| Industry | F500 HQs | Revenue |
|---|---|---|
| Automotive Parts | 3 | $48B |
|
||
| Automotive | 2 | $372B |
|
||
| Chemicals | 1 | $45B |
|
||
| Automotive Retail | 1 | $29B |
|
||
| Healthcare / Medical Devices | 1 | $23B |
|
||
| Automotive Technology | 1 | $20B |
|
||
Price history
+42.9% since first listed58 events — show timeline
- 2026-02-05 Listing Removed — REALCOMP
- 2026-01-26 Listed $119,999 REALCOMP
- 2026-01-26 Listed $119,999 MiRealSource-MiMLS
- 2026-01-23 Listed $119,999 REALCOMP
- 2026-01-23 Listing Removed — MiRealSource-MiMLS
- 2026-01-23 Listed $119,999 MiRealSource-MiMLS
- 2026-01-23 Listing Removed — REALCOMP
- 2026-01-22 Listing Removed — MiRealSource-MiMLS
- 2026-01-22 Listing Removed — REALCOMP
- 2026-01-20 Listed $119,999 MiRealSource-MiMLS
- 2026-01-20 Listed $119,999 REALCOMP
- 2025-07-07 Price Changed $119,999 MiRealSource-MiMLS
- 2025-07-07 Price Changed $119,999 REALCOMP
- 2025-03-04 Relisted — REALCOMP
- 2025-03-03 Listing Removed — REALCOMP
- 2025-01-02 Relisted — MiRealSource-MiMLS
- 2025-01-02 Relisted — REALCOMP
- 2024-12-16 Listing Removed — MiRealSource-MiMLS
- 2024-12-16 Listing Removed — REALCOMP
- 2024-08-28 Listing Removed — MiRealSource-MiMLS
- 2024-08-28 Listing Removed — MiRealSource-MiMLS
- 2024-08-28 Listing Removed — REALCOMP
- 2024-08-28 Listed $139,999 MiRealSource-MiMLS
- 2024-08-28 Listed $139,999 REALCOMP
- 2024-04-14 Listed $139,999 MiRealSource-MiMLS
- 2024-04-14 Listed $139,999 REALCOMP
- 2024-04-12 Coming Soon — MiRealSource-MiMLS
- 2024-04-12 Coming Soon — REALCOMP
- 2024-04-12 Listed $139,999 MiRealSource-MiMLS
- 2022-09-16 Sold (Public Records) $100,000 Public Records
- 2022-04-13 Listing Removed — MiRealSource-MiMLS
- 2022-02-02 Listing Removed — Greater Lansing AoR
- 2022-02-02 Listing Removed — REALCOMP
- 2021-12-13 Price Changed $119,900 Greater Lansing AoR
- 2021-12-12 Listed $119,900 MiRealSource-MiMLS
- 2021-12-06 Listed $139,900 Greater Lansing AoR
- 2021-12-06 Listed $119,900 REALCOMP
- 2021-11-24 Listing Removed — Greater Lansing AoR
- 2021-11-24 Listing Removed — REALCOMP
- 2021-10-15 Listed $139,900 Greater Lansing AoR
- 2021-10-15 Listed $139,900 REALCOMP
- 2021-10-10 Listing Removed — REALCOMP
- 2021-10-10 Listing Removed — Greater Lansing AoR
- 2021-08-02 Listed $134,900 REALCOMP
- 2021-08-02 Listed $134,900 Greater Lansing AoR
- 2021-05-13 Listing Removed — REALCOMP
- 2021-05-13 Listing Removed — Greater Lansing AoR
- 2021-04-13 Listed $149,900 REALCOMP
- 2021-04-13 Listed $149,900 Greater Lansing AoR
- 2020-07-13 Sold (Public Records) $48,000 Public Records
- 2019-04-05 Listing Removed — REALCOMP
- 2019-04-05 Listing Removed — Greater Lansing AoR
- 2018-10-05 Listed $64,900 REALCOMP
- 2018-10-05 Listed $64,900 Greater Lansing AoR
- 2018-08-30 Listing Removed — Greater Lansing AoR
- 2018-08-30 Listing Removed — REALCOMP
- 2018-02-25 Listed $84,000 Greater Lansing AoR
- 2018-02-25 Listed $84,000 REALCOMP
Property tax history
+6.1%/yrLatest (2025): $4,952 · +3.0% YoY. Source: county tax records.
Cash-flow waterfall
monthlySold comps — $/sqft
last 12 mo · ≤1 miLoading sold comps…