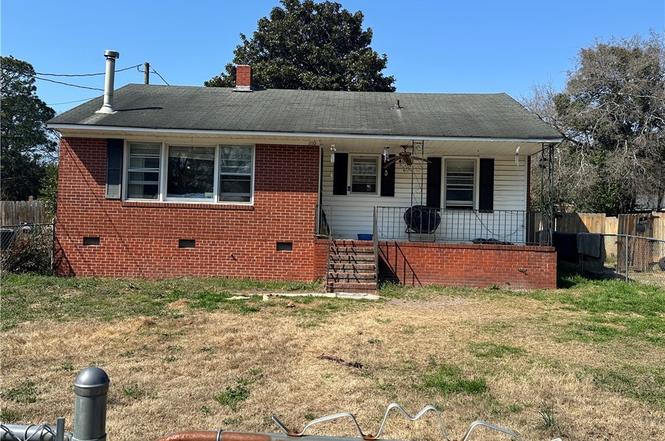
1110 Martindale Dr · Fayetteville, NC
Flood risk 1/10 · Minimal
- FEMA flood zone
- X (unshaded)
- Chance of flooding over 30 yrs
- 0.0%
- Est. flood insurance / yr
- $507 – $1,088
Fire risk 2/10 · Minimal
- Est. fire insurance / yr
- $906 – $1,684
Heat risk 7/10 · Major
- Hot days now (above 106°F)
- 7 days/yr
- Hot days in 30 yrs
- 16 days/yr
Wind risk 7/10 · Major
- Chance of severe wind over 30 yrs
- 75.0%
Air-quality risk 1/10 · Minimal
- Unhealthy air days now
- 0 days/yr
- Unhealthy air days in 30 yrs
- 0 days/yr
Risk factors via First Street. Map © Google.
Why this score? — see what drove the B grade
The composite is a weighted blend of 9 inputs, each scored 0–100. Each bar is that input's sub-score; the figure is the points it added to the 100-point composite (weight × sub-score).
- Cash flow +27.2/30.0
- ARV discount +15.0/15.0
- DSCR +9.5/10.0
- 1% rule +7.8/10.0
- Livability +3.8/5.0
- Rent growth +3.3/5.0
- Schools +3.1/10.0
- Condition / age +2.5/5.0
- Appreciation +0.0/10.0
$99,573
🖨 Deal sheet 📄 Offer letter ✓ Due diligence
Listing remarks
There is great potential in this home. If your looking for an investment property where you can put your personal touch, this is an amazing opportunity! There is a galley kitchen and a large living , dining room combination, grounded by a corner freestanding wood stove. All three bedrooms are generously sized and the full bathroom is centrally located. There is no functioning HVAC, but the lines are present. In the big backyard is an awesome two stall garage, (I cannot find permit records). The home is being sold AS IS and for cash only.
Key facts
- Big backyard
- Galley kitchen
- Two stall garage
Tags
Neighborhood map
What this means for you Summary
Snapshot
- This is a 3-bed/1.0-bath single-family listed at $100k.
Deal economics
- At list price, monthly cash flow is $287 ($3k/yr) — positive.
- The deal already cash-flows at list — no discount required.
- Meets the 1% rule at list price ($1k rent vs $100k).
- Recommended offer: $98k (1.5% below list) — sets the bar for market timing.
- Cap rate 9.7% vs local median 4.9% in Fayetteville — top-decile yield for the area; either an underpriced asset or a hidden risk that comps aren't pricing in. Stress-test before assuming the spread holds.
Location & tenants
- Location reads 75/100 on livability (#45 in NC, #4,031 nationally) — a middle-class / working-renter tenant base. Strengths: commute A+, cost of living A+, housing A+; Watch: crime F, employment D-.
- Cumberland County Schools (urban): math 32% / reading 41% proficiency, ranked #126 of 178 in NC (top 71%) — families likely to look elsewhere, expect single-tenant / working-renter base with shorter leases.
- Zoned schools: Douglas Byrd Middle (math 13% / reading 30%, grade F, #422 of 475 statewide, top 89%, 935 students, 100% FRL); Douglas Byrd High (math 22% / reading 42%, grade F, #445 of 535 statewide, top 84%, 940 students, 99% FRL) — zoned schools average 99% FRL vs 55% district-wide (45 pts higher); higher-poverty schools than district average — tighter screening recommended.
- Market conditions: Rents rising (+3.2%/yr); 302 active listings in the ZIP; 20 comparable units currently listed for rent nearby; rentals at typical pace (median 24d on market — plan ~3-4 weeks tenant-placement turnaround); 1,125 units permitted in Cumberland County in 2024 (104 in 5+ unit buildings).
Forward outlook
- Local home prices are declining (-3.0%/yr); year-one equity from $689 of loan paydown is wiped out by about $3k of value loss. Plan a longer hold.
- At projected returns (-3.0% appreciation + 3.2% rent growth), your $28k cash investment doubles in ~9 years — after that, you're playing with house money.
Negotiation context
- It's been on market 29 days — a 2% lower offer ($98k) is reasonable based on typical stale-listing flexibility.
- Current owner paid $55k; list at $100k implies a 81% gain — meaningful room to come down on a strong offer.
Risks & watch-outs
- Watch-outs: built in 1957 — expect roof / HVAC / electrical / plumbing capex.
- Climate carrying-cost: major wind risk, 75% chance of damaging wind over 30y; extreme-heat days projected 7→16/yr by 2055 (HVAC capex compounding) — expect insurance premiums to compound above CPI over the hold.
Questions for the listing agent
- Built in 1957 — when were the roof, HVAC, electrical panel, plumbing, and water heater last replaced?
- Is there a deadline driving the sale (1031 exchange, divorce, estate, relocation)? That informs how much negotiation room exists.
- Crime grade is F in this area — have there been break-ins, vandalism, or insurance claims at this property in the last 3 years? What carrier currently insures it and at what premium?
- What's the average days-on-market for RENTAL listings here right now (not sales)? A rising rental-DOM trend means longer vacancies and softer asking-rent achievability than the comps imply.
- What's the recent tenant-quality profile in this submarket — average credit score on applications, eviction rate, late-payment / NSF rate, and stable-employment percentage? A property-management company in the area should have these aggregated.
- How much new for-sale + rental construction is in the pipeline within 1–3 miles? Heavy new supply typically softens prices + rents 12–24 months out; constrained supply supports both.
Investment metrics
- 1% rule
- 1.28% ✓
- Cap rate
- 9.75%
- Cash-on-cash
- 12.33%
- DSCR
- 1.55
- GRM
- 6.5
CMA / ARV
- ARV (on-the-fly)
- $150,563
- Comps found
- 12
Show comp detail 12 sales within ~0.75 mi
| Address | Dist | Beds/Ba | Sqft | Sold | Price | $/sf | Match |
|---|---|---|---|---|---|---|---|
| 1110 Martindale Dr | 0.00mi | 3/1.0 | 959 (0%) | 1mo | $71,500 | $75 | 99 |
| 1112 Faison Ave | 0.08mi | 3/1.0 | 936 (-2%) | 0mo | $170,000 | $182 | 92 |
| 3901 Hartwell Rd | 0.03mi | 3/2.0 | 1,066 (+11%) | 2mo | $160,000 | $150 | 74 |
| 1002 Hicks Ave | 0.15mi | 3/1.5 | 1,025 (+7%) | 11mo | $215,000 | $210 | 70 |
| 3710 Wyatt St | 0.56mi | 3/1.0 | 1,025 (+7%) | 1mo | $160,900 | $157 | 62 |
| 306 Rodie Ave | 0.57mi | 3/1.0 | 980 (+2%) | 12mo | $176,000 | $180 | 60 |
| 4009 Village Dr | 0.62mi | 3/1.0 | 1,042 (+9%) | 1mo | $160,000 | $154 | 56 |
| 501 Roxie Ave | 0.48mi | 2/1.0 (-1) | 859 (-10%) | 5mo | $133,000 | $155 | 51 |
| 1809 Wendover Dr | 0.56mi | 3/2.0 | 1,058 (+10%) | 7mo | $193,000 | $182 | 47 |
| 203 Rodie Ave | 0.68mi | 2/1.0 (-1) | 847 (-12%) | 0mo | $120,000 | $142 | 44 |
| 309 Faison Ave | 0.55mi | 2/1.0 (-1) | 875 (-9%) | 20mo | $60,000 | $69 | 38 |
| 4709 Pamlico Rd | 0.73mi | 3/2.0 | 1,089 (+14%) | 2mo | $216,000 | $198 | 38 |
Match score weights: distance 35% · size 25% · config 20% · recency 20%. Top-matched comps best support the ARV.
Projected returns pro-forma
-3.0% appreciation · 3.17% rent growth · sell at horizon
- IRR
- 2.2%
- Equity multiple
- 1.09×
- Total profit
- $2,372
- Equity at exit
- $14,847
- IRR
- 12.0%
- Equity multiple
- 1.96×
- Total profit
- $26,630
- Equity at exit
- $8,609
Cash invested: $27,880 (down + closing). Projections, not guarantees.
Landlord ↔ Tenant lean methodology
- Overall (STATE)
- 85 Strongly Landlord-Friendly
- State North Carolina
- 85 Strongly Landlord-Friendly · R+3
- County
- — inherits STATE
- City
- — inherits STATE
ZIP-level market 28304
- Home prices YoY
- -21.7%
- Rents YoY
- 3.2%
- Active inventory
- 302
- Price-to-rent
- 6.5×
Monthly cashflow live
- Estimated rent
- $1,278 high interval (Pro) →
- Mortgage (P&I)
- −$522
- Tax from tax record
- −$159 /mo · $1,913/yr
- Insurance
- −$41
- HOA
- −$0
- Vacancy / Maint / Mgmt
- −$268
- Net cashflow
- $287
Break-even live
UW: 25.0% down · 7.5% · 30yr · 1.5% tax · 5.0% vac · 8.0% maint · 8.0% mgmt
Financing live
Cash to close
- Down payment
- $24,893
- Closing costs
- $2,987
- Reserves months
- —
- Total cash needed
- —
Loan-product check · same deal, 3 products live
Conventional
25% down · 7.5% · 30yr
- Down + closing
- —
- Monthly P&I
- —
- Monthly cashflow
- —
- DSCR
- —
- Eligible?
- —
Personal DTI + credit; lowest rate.
DSCR
20% down · 8.5% · 30yr
- Down + closing
- —
- Monthly P&I
- —
- Monthly cashflow
- —
- DSCR
- —
- Eligible?
- —
No personal income docs; deal must DSCR.
Hard money
10% down · 12.0% · 12mo
- Down + closing
- —
- Monthly P&I
- —
- Monthly cashflow
- —
- DSCR
- —
- Eligible?
- —
Short-term bridge; refi at stabilization.
Rent comps 20 comps
| Address | Beds | Baths | Sqft | Rent | $/sqft | DOM | Units | Dist |
|---|---|---|---|---|---|---|---|---|
| 910 Miller Ave Unit 910 Fayetteville, NC | 2.0 | 2.0 | 1000 | $1,250 | $1.25 | 23d | 1 | 0.23mi |
| 3526 Furman Dr Fayetteville, NC | 3.0 | 1.5 | 1050 | $1,500 | $1.43 | 23d | 1 | 0.26mi |
| 1805 Wayne Ln Fayetteville, NC | 3.0 | 1.0 | 975 | $2,400 | $2.46 | 23d | 1 | 0.43mi |
| 1313 Ireland Dr Unit B Fayetteville, NC | 2.0 | 1.5 | 900 | $1,000 | $1.11 | 23d | 1 | 0.51mi |
| 1309 Ireland Dr Fayetteville, NC | 2.0 | 1.5 | 900 | $1,000 | $1.11 | 13d | 1 | 0.53mi |
| 4810 Alamance Rd Fayetteville, NC | 1.0–2.0 | 1.0–2.0 | 827 | $1,200 | $1.45 | 23d | 1 | 0.93mi |
| 4935 Walnut Dr Fayetteville, NC | 3.0 | 1.5 | 1024 | $1,200 | $1.17 | 13d | 1 | 0.98mi |
| 1005 Ancestry Dr #2 Fayetteville, NC | 2.0 | 2.0 | 950 | $995 | $1.05 | 13d | 1 | 1.00mi |
| 1031 Ancestry Dr Fayetteville, NC | 2.0 | 2.0 | 950 | $935 | $0.98 | 23d | 1 | 1.01mi |
| 1100 Marlborough Rd Fayetteville, NC | 2.0 | 2.0 | 1025 | $1,198 | $1.17 | 21d | 5 | 1.08mi |
| 1100 Marlborough Rd Fayetteville, NC | 2.0 | 2.0 | 1025 | $1,198 | $1.17 | 13d | 5 | 1.08mi |
| 29 Briar Cir Fayetteville, NC | 1.0–2.0 | 1.0–1.5 | 765 | $1,283 | $1.68 | 13d | 36 | 1.09mi |
| 3211 Tallywood Dr Fayetteville, NC | 1.0–3.0 | 1.0–1.5 | 925 | $999 | $1.08 | 23d | 1 | 1.12mi |
| 3209 Tallywood Dr Unit 06 Fayetteville, NC | 2.0 | 1.0 | 800 | $900 | $1.12 | 23d | 1 | 1.13mi |
| 3212 Tallywood Dr Unit 03 Fayetteville, NC | 2.0 | 1.0 | 900 | $900 | $1.00 | 23d | 1 | 1.14mi |
| 3210 Tallywood Dr #12 Fayetteville, NC | 3.0 | 1.5 | 1000 | $1,000 | $1.00 | 21d | 1 | 1.16mi |
| 3210 Tallywood Dr #04 Fayetteville, NC | 2.0 | 1.0 | 900 | $900 | $1.00 | 23d | 1 | 1.16mi |
| 3210 Tallywood Dr Unit 09 Fayetteville, NC | 2.0 | 1.0 | 900 | $900 | $1.00 | 21d | 1 | 1.16mi |
| 3918 Donna St Fayetteville, NC | 3.0 | 1.0 | 1000 | $1,350 | $1.35 | 23d | 1 | 1.39mi |
| 2621 Elcone Dr Unit 2621 Fayetteville, NC | 2.0 | 1.5 | 815 | $999 | $1.23 | 13d | 1 | 1.48mi |
Listing history 4 events
-
2026-03-31status Pending
-
2026-02-17$99,573 Active
-
1994-06-02soldstatus $55,000
-
1984-11-01soldstatus $27,000
ⓘ Source: listings_history table (triggers on properties + properties_extension) + one-shot
backfill from property_details.listing_events for pre-trigger history.
Tax reassessment forecast NC · Resets to sale price
- Current annual tax
- $1,913 · $159/mo
- Projected year-2 tax
- $1,913 · $159/mo
- Expected delta
- $0/yr ($0/mo · 0.0%)
ⓘ Screening estimate from a state-policy table — verify with the county assessor before closing.
Climate risk First Street
- Flood 1/10 Low FEMA zone X (unshaded) · 0% chance over 30 yrs
- Wildfire 2/10 Low
- Heat 7/10 Severe 7 d/yr ≥106°F today · 16 d/yr by 30 yrs out
- Wind 7/10 Severe 75% chance of damaging wind over 30 yrs
- Air quality 1/10 Low 0 unhealthy d/yr today · 0 by 30 yrs out
Nearby sold comps map
Loading sold comps map…
Walkable amenities ~0.75 mi
Loading nearby amenities…
Taxation est. · year 1
- Rental income
- $15,335
- − Mortgage interest
- −$5,578
- − Property taxes
- −$1,913
- − Insurance
- −$498
- − Repairs & maintenance
- −$1,227
- − Management
- −$1,227
- − Depreciation
- −$2,897
- Taxable income
- $1,997
- Est. tax owed @ 24.0%
- −$479
- After-tax cash flow
- $2,959/yr
For passive investors: Depreciation is non-cash, so a rental often shows a tax loss while cash-flowing — sheltering income. Rental losses are passive: they offset passive income freely, and up to $25,000/yr can offset ordinary (W-2) income if you actively participate and your MAGI is under $100k (phasing out to $0 by $150k); unused losses carry forward. On sale, claimed depreciation is recaptured at up to 25%, and gains may owe capital-gains tax (a 1031 exchange can defer both). Figures are a year-1 estimate at your 24.0% rate — not tax advice; consult a CPA.
Schools (NCES district)
- District
- Cumberland County Schools
- NCES district ID
- 3700011
- Math proficiency
- 32% ▼ -2.00%
- Reading proficiency
- 41% ▼ -1.00%
- Median HH income
- $44,168
- Composite
- 31.0/100
- National rank
- #6096
- State rank
- #126 of 178 in NC
Livability — Fayetteville
- Score
- 75/100
- State rank
- #45
- US rank
- #4031
Category grades
Schools grade is shown separately in the Schools card above.
Census & demographics
- Census place
- Fayetteville, NC
- County
- Cumberland County · 265,314 people
- City population
- 226,118
- Metro
- Fayetteville, NC
- Population (ZIP)
- 37,140
- Household income
- $58,563
- Rent vs Own
- Severe rent burden
- 1667.0
Population outlook (Cumberland County) Hauer SSP2
- Today (2025)
- 330,855 people
- By 2030
- 333,523 · +0.8%
- By 2040
- 335,583 · +1.4%
- By 2050
- 335,325 · +1.4%
- By 2075
- 342,853 · +3.6%
- By 2100
- 340,698 · +3.0%
Race, ethnicity, and origin ACS 2023
- Neighborhood character
- Highly diverse neighborhood (Simpson 0.70)
- Race & ethnicity
- Black 39% White 36% Hispanic / Latino 14% Two or more races 12% Asian 3% Native American 1%
- Hispanic origin (detail)
- Mexican 5% Puerto Rican 5%
- Common ancestry
- Slovak 2% Italian 1% Serbian 1%
- Foreign-born
- 8% · Canada, South Korea, Vietnam
- Languages at home
- 87% English-only · Spanish 9% Tagalog/Filipino 1% French/Haitian/Cajun 1%
Political lean MEDSL · Cumberland
- 2024 margin
- D (+13.4) · D 56.1% · R 42.7% · Other 1.2%
- 2008→2024 swing
- -4.3pp toward R · 2008: 17.7pp · 2024: 13.4pp
- All cycles
- 2024: D+13.4 2020: D+16.6 2016: D+16.0 2012: D+19.7 2008: D+17.7
Not yet ingested
- Civics
- —
Market trends
- HPI YoY
- ▼ -59.90%
- Current HPI
- 215.927
- Rent YoY
- ▲ 3.17%
- Metro
- Fayetteville, NC
- State GDP YoY
- ▲ 3.28%
- F500 in state
- 26
Industry mix (Fortune 500 HQ in NC)
| Industry | F500 HQs | Revenue |
|---|---|---|
| Financial Services | 2 | $213B |
|
||
| Retail | 2 | $95B |
|
||
| Industrial Conglomerate | 1 | $38B |
|
||
| Metals / Steel | 1 | $35B |
|
||
| Utilities | 1 | $30B |
|
||
| Industrial Machinery | 1 | $19B |
|
||
Price history
+268.8% since first listed4 events — show timeline
- 2026-03-31 Pending — LPRMLS
- 2026-02-17 Listed $99,573 LPRMLS
- 1994-06-02 Sold (Public Records) $55,000 Public Records
- 1984-11-01 Sold (Public Records) $27,000 Public Records
Property tax history
+4.4%/yrLatest (2025): $1,913 · +31.6% YoY. Source: county tax records.
Cash-flow waterfall
monthlySold comps — $/sqft
last 12 mo · ≤1 miLoading sold comps…