30 Mason St #502 · San Francisco, CA
Flood risk No data
- FEMA flood zone
- —
- Chance of flooding over 30 yrs
- —
- Est. flood insurance / yr
- —
Fire risk No data
- Est. fire insurance / yr
- —
Heat risk No data
- Hot days now (above threshold)
- —
- Hot days in 30 yrs
- —
Wind risk No data
- Chance of severe wind over 30 yrs
- —
Air-quality risk No data
- Unhealthy air days now
- —
- Unhealthy air days in 30 yrs
- —
Risk factors via First Street. Map © Google.
Why this score? — see what drove the D grade
The composite is a weighted blend of 9 inputs, each scored 0–100. Each bar is that input's sub-score; the figure is the points it added to the 100-point composite (weight × sub-score).
- ARV discount +15.0/15.0
- Appreciation +7.4/10.0
- Rent growth +5.0/5.0
- Schools +5.0/10.0
- Livability +3.8/5.0
- Condition / age +2.5/5.0
- Cash flow +1.5/30.0
- 1% rule +1.5/10.0
- DSCR +0.0/10.0
$479,000
🖨 Deal sheet (PDF) 📄 Offer letter ✓ Due diligence
Listing remarks MLS
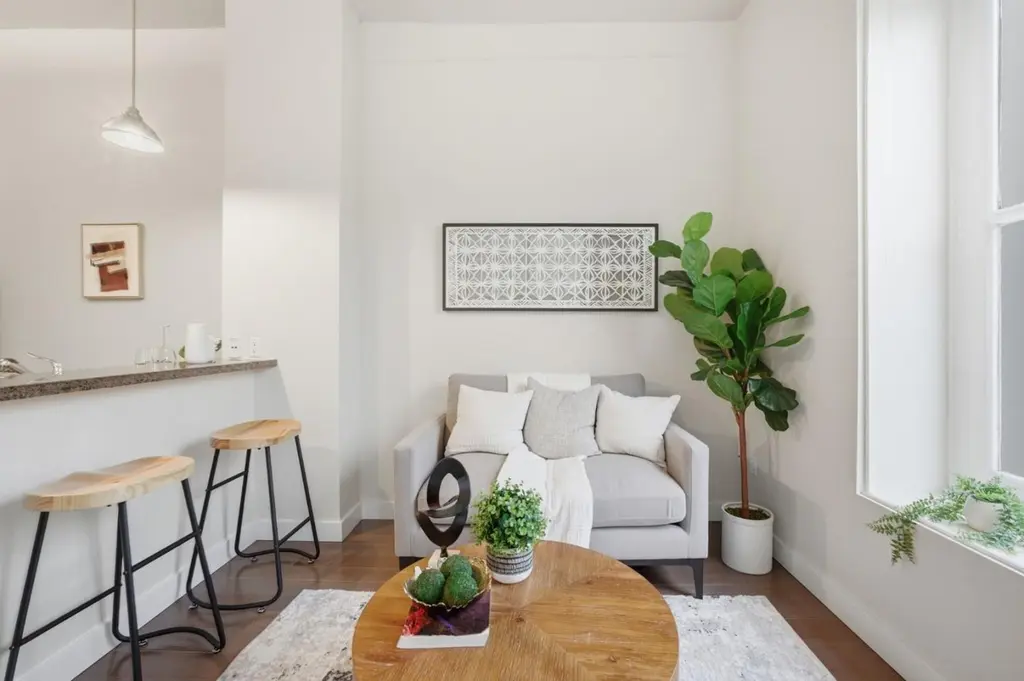
Live in the heart of downtown San Francisco at 30 Mason St #502, just steps from Union Square, world-class dining, shopping, and entertainment. This well-appointed junior studio condo offers 728 sqft of comfortable living space, featuring wood floors, updated light fixtures, and a bright, inviting living room filled with natural light. The functional kitchen is equipped with stainless steel appliances and granite countertops, providing both style and practicality. The spacious bedroom and bathroom offer a relaxing retreat in the middle of the city. Enjoy close proximity to San Francisco Museum of Modern Art, Yerba Buena Gardens, and convenient access to BART via Powell Street Station. Ideal for urban living, first-time buyers, or investors seeking a prime location with unbeatable walkability.
Key facts
- Functional kitchen
- Granite countertops
- $804 HOA
Tags
Neighborhood map
What this means for you Summary
Snapshot
- This is a 1-bed/1.0-bath condo listed at $479k.
Deal economics
- At list price, monthly cash flow is $-2k ($-23k/yr) — negative.
- To cash-flow at today's rent, offer at most $196k (59.0% below list).
- To meet the 1% rule (rent ≥ 1% of price), the offer needs to be $310k (35.2% below list).
- Recommended offer: $196k (59.0% below list) — sets the bar for cash-flow.
- Cap rate 1.6% vs local median 2.1% in San Francisco — below-typical yield; the buyer is paying a premium for something (appreciation thesis, condition, location) that the cap rate doesn't capture.
Location & tenants
- Location reads 76/100 on livability (#90 in CA, #3,143 nationally) — a middle-class / working-renter tenant base. Strengths: amenities A+, commute A+, employment A+; Watch: crime F, cost of living F.
- San Francisco Unified (urban): math 50% / reading 56% proficiency, ranked #322 of 1,400 in CA (top 23%) — acceptable for families but not a draw, mixed tenant base, ~2y average lease.
- Zoned schools: Lilienthal (Claire) Elementary (669 students, 19% FRL); Giannini (A.P.) Middle (1,192 students, 34% FRL); Lowell High (2,632 students, 37% FRL) — zoned schools average 30% FRL vs 49% district-wide (19 pts lower); this property's tenant base skews higher-income than the district average.
- Market conditions: Rents rising fast (+10.1%/yr); 63 active listings in the ZIP; 40 comparable units currently listed for rent nearby; rentals at typical pace (median 17d on market — plan ~3-4 weeks tenant-placement turnaround); 750 units permitted in San Francisco County in 2024 (688 in 5+ unit buildings).
- At $3,104/mo this rent would consume 62% of the median local household income ($60k/yr) (locally 3769% of renters already pay >50% of income on rent) — very limited rent-growth headroom before tenants either downsize or default.
Forward outlook
- In year one you build about $26k of equity ($3k loan paydown + $23k appreciation (4.8% local appreciation)).
- San Francisco County population projected at +39% by 2050 — long-run rental-demand tailwind backs the buy-and-hold thesis.
- By year 2, paydown + projected appreciation supports a ~$42k cash-out refi (75% LTV) — recoverable capital for the next deal without selling this one.
Negotiation context
- It's been on market 79 days — a 6% lower offer ($450k) is reasonable based on typical stale-listing flexibility.
- 2 sale attempts with the ask held roughly flat each time — persistent listings suggest the price (not the market) is what's stuck; bring a comps-based counter.
Risks & watch-outs
- Watch-outs: HOA is 26% of rent.
Questions for the listing agent
- What do current leases actually rent for vs. the listed asking? Can we see a recent rent roll and the last 12 months of T-12 income?
- It's been on market 79 days. Have you received any prior offers? Is the seller open to a 59% concession, seller financing, or rate buy-down credit?
- What does the HOA fee cover, when was the last increase, and are there any pending special assessments or reserve-fund shortfalls?
- Any open or pending special assessments — roof, HVAC, plumbing, elevator, façade? What's the per-unit balance and payoff schedule, and is the seller paying it off at close or rolling it to the buyer?
- Why hasn't it sold? Are there any deal-killer items the seller is aware of (foundation, flood, title, zoning, code violations)?
- Is there a deadline driving the sale (1031 exchange, divorce, estate, relocation)? That informs how much negotiation room exists.
- Schools are B-rated — typically a magnet for longer-tenancy family renters. What's the average tenant stay here, and is there a school-zone premium baked into asking?
- Crime grade is F in this area — have there been break-ins, vandalism, or insurance claims at this property in the last 3 years? What carrier currently insures it and at what premium?
- The area grade is low — what's the realistic commute time and amenity access for the typical tenant pool here? Any planned neighborhood developments (good or bad) we should know about?
- What's the average days-on-market for RENTAL listings here right now (not sales)? A rising rental-DOM trend means longer vacancies and softer asking-rent achievability than the comps imply.
- What's the recent tenant-quality profile in this submarket — average credit score on applications, eviction rate, late-payment / NSF rate, and stable-employment percentage? A property-management company in the area should have these aggregated.
- How much new apartment / multifamily construction is in the pipeline within 1–3 miles? Heavy new supply (>2% of stock underway) typically softens rents 12–24 months out; light construction supports rent growth.
Investment metrics
- 1% rule
- 0.65% ✗
- Cap rate
- 1.58%
- Cash-on-cash
- -16.84%
- DSCR
- 0.25
- GRM
- 12.9
CMA / ARV
- ARV (median comp)
- $617,962
- List price
- $479,000
- Delta
- -22.49%
- Verdict
- UNDERPRICED
- Comps
- 20 within 1.0 mi
Projected returns pro-forma
4.8% appreciation · 8.0% rent growth · sell at horizon
- IRR
- 0.2%
- Equity multiple
- 1.02×
- Total profit
- $2,100
- Equity at exit
- $265,559
- IRR
- 5.8%
- Equity multiple
- 2.14×
- Total profit
- $153,388
- Equity at exit
- $453,527
Cash invested: $134,120 (down + closing). Projections, not guarantees.
Landlord ↔ Tenant lean methodology
- Overall (CITY)
- 0 Strongly Tenant-Friendly
- State California
- 18 Strongly Tenant-Friendly · D+13
- County
- — inherits STATE
- City San Francisco
- 0 Strongly Tenant-Friendly · D+57
ZIP-level market 94102
- Home prices YoY
- 2.7%
- Rents YoY
- 10.1%
- Active inventory
- 63
- Price-to-rent
- 12.9×
Monthly cashflow live
- Estimated rent
- $3,104 high interval (Pro) →
- Mortgage (P&I)
- −$2,512
- Tax from tax record
- −$819 /mo · $9,824/yr
- Insurance
- −$200
- HOA
- −$804
- Vacancy / Maint / Mgmt
- −$652
- Net cashflow
- $-1,882
Break-even live
Sensitivity live
| Price | -10% $-1,611 | -5% $-1,746 | +0% $-1,882 | +5% $-2,017 | +10% $-2,153 |
|---|---|---|---|---|---|
| Rent | -10% $-2,127 | -5% $-2,004 | +0% $-1,882 | +5% $-1,759 | +10% $-1,637 |
| Rate | -1.0pp $-1,641 | -0.5pp $-1,760 | base $-1,882 | +0.5pp $-2,006 | +1.0pp $-2,132 |
UW: 25.0% down · 7.5% · 30yr · 1.5% tax · 5.0% vac · 8.0% maint · 8.0% mgmt
Financing live
Cash to close
- Down payment
- $119,750
- Closing costs
- $14,370
- Reserves months
- —
- Total cash needed
- —
Loan-product check · same deal, 3 products live
Conventional
25% down · 7.5% · 30yr
- Down + closing
- —
- Monthly P&I
- —
- Monthly cashflow
- —
- DSCR
- —
- Eligible?
- —
Personal DTI + credit; lowest rate.
DSCR
20% down · 8.5% · 30yr
- Down + closing
- —
- Monthly P&I
- —
- Monthly cashflow
- —
- DSCR
- —
- Eligible?
- —
No personal income docs; deal must DSCR.
Hard money
10% down · 12.0% · 12mo
- Down + closing
- —
- Monthly P&I
- —
- Monthly cashflow
- —
- DSCR
- —
- Eligible?
- —
Short-term bridge; refi at stabilization.
Rent comps 40 comps
| Address | Beds | Baths | Sqft | Rent | $/sqft | DOM | Units | Dist |
|---|---|---|---|---|---|---|---|---|
| 960 Market St San Francisco, CA | 1.0 | 1.0 | 613 | $4,295 | $7.01 | 24d | 1 | 0.07mi |
| 1028 Market St San Francisco, CA | 2.0 | 1.0 | 526 | $4,090 | $7.77 | 0d | 5 | 0.19mi |
| 434 Minna St San Francisco, CA | 2.0 | 1.0–2.0 | 719 | $5,224 | $7.26 | 0d | 15 | 0.20mi |
| 50 Jones St San Francisco, CA | 1.0 | 1.0 | 471 | $3,342 | $7.10 | 0d | 8 | 0.22mi |
| 570 Jessie St San Francisco, CA | — | 1.0 | 430 | $2,495 | $5.80 | 4d | 1 | 0.23mi |
| 1075 Market St #603 San Francisco, CA | — | 1.0 | 445 | $3,300 | $7.42 | 9d | 1 | 0.26mi |
| 1075 Market St San Francisco, CA | 1.0 | 1.0 | 546 | $3,500 | $6.40 | 26d | 2 | 0.27mi |
| 1075 Market St #461 San Francisco, CA | 1.0 | 1.0 | 648 | $3,460 | $5.34 | 22d | 1 | 0.27mi |
| 545 Ofarrell St San Francisco, CA | — | 1.0 | 400 | $2,000 | $5.00 | 45d | 1 | 0.28mi |
| 285 Turk St Apt 507 San Francisco, CA | 1.0 | 1.0 | 462 | $1,795 | $3.89 | 45d | 1 | 0.28mi |
| 555 Taylor St San Francisco, CA | — | 1.0 | 477 | $2,200 | $4.61 | 45d | 1 | 0.30mi |
| 434 Leavenworth St San Francisco, CA | — | 1.0 | 345 | $2,045 | $5.93 | 1d | 3 | 0.30mi |
| 639 Geary St San Francisco, CA | — | 1.0 | 453 | $2,606 | $5.75 | 1d | 8 | 0.30mi |
| 620 Jones St San Francisco, CA | — | 1.0 | 400 | $1,650 | $4.12 | 26d | 1 | 0.31mi |
| 540 Leavenworth St San Francisco, CA | 1.0 | 1.0 | 385 | $2,595 | $6.74 | 7d | 1 | 0.33mi |
| 536 Leavenworth St San Francisco, CA | — | 1.0 | 445 | $1,995 | $4.48 | 45d | 1 | 0.34mi |
| 676 Geary St San Francisco, CA | 1.0–2.0 | 1.0 | 616 | $3,245 | $5.26 | 3d | 2 | 0.35mi |
| 631 O'Farrell St San Francisco, CA | 1.0 | 1.0 | 520 | $2,495 | $4.80 | 22d | 1 | 0.35mi |
| 631 Ofarrell St #1110 San Francisco, CA | 1.0 | 1.0 | 520 | $2,495 | $4.80 | 9d | 1 | 0.35mi |
| 631 Ofarrell St San Francisco, CA | 1.0 | 1.0 | 520 | $2,248 | $4.32 | 17d | 2 | 0.35mi |
| 400 Clementina St #1449 San Francisco, CA | 1.0–2.0 | 1.0–2.0 | 775 | $3,970 | $5.12 | 4d | 2 | 0.35mi |
| 737 Post St San Francisco, CA | 2.0 | 1.0–2.0 | 515 | $3,873 | $7.51 | 1d | 10 | 0.36mi |
| 360 Hyde St San Francisco, CA | — | 1.0 | 415 | $1,795 | $4.33 | 45d | 1 | 0.38mi |
| 900 Folsom St San Francisco, CA | 2.0 | 1.0–2.0 | 863 | $5,118 | $5.93 | 0d | 27 | 0.38mi |
| 701 Taylor St San Francisco, CA | — | 1.0 | 423 | $2,875 | $6.80 | 4d | 1 | 0.38mi |
| 737 Bush St San Francisco, CA | 1.0 | 1.0 | 750 | $2,595 | $3.46 | 17d | 1 | 0.40mi |
| 765 Geary St San Francisco, CA | — | 1.0 | 343 | $1,695 | $4.93 | 45d | 1 | 0.40mi |
| 923 Folsom St San Francisco, CA | 1.0 | 1.0 | 630 | $3,831 | $6.08 | 0d | 1 | 0.41mi |
| 845 Sutter St San Francisco, CA | 1.0 | 1.0 | 700 | $2,895 | $4.14 | 16d | 1 | 0.41mi |
| 603 Natoma St Apt 406 San Francisco, CA | 1.0 | 1.0 | 556 | $2,950 | $5.31 | 45d | 1 | 0.41mi |
| 801 Jones St San Francisco, CA | — | 1.0 | 360 | $2,150 | $5.97 | 1d | 1 | 0.41mi |
| 84 Harriet St Unit A San Francisco, CA | 1.0 | 1.0 | 718 | $3,295 | $4.59 | 22d | 1 | 0.42mi |
| 947 Bush St San Francisco, CA | 1.0 | 1.0 | 390 | $3,810 | $9.76 | 1d | 2 | 0.42mi |
| 711 Leavenworth St Unit 1 San Francisco, CA | 1.0 | 1.0 | 400 | $1,895 | $4.74 | 20d | 1 | 0.42mi |
| 776 Bush St San Francisco, CA | — | 1.0 | 400 | $1,900 | $4.75 | 45d | 1 | 0.43mi |
| 725 Leavenworth St Unit 5 San Francisco, CA | 2.0 | 2.0 | 742 | $4,600 | $6.20 | 17d | 1 | 0.43mi |
| 829 Folsom St #408 San Francisco, CA | — | 1.0 | 495 | $2,860 | $5.78 | 17d | 1 | 0.44mi |
| 895 Sutter St San Francisco, CA | — | 1.0 | 455 | $2,150 | $4.73 | 45d | 1 | 0.44mi |
| 1188 Mission St San Francisco, CA | 1.0 | 1.0 | 448 | $3,394 | $7.57 | 0d | 16 | 0.44mi |
| 821 Folsom St #401 San Francisco, CA | 1.0 | 1.0 | 652 | $3,650 | $5.60 | 26d | 1 | 0.45mi |
HOA detail condo
- Monthly dues
- $804 · $9,648/yr
- Assessments
- None detected in remarks — confirm with the listing agent.
Listing history 18 events
-
2026-06-21days on market $479,000 Active 79 DOM
-
2026-06-18days on market $479,000 Active 76 DOM
-
2026-06-17days on market $479,000 Active 75 DOM
-
2026-06-16days on market $479,000 Active 74 DOM
-
2026-06-15days on market $479,000 Active 73 DOM
-
2026-06-13days on market $479,000 Active 71 DOM
-
2026-06-13days on market $479,000 Active 70 DOM
-
2026-06-09days on market $479,000 Active 67 DOM
-
2026-06-08days on market $479,000 Active 66 DOM
-
2026-06-07days on market $479,000 Active 65 DOM
-
2026-06-04days on market $479,000 Active 62 DOM
-
2026-06-03days on market $479,000 Active 61 DOM
-
2026-06-02days on market $479,000 Active 60 DOM
-
2026-06-01days on market $479,000 Active 59 DOM
-
2026-05-31days on market $479,000 Active 58 DOM
-
2026-04-03$499,000 Active 803-char remark
Show marketing remark (803 chars)
Live in the heart of downtown San Francisco at 30 Mason St #502, just steps from Union Square, world-class dining, shopping, and entertainment. This well-appointed junior studio condo offers 728 sqft of comfortable living space, featuring wood floors, updated light fixtures, and a bright, inviting living room filled with natural light. The functional kitchen is equipped with stainless steel appliances and granite countertops, providing both style and practicality. The spacious bedroom and bathroom offer a relaxing retreat in the middle of the city. Enjoy close proximity to San Francisco Museum of Modern Art, Yerba Buena Gardens, and convenient access to BART via Powell Street Station. Ideal for urban living, first-time buyers, or investors seeking a prime location with unbeatable walkability.
-
2017-03-02soldstatus $650,000
ⓘ Source: listings_history table (triggers on properties + properties_extension) + one-shot
backfill from property_details.listing_events for pre-trigger history.
Tax reassessment forecast CA · Resets to sale price
- Current annual tax
- $9,824 · $819/mo
- Projected year-2 tax
- $9,824 · $819/mo
- Expected delta
- $0/yr ($0/mo · 0.0%)
ⓘ Screening estimate from a state-policy table — verify with the county assessor before closing.
Nearby sold comps map
Loading sold comps map…
Walkable amenities ~0.75 mi
Loading nearby amenities…
Taxation est. · year 1
- Rental income
- $37,251
- − Mortgage interest
- −$26,831
- − Property taxes
- −$9,824
- − Insurance
- −$2,395
- − Repairs & maintenance
- −$2,980
- − Management
- −$2,980
- − HOA
- −$9,648
- − Depreciation
- −$13,935
- Taxable loss
- −$31,342
- Est. tax savings @ 24.0%
- +$7,522
- After-tax cash flow
- $-15,060/yr
For passive investors: Depreciation is non-cash, so a rental often shows a tax loss while cash-flowing — sheltering income. Rental losses are passive: they offset passive income freely, and up to $25,000/yr can offset ordinary (W-2) income if you actively participate and your MAGI is under $100k (phasing out to $0 by $150k); unused losses carry forward. On sale, claimed depreciation is recaptured at up to 25%, and gains may owe capital-gains tax (a 1031 exchange can defer both). Figures are a year-1 estimate at your 24.0% rate — not tax advice; consult a CPA.
Schools (NCES district)
- District
- San Francisco Unified
- NCES district ID
- 0634410
- Math proficiency
- 50% ▬ 0.00%
- Reading proficiency
- 56% ▲ 1.00%
- Median HH income
- $81,249
- Composite
- 50.14/100
- National rank
- #4088
- State rank
- #322 of 1400 in CA
Livability — San Francisco
- Score
- 76/100
- State rank
- #90
- US rank
- #3143
Category grades
Schools grade is shown separately in the Schools card above.
Census & demographics
- Census place
- San Francisco, CA
- County
- San Francisco County · 827,552 people
- City population
- 827,552
- Metro
- San Francisco-Oakland-Berkeley, CA
- Population (ZIP)
- 35,976
- Household income
- $60,431
- Rent vs Own
- Severe rent burden
- 3769.0
Population outlook (San Francisco County) Hauer SSP2
- Today (2025)
- 1,030,936 people
- By 2030
- 1,110,409 · +7.7%
- By 2040
- 1,270,010 · +23.2%
- By 2050
- 1,435,001 · +39.2%
- By 2075
- 1,779,074 · +72.6%
- By 2100
- 1,966,767 · +90.8%
Race, ethnicity, and origin ACS 2023
- Neighborhood character
- Highly diverse neighborhood (Simpson 0.77)
- Race & ethnicity
- White 31% Asian 28% Hispanic / Latino 22% Two or more races 13% Black 9% Native American 2%
- Hispanic origin (detail)
- Mexican 15% Puerto Rican 1%
- Common ancestry
- Scotch-Irish 2% Romanian 2% Lithuanian 2%
- Foreign-born
- 41% · Canada, China, Vietnam
- Languages at home
- 52% English-only · Spanish 16% Chinese 10% Vietnamese 5%
Political lean MEDSL · San Francisco
- 2024 margin
- Solid D (+64.8) · D 80.3% · R 15.5% · Other 4.1%
- 2008→2024 swing
- -5.7pp toward R · 2008: 70.5pp · 2024: 64.8pp
- All cycles
- 2024: D+64.8 2020: D+72.5 2016: D+76.1 2012: D+70.2 2008: D+70.5
Not yet ingested
- Civics
- —
Market trends
- HPI YoY
- ▲ 4.80%
- Current HPI
- 184.4403
- Rent YoY
- ▲ 10.11%
- Metro
- San Francisco-Oakland-Berkeley, CA
- State GDP YoY
- ▲ 3.21%
- F500 in state
- 116
Industry mix (Fortune 500 HQ in CA)
| Industry | F500 HQs | Revenue |
|---|---|---|
| Technology | 27 | $1,492B |
|
||
| Financial Services | 3 | $174B |
|
||
| Retail | 3 | $44B |
|
||
| Insurance | 3 | $26B |
|
||
| Media / Entertainment | 2 | $115B |
|
||
| Pharmaceuticals / Biotech | 2 | $62B |
|
||
Price history
-23.2% since first listed3 events — show timeline
- 2026-04-03 Listed $499,000 bridgeMLS, Bay East AOR, or Contra Costa AOR
- 2026-04-03 Listed $499,000 MLSListings
- 2017-03-02 Sold (Public Records) $650,000 Public Records
Property tax history
+4.8%/yrLatest (2025): $9,824 · +2.9% YoY. Source: county tax records.
Cash-flow waterfall
monthlySold comps — $/sqft
last 12 mo · ≤1 miLoading sold comps…