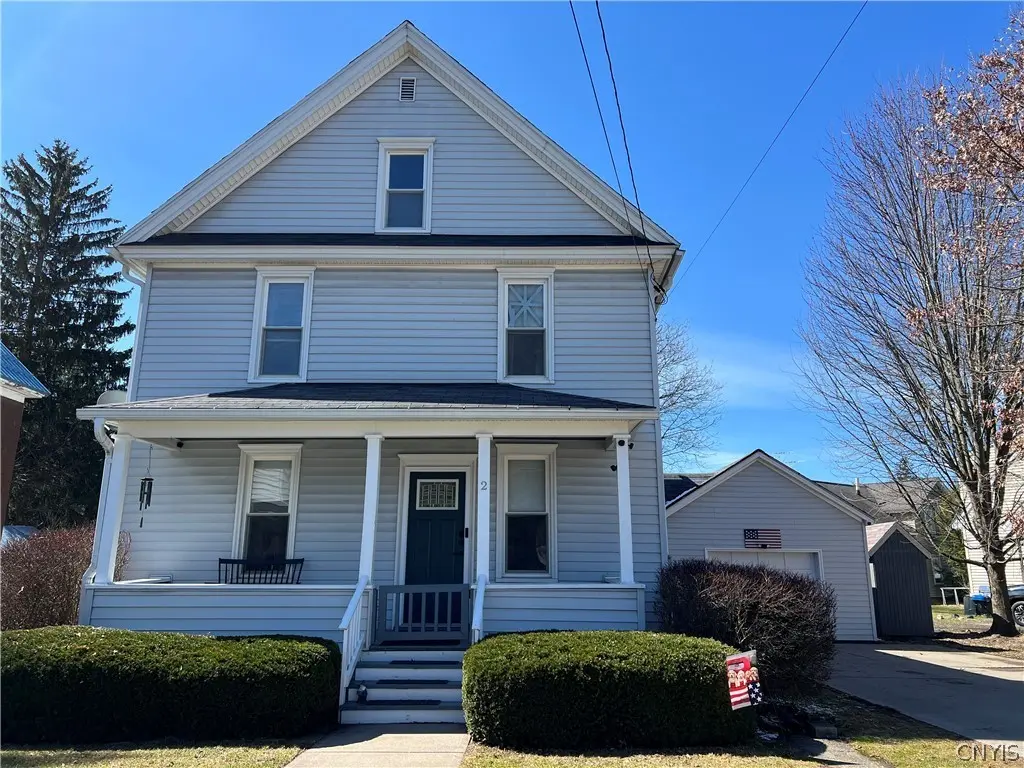
2 Delaware Ave · Cortland, NY
Flood risk 1/10 · Minimal
- FEMA flood zone
- X (unshaded)
- Chance of flooding over 30 yrs
- 0.0%
- Est. flood insurance / yr
- $473 – $860
Fire risk 3/10 · Minor
- Est. fire insurance / yr
- $691 – $1,283
Heat risk 2/10 · Minimal
- Hot days now (above 92°F)
- 8 days/yr
- Hot days in 30 yrs
- 17 days/yr
Wind risk 2/10 · Minimal
- Chance of severe wind over 30 yrs
- 1.0%
Air-quality risk 2/10 · Minimal
- Unhealthy air days now
- 0 days/yr
- Unhealthy air days in 30 yrs
- 1 days/yr
Risk factors via First Street. Map © Google.
Why this score? — see what drove the C+ grade
The composite is a weighted blend of 9 inputs, each scored 0–100. Each bar is that input's sub-score; the figure is the points it added to the 100-point composite (weight × sub-score).
- Cash flow +22.3/30.0
- ARV discount +9.3/15.0
- 1% rule +7.4/10.0
- DSCR +7.1/10.0
- Rent growth +4.6/5.0
- Schools +4.3/10.0
- Livability +3.9/5.0
- Condition / age +2.5/5.0
- Appreciation +0.0/10.0
$189,000
🖨 Deal sheet (PDF) 📄 Offer letter ✓ Due diligence
Listing remarks MLS
Lovely home in city close to downtown and college. Features include hardwood floors, eat-in kitchen, formal dining room, gas fireplace in cozy living room, updated bath, walk-up attic, detached garage, fenced yard for privacy, newer roof, vinyl siding and windows. A great value!
Key facts
- Updated flooring
- 6,133 sq ft lot
- Garage
Tags
Neighborhood map
What this means for you Summary
Snapshot
- This is a 4-bed/1.0-bath single-family listed at $189k.
Deal economics
- At list price, monthly cash flow is $312 ($4k/yr) — positive.
- The deal already cash-flows at list — no discount required.
- Meets the 1% rule at list price ($2k rent vs $189k).
- Cap rate 8.3% vs local median 6.2% in Cortland — top-decile yield for the area; either an underpriced asset or a hidden risk that comps aren't pricing in. Stress-test before assuming the spread holds.
Location & tenants
- Location reads 77/100 on livability (#201 in NY, #3,105 nationally) — a middle-class / working-renter tenant base. Strengths: cost of living A+, housing A+, health & safety A+; Watch: crime C-, schools D+, employment D.
- Cortland City School District (town): math 49% / reading 54% proficiency, ranked #368 of 590 in NY (top 62%) — acceptable for families but not a draw, mixed tenant base, ~2y average lease.
- Market conditions: Rents rising fast (+8.4%/yr); 141 active listings in the ZIP; 5 comparable units currently listed for rent nearby; rentals lingering (median 45d on market — plan ~5-8 weeks vacancy on turnover, expect pricing pressure); 100% of comp listings sitting > 30 days — soft ceiling on asking rent; 45 units permitted in Cortland County in 2024 (12 in 5+ unit buildings).
- This rent runs 40% of the median local income ($70k/yr) — at the standard rent-burdened threshold; future hikes will face affordability resistance.
Forward outlook
- Local home prices are declining (-3.0%/yr); year-one equity from $1k of loan paydown is wiped out by about $6k of value loss. Plan a longer hold.
- Cortland County population projected at -15% by 2050 — secular population decline; favor cash flow + early exit over multi-decade hold.
- At projected returns (-3.0% appreciation + 8.0% rent growth), your $53k cash investment doubles in ~8 years — after that, you're playing with house money.
Negotiation context
- Only 13 days on market — expect competitive offers; lowballing is unlikely to land.
- 2 sale attempts since 10y ago with the ask held roughly flat each time — persistent listings suggest the price (not the market) is what's stuck; bring a comps-based counter.
- Current owner paid $95k; list at $189k implies a 98% gain — meaningful room to come down on a strong offer.
Risks & watch-outs
- Watch-outs: property tax is 3.0% of price; built in 1890 — expect roof / HVAC / electrical / plumbing capex.
Questions for the listing agent
- Built in 1890 — when were the roof, HVAC, electrical panel, plumbing, and water heater last replaced?
- Property tax is high relative to price — has the assessment been appealed recently, and will the sale trigger a re-assessment?
- Is there a deadline driving the sale (1031 exchange, divorce, estate, relocation)? That informs how much negotiation room exists.
- Schools are D-rated, which usually means shorter tenancies and higher turnover. Who's the typical renter profile here, and what's been the actual vacancy rate?
- What's the average days-on-market for RENTAL listings here right now (not sales)? A rising rental-DOM trend means longer vacancies and softer asking-rent achievability than the comps imply.
- What's the recent tenant-quality profile in this submarket — average credit score on applications, eviction rate, late-payment / NSF rate, and stable-employment percentage? A property-management company in the area should have these aggregated.
- How much new for-sale + rental construction is in the pipeline within 1–3 miles? Heavy new supply typically softens prices + rents 12–24 months out; constrained supply supports both.
Investment metrics
- 1% rule
- 1.24% ✓
- Cap rate
- 8.27%
- Cash-on-cash
- 7.06%
- DSCR
- 1.31
- GRM
- 6.7
CMA / ARV
- ARV (on-the-fly)
- $196,850
- Comps found
- 12
Show comp detail 12 sales within ~0.75 mi
| Address | Dist | Beds/Ba | Sqft | Sold | Price | $/sf | Match |
|---|---|---|---|---|---|---|---|
| 8 Pearl St | 0.14mi | 4/2.0 | 1,569 (+1%) | 7mo | $180,000 | $115 | 81 |
| 10 Levydale Park | 0.37mi | 3/2.0 (-1) | 1,532 (-1%) | 1mo | $219,000 | $143 | 71 |
| 1224 Louise Dr | 0.41mi | 3/2.0 (-1) | 1,566 (+1%) | 4mo | $240,500 | $154 | 67 |
| 1 Yates Pl | 0.31mi | 3/1.5 (-1) | 1,444 (-7%) | 4mo | $179,000 | $124 | 64 |
| 10 Otter Creek Pl | 0.71mi | 4/2.0 | 1,520 (-2%) | 8mo | $90,000 | $59 | 54 |
| 148 Groton Ave | 0.75mi | 4/1.5 | 1,556 (+0%) | 11mo | $179,000 | $115 | 53 |
| 1103 Halstead Rd | 0.71mi | 3/2.5 (-1) | 1,559 (+1%) | 3mo | $353,000 | $226 | 53 |
| 65 Owego St | 0.29mi | 3/1.0 (-1) | 1,332 (-14%) | 7mo | $109,000 | $82 | 52 |
| 17 Lansing Ave | 0.23mi | 3/1.0 (-1) | 1,332 (-14%) | 11mo | $180,000 | $135 | 52 |
| 11 Randall St | 0.69mi | 4/2.0 | 1,507 (-3%) | 10mo | $187,000 | $124 | 51 |
| 169 171 Groton Ave | 0.74mi | 3/1.5 (-1) | 1,504 (-3%) | 11mo | $225,000 | $150 | 44 |
| 12 Ellwood Ave | 0.68mi | 3/1.5 (-1) | 1,740 (+12%) | 7mo | $221,325 | $127 | 35 |
Match score weights: distance 35% · size 25% · config 20% · recency 20%. Top-matched comps best support the ARV.
Projected returns pro-forma
-3.0% appreciation · 8.0% rent growth · sell at horizon
- IRR
- 0.9%
- Equity multiple
- 1.03×
- Total profit
- $1,829
- Equity at exit
- $28,181
- IRR
- 15.5%
- Equity multiple
- 2.60×
- Total profit
- $84,457
- Equity at exit
- $16,341
Cash invested: $52,920 (down + closing). Projections, not guarantees.
Landlord ↔ Tenant lean methodology
- Overall (STATE)
- 15 Strongly Tenant-Friendly
- State New York
- 15 Strongly Tenant-Friendly · D+10
- County
- — inherits STATE
- City
- — inherits STATE
ZIP-level market 13045
- Home prices YoY
- -9.3%
- Rents YoY
- 8.4%
- Active inventory
- 141
- Price-to-rent
- 6.7×
Monthly cashflow live
- Estimated rent
- $2,352 medium interval (Pro) →
- Mortgage (P&I)
- −$991
- Tax from tax record
- −$477 /mo · $5,718/yr
- Insurance
- −$79
- HOA
- −$0
- Vacancy / Maint / Mgmt
- −$494
- Net cashflow
- $312
Break-even live
Sensitivity live
| Price | -10% $419 | -5% $365 | +0% $312 | +5% $258 | +10% $205 |
|---|---|---|---|---|---|
| Rent | -10% $126 | -5% $219 | +0% $312 | +5% $404 | +10% $497 |
| Rate | -1.0pp $407 | -0.5pp $360 | base $312 | +0.5pp $263 | +1.0pp $213 |
UW: 25.0% down · 7.5% · 30yr · 1.5% tax · 5.0% vac · 8.0% maint · 8.0% mgmt
Financing live
Cash to close
- Down payment
- $47,250
- Closing costs
- $5,670
- Reserves months
- —
- Total cash needed
- —
Loan-product check · same deal, 3 products live
Conventional
25% down · 7.5% · 30yr
- Down + closing
- —
- Monthly P&I
- —
- Monthly cashflow
- —
- DSCR
- —
- Eligible?
- —
Personal DTI + credit; lowest rate.
DSCR
20% down · 8.5% · 30yr
- Down + closing
- —
- Monthly P&I
- —
- Monthly cashflow
- —
- DSCR
- —
- Eligible?
- —
No personal income docs; deal must DSCR.
Hard money
10% down · 12.0% · 12mo
- Down + closing
- —
- Monthly P&I
- —
- Monthly cashflow
- —
- DSCR
- —
- Eligible?
- —
Short-term bridge; refi at stabilization.
Rent comps 5 comps
| Address | Beds | Baths | Sqft | Rent | $/sqft | DOM | Units | Dist |
|---|---|---|---|---|---|---|---|---|
| 31 James St Cortland, NY | 3.0 | 1.5 | 1319 | $3,600 | $2.73 | 44d | 1 | 0.52mi |
| 109 Main St Unit 2 and 4 Cortland, NY | 3.0 | 1.0 | 1200 | $1,775 | $1.48 | 44d | 1 | 0.78mi |
| 16 Pendleton St #1 Cortland, NY | 3.0 | 1.0 | 2000 | $1,400 | $0.70 | 44d | 1 | 1.32mi |
| 88 Clinton Ave Cortland, NY | 3.0 | 1.0 | 1100 | $1,600 | $1.45 | 44d | 1 | 1.34mi |
| 951 New York 13 Cortland, NY | 1.0–4.0 | 1.0–2.0 | 1100 | $1,900 | $1.73 | 44d | 19 | 1.42mi |
Listing history 7 events
-
2026-04-07status Pending
-
2026-03-31historical Active Under Contract
-
2026-03-25$189,000 Active
-
2016-05-26soldstatus $95,400
-
2016-05-23soldstatus $90,000 279-char remark
Show marketing remark (279 chars)
Lovely home in city close to downtown and college. Features include hardwood floors, eat-in kitchen, formal dining room, gas fireplace in cozy living room, updated bath, walk-up attic, detached garage, fenced yard for privacy, newer roof, vinyl siding and windows. A great value!
-
2016-02-12$98,400 279-char remark
Show marketing remark (279 chars)
Lovely home in city close to downtown and college. Features include hardwood floors, eat-in kitchen, formal dining room, gas fireplace in cozy living room, updated bath, walk-up attic, detached garage, fenced yard for privacy, newer roof, vinyl siding and windows. A great value!
-
2005-10-25soldstatus $77,380
ⓘ Source: listings_history table (triggers on properties + properties_extension) + one-shot
backfill from property_details.listing_events for pre-trigger history.
Tax reassessment forecast NY · Partial reset (capped growth)
- Current annual tax
- $5,718 · $477/mo
- Projected year-2 tax
- $5,718 · $477/mo
- Expected delta
- $0/yr ($0/mo · 0.0%)
ⓘ Screening estimate from a state-policy table — verify with the county assessor before closing.
Climate risk First Street
- Flood 1/10 Low FEMA zone X (unshaded) · 0% chance over 30 yrs
- Wildfire 3/10 Moderate
- Heat 2/10 Low 8 d/yr ≥92°F today · 17 d/yr by 30 yrs out
- Wind 2/10 Low 100% chance of damaging wind over 30 yrs
- Air quality 2/10 Low 0 unhealthy d/yr today · 1 by 30 yrs out
Nearby sold comps map
Loading sold comps map…
Walkable amenities ~0.75 mi
Loading nearby amenities…
Taxation est. · year 1
- Rental income
- $28,222
- − Mortgage interest
- −$10,587
- − Property taxes
- −$5,718
- − Insurance
- −$945
- − Repairs & maintenance
- −$2,258
- − Management
- −$2,258
- − Depreciation
- −$5,498
- Taxable income
- $958
- Est. tax owed @ 24.0%
- −$230
- After-tax cash flow
- $3,509/yr
For passive investors: Depreciation is non-cash, so a rental often shows a tax loss while cash-flowing — sheltering income. Rental losses are passive: they offset passive income freely, and up to $25,000/yr can offset ordinary (W-2) income if you actively participate and your MAGI is under $100k (phasing out to $0 by $150k); unused losses carry forward. On sale, claimed depreciation is recaptured at up to 25%, and gains may owe capital-gains tax (a 1031 exchange can defer both). Figures are a year-1 estimate at your 24.0% rate — not tax advice; consult a CPA.
Schools (NCES district)
- District
- Cortland City School District
- NCES district ID
- 3608460
- Math proficiency
- 49% ▲ 6.00%
- Reading proficiency
- 54% ▲ 17.00%
- Median HH income
- $42,413
- Composite
- 43.29/100
- National rank
- #3041
- State rank
- #368 of 590 in NY
Livability — Cortland
- Score
- 77/100
- State rank
- #201
- US rank
- #3105
Category grades
Schools grade is shown separately in the Schools card above.
Census & demographics
- Census place
- Cortland, NY
- County
- Cortland County · 28,361 people
- City population
- 28,361
- Metro
- Cortland, NY
- Population (ZIP)
- 28,361
- Household income
- $69,961
- Rent vs Own
- Severe rent burden
- 1488.0
Population outlook (Cortland County) Hauer SSP2
- Today (2025)
- 47,543 people
- By 2030
- 46,107 · -3.0%
- By 2040
- 43,122 · -9.3%
- By 2050
- 40,216 · -15.4%
- By 2075
- 34,717 · -27.0%
- By 2100
- 28,953 · -39.1%
Race, ethnicity, and origin ACS 2023
- Neighborhood character
- Predominantly White (87%)
- Race & ethnicity
- White 87% Two or more races 5% Hispanic / Latino 5% Black 3% Asian 2%
- Common ancestry
- Romanian 4% Lithuanian 2% Italian 2%
- Foreign-born
- 3% · Canada, China
- Languages at home
- 94% English-only · Spanish 2% Russian/Polish/Slavic 2% Other Indo-European 1%
Political lean MEDSL · Cortland
- 2024 margin
- Lean R (+6.4) · D 46.8% · R 53.2%
- 2008→2024 swing
- -16.4pp toward R · 2008: 10.0pp · 2024: -6.4pp
- All cycles
- 2024: R+6.4 2020: R+1.9 2016: R+6.7 2012: D+8.8 2008: D+10.0
Not yet ingested
- Civics
- —
Market trends
- HPI YoY
- ▼ -29.78%
- Current HPI
- 289.515
- Rent YoY
- ▲ 8.37%
- Metro
- Cortland, NY
- State GDP YoY
- ▲ 2.60%
- F500 in state
- 92
Industry mix (Fortune 500 HQ in NY)
| Industry | F500 HQs | Revenue |
|---|---|---|
| Financial Services | 10 | $950B |
|
||
| Consumer Goods | 9 | $162B |
|
||
| Insurance | 4 | $225B |
|
||
| Telecommunications | 2 | $144B |
|
||
| Pharmaceuticals | 2 | $112B |
|
||
| Media / Entertainment | 2 | $69B |
|
||
Price history
+144.2% since first listed7 events — show timeline
- 2026-04-07 Pending — CNYIS
- 2026-03-31 Contingent — CNYIS
- 2026-03-25 Listed $189,000 CNYIS
- 2016-05-26 Sold (Public Records) $95,400 Public Records
- 2016-05-23 Sold (MLS) $90,000 CNYIS
- 2016-02-12 Listed $98,400 CNYIS
- 2005-10-25 Sold (Public Records) $77,380 Public Records
Property tax history
+4.7%/yrLatest (2025): $5,718 · +4.2% YoY. Source: county tax records.
Cash-flow waterfall
monthlySold comps — $/sqft
last 12 mo · ≤1 miLoading sold comps…