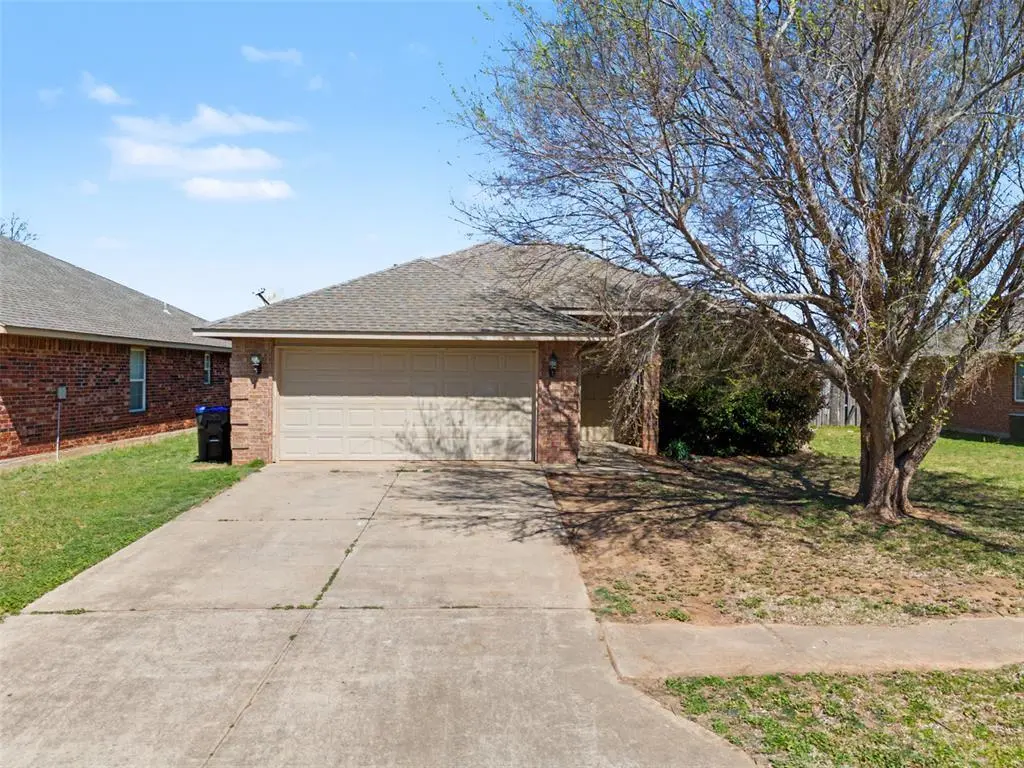
2137 Scissortail Landing Dr · Edmond, OK
Flood risk 1/10 · Minimal
- FEMA flood zone
- X (unshaded)
- Chance of flooding over 30 yrs
- 0.0%
- Est. flood insurance / yr
- $507 – $1,088
Fire risk 4/10 · Minor
- Est. fire insurance / yr
- $2,463 – $4,575
Heat risk 6/10 · Moderate
- Hot days now (above 108°F)
- 7 days/yr
- Hot days in 30 yrs
- 19 days/yr
Wind risk 2/10 · Minimal
- Chance of severe wind over 30 yrs
- 4.0%
Air-quality risk 2/10 · Minimal
- Unhealthy air days now
- 1 days/yr
- Unhealthy air days in 30 yrs
- 1 days/yr
Risk factors via First Street. Map © Google.
Why this score? — see what drove the D grade
The composite is a weighted blend of 9 inputs, each scored 0–100. Each bar is that input's sub-score; the figure is the points it added to the 100-point composite (weight × sub-score).
- Cash flow +12.3/30.0
- ARV discount +9.9/15.0
- Livability +3.9/5.0
- DSCR +3.7/10.0
- Schools +3.6/10.0
- 1% rule +3.1/10.0
- Rent growth +2.8/5.0
- Condition / age +2.5/5.0
- Appreciation +0.0/10.0
$245,000
🖨 Deal sheet (PDF) 📄 Offer letter ✓ Due diligence
Listing remarks
Motivated Seller! This home has been well lived in as a rental for many years. In a well established/desirable Edmond neighborhood. Great opportunity for 1st time buyer OR investment opportunity with strong rental potential. New roof 3/2026 , New Carpet 4/10/2026
Key facts
- 7,148 sq ft lot
- 2 garage spots
- Built 2005
Property features AI
Finance
- Other: Scissortail Landing subdivision (Scissortail Landing 1st); Directions: North of 192nd on May Ave to second entrance of subdivision; left on Scissortail Landing Dr.
- Financial info: Current list price $245,000; Loan qualification: Yes; Not assumable
- HOA & community: Mandatory association dues; Association fee $247/month; Association dues cover common area maintenance
Exterior
- Parking: 2-car garage
- Utilities: Homestead: Yes
- Home design: Single-family residence; Residential property; Entry level: One
- Construction: Brick and frame construction; Composition roof (roof year 2026); Slab foundation; Existing property
- Exterior features: Covered patio; Interior lot
Interior
- Bedrooms: 4 bedrooms
- Bathrooms: 2 full bathrooms
- Heating & cooling: Gas log fireplace (1)
- Interior features: One-level living; Living area (per assessor) of 1,628
Neighborhood map
What this means for you Summary
Snapshot
- This is a 4-bed/2.0-bath single-family listed at $245k.
Deal economics
- At list price, monthly cash flow is $-43 ($-515/yr) — negative.
- To cash-flow at today's rent, offer at most $237k (3.1% below list).
- To meet the 1% rule (rent ≥ 1% of price), the offer needs to be $200k (18.5% below list).
- Recommended offer: $200k (18.5% below list) — sets the bar for 1% rule.
- Cap rate 6.1% vs local median 3.4% in Edmond — top-decile yield for the area; either an underpriced asset or a hidden risk that comps aren't pricing in. Stress-test before assuming the spread holds.
Location & tenants
- Location reads 78/100 on livability (#6 in OK, #2,383 nationally) — a middle-class / working-renter tenant base. Strengths: employment A+, housing A+, crime A-; Watch: health & safety C-, commute F.
- Edmond (suburban): math 38% / reading 40% proficiency, ranked #11 of 270 in OK (top 4%) — families likely to look elsewhere, expect single-tenant / working-renter base with shorter leases.
- Zoned schools: Frontier Es (math 42% / reading 48%, grade D-, #60 of 845 statewide, top 7%, 826 students, 0% FRL); Summit Ms (math 22% / reading 27%, grade F, #97 of 345 statewide, top 31%, 940 students, 0% FRL); Santa Fe Hs (math 36% / reading 52%, grade F, #18 of 447 statewide, top 4%, 2,796 students, 0% FRL) — zoned schools average 0% FRL vs 22% district-wide (22 pts lower); this property's tenant base skews higher-income than the district average.
- Market conditions: Rents rising (+1.2%/yr); 647 active listings in the ZIP; 14 comparable units currently listed for rent nearby; rentals leasing fast (median 6d on market — plan ~1-2 weeks tenant-placement turnaround); high-income renter base; 5,365 units permitted in Oklahoma County in 2024 (569 in 5+ unit buildings).
Forward outlook
- Local home prices are declining (-3.0%/yr); year-one equity from $2k of loan paydown is wiped out by about $7k of value loss. Plan a longer hold.
- Oklahoma County population projected at +41% by 2050 — long-run rental-demand tailwind backs the buy-and-hold thesis.
Negotiation context
- It's been on market 39 days — a 3% lower offer ($238k) is reasonable based on typical stale-listing flexibility.
Risks & watch-outs
- Climate carrying-cost: extreme-heat days projected 7→19/yr by 2055 (HVAC capex compounding) — expect insurance premiums to compound above CPI over the hold.
Questions for the listing agent
- What do current leases actually rent for vs. the listed asking? Can we see a recent rent roll and the last 12 months of T-12 income?
- It's been on market 39 days. Have you received any prior offers? Is the seller open to a 19% concession, seller financing, or rate buy-down credit?
- What does the HOA fee cover, when was the last increase, and are there any pending special assessments or reserve-fund shortfalls?
- Is there a deadline driving the sale (1031 exchange, divorce, estate, relocation)? That informs how much negotiation room exists.
- Schools are A-rated — typically a magnet for longer-tenancy family renters. What's the average tenant stay here, and is there a school-zone premium baked into asking?
- The area grade is low — what's the realistic commute time and amenity access for the typical tenant pool here? Any planned neighborhood developments (good or bad) we should know about?
- What's the average days-on-market for RENTAL listings here right now (not sales)? A rising rental-DOM trend means longer vacancies and softer asking-rent achievability than the comps imply.
- What's the recent tenant-quality profile in this submarket — average credit score on applications, eviction rate, late-payment / NSF rate, and stable-employment percentage? A property-management company in the area should have these aggregated.
- How much new for-sale + rental construction is in the pipeline within 1–3 miles? Heavy new supply typically softens prices + rents 12–24 months out; constrained supply supports both.
Investment metrics
- 1% rule
- 0.81% ✗
- Cap rate
- 6.08%
- Cash-on-cash
- -0.75%
- DSCR
- 0.97
- GRM
- 10.2
CMA / ARV
- ARV (on-the-fly)
- $258,852
- Comps found
- 12
Show comp detail 12 sales within ~0.75 mi
| Address | Dist | Beds/Ba | Sqft | Sold | Price | $/sf | Match |
|---|---|---|---|---|---|---|---|
| 2137 Scissortail Landing Dr | 0.00mi | 4/2.0 | 1,628 (0%) | 1mo | $222,500 | $137 | 99 |
| 2148 Melody Dr | 0.22mi | 3/2.0 (-1) | 1,574 (-3%) | 1mo | $250,000 | $159 | 79 |
| 1925 Olde School Rd | 0.42mi | 4/2.0 | 1,606 (-1%) | 3mo | $255,500 | $159 | 76 |
| 2218 Melody Dr | 0.21mi | 4/2.0 | 1,747 (+7%) | 4mo | $265,000 | $152 | 74 |
| 21998 Homesteaders Dr | 0.49mi | 4/2.0 | 1,622 (-0%) | 6mo | $223,500 | $138 | 71 |
| 21865 Homesteaders Pl | 0.36mi | 3/2.0 (-1) | 1,558 (-4%) | 2mo | $199,000 | $128 | 70 |
| 21222 Robin Ridge Ln | 0.12mi | 3/2.0 (-1) | 1,388 (-15%) | 7mo | $249,000 | $179 | 59 |
| 21969 Homesteaders Pl | 0.44mi | 3/2.0 (-1) | 1,475 (-9%) | 1mo | $250,000 | $169 | 58 |
| 2322 Melody Dr | 0.24mi | 3/2.0 (-1) | 1,827 (+12%) | 7mo | $240,000 | $131 | 58 |
| 21877 Homesteaders Rd | 0.39mi | 3/2.0 (-1) | 1,771 (+9%) | 6mo | $260,000 | $147 | 57 |
| 21919 Pleasant Ridge Rd | 0.46mi | 3/2.0 (-1) | 1,512 (-7%) | 5mo | $250,000 | $165 | 57 |
| 3300 Porter Dr | 0.75mi | 4/2.0 | 1,800 (+11%) | 4mo | $384,840 | $214 | 44 |
Match score weights: distance 35% · size 25% · config 20% · recency 20%. Top-matched comps best support the ARV.
Projected returns pro-forma
-3.0% appreciation · 1.21% rent growth · sell at horizon
- IRR
- -19.5%
- Equity multiple
- 0.33×
- Total profit
- $-45,981
- Equity at exit
- $36,530
- IRR
- -16.3%
- Equity multiple
- 0.16×
- Total profit
- $-57,600
- Equity at exit
- $21,183
Cash invested: $68,600 (down + closing). Projections, not guarantees.
Landlord ↔ Tenant lean methodology
- Overall (STATE)
- 83 Strongly Landlord-Friendly
- State Oklahoma
- 83 Strongly Landlord-Friendly · R+20
- County
- — inherits STATE
- City
- — inherits STATE
ZIP-level market 73012
- Home prices YoY
- -17.9%
- Rents YoY
- 1.2%
- Active inventory
- 647
- Price-to-rent
- 10.2×
Monthly cashflow live
- Estimated rent
- $1,996 high interval (Pro) →
- Mortgage (P&I)
- −$1,285
- Tax from tax record
- −$212 /mo · $2,539/yr
- Insurance
- −$102
- HOA
- −$21
- Vacancy / Maint / Mgmt
- −$419
- Net cashflow
- $-43
Break-even live
Sensitivity live
| Price | -10% $96 | -5% $26 | +0% $-43 | +5% $-112 | +10% $-182 |
|---|---|---|---|---|---|
| Rent | -10% $-201 | -5% $-122 | +0% $-43 | +5% $36 | +10% $115 |
| Rate | -1.0pp $80 | -0.5pp $19 | base $-43 | +0.5pp $-106 | +1.0pp $-171 |
UW: 25.0% down · 7.5% · 30yr · 1.5% tax · 5.0% vac · 8.0% maint · 8.0% mgmt
Financing live
Cash to close
- Down payment
- $61,250
- Closing costs
- $7,350
- Reserves months
- —
- Total cash needed
- —
Loan-product check · same deal, 3 products live
Conventional
25% down · 7.5% · 30yr
- Down + closing
- —
- Monthly P&I
- —
- Monthly cashflow
- —
- DSCR
- —
- Eligible?
- —
Personal DTI + credit; lowest rate.
DSCR
20% down · 8.5% · 30yr
- Down + closing
- —
- Monthly P&I
- —
- Monthly cashflow
- —
- DSCR
- —
- Eligible?
- —
No personal income docs; deal must DSCR.
Hard money
10% down · 12.0% · 12mo
- Down + closing
- —
- Monthly P&I
- —
- Monthly cashflow
- —
- DSCR
- —
- Eligible?
- —
Short-term bridge; refi at stabilization.
Rent comps 14 comps
| Address | Beds | Baths | Sqft | Rent | $/sqft | DOM | Units | Dist |
|---|---|---|---|---|---|---|---|---|
| 2145 Scissortail Landing Dr Edmond, OK | 4.0 | 2.0 | 1800 | $1,795 | $1.00 | 3d | 1 | 0.01mi |
| 21925 Homesteaders Rd Edmond, OK | 3.0 | 2.0 | 1433 | $2,100 | $1.47 | 18d | 1 | 0.43mi |
| 2317 NW 198th St Edmond, OK | 3.0 | 2.0 | 1320 | $1,700 | $1.29 | 25d | 1 | 1.05mi |
| 2364 NW 197th St Edmond, OK | 3.0 | 2.0 | 1250 | $1,595 | $1.28 | 3d | 1 | 1.14mi |
| 19704 Vivace Dr Edmond, OK | 3.0 | 2.0 | 1450 | $1,699 | $1.17 | 3d | 1 | 1.20mi |
| 19704 Taggert Dr Edmond, OK | 3.0 | 2.0 | 1330 | $1,645 | $1.24 | 6d | 1 | 1.21mi |
| 19601 N Pennsylvania Ave Edmond, OK | 3.0 | 2.5 | 1441 | $1,745 | $1.21 | 3d | 1 | 1.22mi |
| 19708 Barrister Cir Edmond, OK | 3.0 | 2.0 | 1257 | $1,595 | $1.27 | 3d | 1 | 1.23mi |
| 19501 N Pennsylvania Ave Edmond, OK | 2.0–3.0 | 1.0–2.0 | 1122 | $1,750 | $1.56 | 3d | 11 | 1.30mi |
| 19804 Canning Ct Edmond, OK | 3.0 | 2.0 | 1875 | $2,595 | $1.38 | 18d | 1 | 1.32mi |
| 19717 Whitley Rd Edmond, OK | 4.0 | 2.0 | 1701 | $1,995 | $1.17 | 18d | 1 | 1.39mi |
| 19613 Bolton Rd Edmond, OK | 3.0 | 2.0 | 1340 | $1,795 | $1.34 | 3d | 1 | 1.41mi |
| 2925 NW 195th St Edmond, OK | 3.0 | 2.0 | 1342 | $1,695 | $1.26 | 25d | 1 | 1.49mi |
| 2921 NW 195th St Edmond, OK | 3.0 | 2.0 | 1342 | $1,695 | $1.26 | 12d | 1 | 1.49mi |
HOA detail
- Monthly dues
- $21 · $252/yr
Listing history 2 events
-
2026-05-11status Pending
-
2026-03-29$245,000 Active
ⓘ Source: listings_history table (triggers on properties + properties_extension) + one-shot
backfill from property_details.listing_events for pre-trigger history.
Tax reassessment forecast OK · Resets to sale price
- Current annual tax
- $2,539 · $212/mo
- Projected year-2 tax
- $2,539 · $212/mo
- Expected delta
- $0/yr ($0/mo · 0.0%)
ⓘ Screening estimate from a state-policy table — verify with the county assessor before closing.
Climate risk First Street
- Flood 1/10 Low FEMA zone X (unshaded) · 0% chance over 30 yrs
- Wildfire 4/10 Moderate
- Heat 6/10 Major 7 d/yr ≥108°F today · 19 d/yr by 30 yrs out
- Wind 2/10 Low 4% chance of damaging wind over 30 yrs
- Air quality 2/10 Low 1 unhealthy d/yr today · 1 by 30 yrs out
Nearby sold comps map
Loading sold comps map…
Walkable amenities ~0.75 mi
Loading nearby amenities…
Taxation est. · year 1
- Rental income
- $23,948
- − Mortgage interest
- −$13,724
- − Property taxes
- −$2,539
- − Insurance
- −$1,225
- − Repairs & maintenance
- −$1,916
- − Management
- −$1,916
- − HOA
- −$252
- − Depreciation
- −$7,127
- Taxable loss
- −$4,751
- Est. tax savings @ 24.0%
- +$1,140
- After-tax cash flow
- $625/yr
For passive investors: Depreciation is non-cash, so a rental often shows a tax loss while cash-flowing — sheltering income. Rental losses are passive: they offset passive income freely, and up to $25,000/yr can offset ordinary (W-2) income if you actively participate and your MAGI is under $100k (phasing out to $0 by $150k); unused losses carry forward. On sale, claimed depreciation is recaptured at up to 25%, and gains may owe capital-gains tax (a 1031 exchange can defer both). Figures are a year-1 estimate at your 24.0% rate — not tax advice; consult a CPA.
Schools (NCES district)
- District
- Edmond
- NCES district ID
- 4010590
- Math proficiency
- 38% ▼ -12.00%
- Reading proficiency
- 40% ▼ -12.00%
- Median HH income
- $73,212
- Composite
- 35.88/100
- National rank
- #4814
- State rank
- #11 of 270 in OK
Livability — Edmond
- Score
- 78/100
- State rank
- #6
- US rank
- #2383
Category grades
Schools grade is shown separately in the Schools card above.
Census & demographics
- County
- Oklahoma County · 771,644 people
- City population
- 177,083
- Metro
- Oklahoma City, OK
- Population (ZIP)
- 46,993
- Household income
- $126,659
- Rent vs Own
- Severe rent burden
- 898.0
Population outlook (Oklahoma County) Hauer SSP2
- Today (2025)
- 911,875 people
- By 2030
- 982,413 · +7.7%
- By 2040
- 1,130,468 · +24.0%
- By 2050
- 1,288,422 · +41.3%
- By 2075
- 1,711,482 · +87.7%
- By 2100
- 2,088,448 · +129.0%
Race, ethnicity, and origin ACS 2023
- Neighborhood character
- Predominantly White (67%)
- Race & ethnicity
- White 67% Two or more races 10% Black 8% Asian 8% Hispanic / Latino 8% Native American 2%
- Hispanic origin (detail)
- Mexican 5%
- Common ancestry
- Italian 3% Slovak 2% Romanian 2%
- Foreign-born
- 11% · Canada, China, Vietnam
- Languages at home
- 86% English-only · Spanish 4% Other Indo-European 2% Chinese 2%
Political lean MEDSL · Oklahoma
- 2024 margin
- Toss-up / Even · D 48.0% · R 49.7% · Other 2.3%
- 2008→2024 swing
- +15.1pp toward D · 2008: -16.8pp · 2024: -1.7pp
- All cycles
- 2024: R+1.7 2020: R+1.1 2016: R+10.5 2012: R+16.7 2008: R+16.8
Not yet ingested
- Civics
- —
Market trends
- HPI YoY
- ▼ -44.41%
- Current HPI
- 203.1105
- Rent YoY
- ▲ 1.21%
- Metro
- Oklahoma City, OK
- State GDP YoY
- ▲ 1.55%
- F500 in state
- 6
Industry mix (Fortune 500 HQ in OK)
| Industry | F500 HQs | Revenue |
|---|---|---|
| Energy | 3 | $48B |
|
||
Price history
2 events — show timeline
- 2026-05-11 Pending — MLSOK
- 2026-03-29 Listed $245,000 MLSOK
Property tax history
+2.5%/yrLatest (2025): $2,539 · +5.1% YoY. Source: county tax records.
Cash-flow waterfall
monthlySold comps — $/sqft
last 12 mo · ≤1 miLoading sold comps…