206 Monroe St · East Gaffney, SC
Flood risk 1/10 · Minimal
- FEMA flood zone
- X (unshaded)
- Chance of flooding over 30 yrs
- 0.0%
- Est. flood insurance / yr
- $507 – $1,088
Fire risk 4/10 · Minor
- Est. fire insurance / yr
- $783 – $1,453
Heat risk 6/10 · Moderate
- Hot days now (above 103°F)
- 7 days/yr
- Hot days in 30 yrs
- 16 days/yr
Wind risk 3/10 · Minor
- Chance of severe wind over 30 yrs
- 4.0%
Air-quality risk 3/10 · Minor
- Unhealthy air days now
- 3 days/yr
- Unhealthy air days in 30 yrs
- 4 days/yr
Risk factors via First Street. Map © Google.
Why this score? — see what drove the D grade
The composite is a weighted blend of 9 inputs, each scored 0–100. Each bar is that input's sub-score; the figure is the points it added to the 100-point composite (weight × sub-score).
- Cash flow +15.3/30.0
- ARV discount +7.5/15.0
- DSCR +4.7/10.0
- 1% rule +3.2/10.0
- Livability +3.1/5.0
- Schools +2.8/10.0
- Rent growth +2.5/5.0
- Condition / age +2.5/5.0
- Appreciation +0.0/10.0
$130,000
🖨 Deal sheet (PDF) 📄 Offer letter ✓ Due diligence
Listing remarks
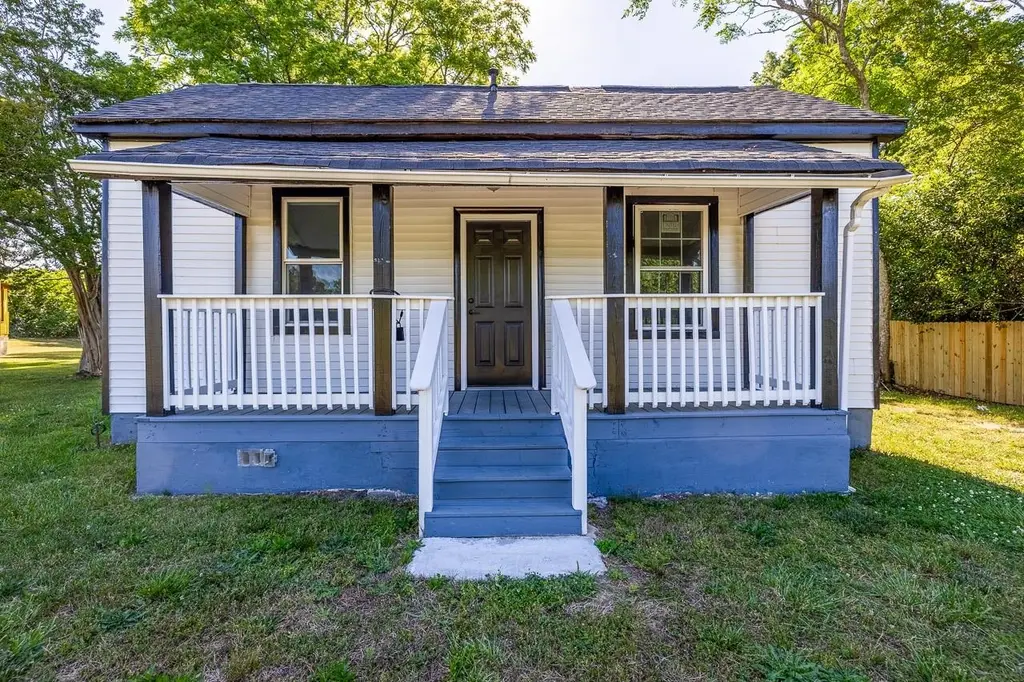
Welcome home to this charming 2-bedroom, 2-bath residence located in the heart of Gaffney! Situated on a spacious lot, 206 Monroe Street offers the perfect blend of comfort, convenience, and outdoor space. Inside, you’ll find a functional layout with generously sized bedrooms, two full bathrooms, and inviting living spaces designed for everyday living. Step outside and enjoy the large yard — ideal for entertaining, gardening, pets, or simply relaxing outdoors. Whether you are a first-time homebuyer, downsizing, or looking to add to your investment portfolio, this property offers endless potential. Conveniently located near shopping, dining, schools, and local amenities, this hom
Key facts
- Large yard
- Spacious lot
- Functional layout
Tags
Property features AI
Exterior
- Parking: Garage faces side
- Utilities: Public water; Public sewer
- Home design: Single-family residence; One story
- Construction: Vinyl siding
- Exterior features: Level lot
Interior
- Kitchen: Electric range
- Bathrooms: 2 full bathrooms
- Heating & cooling: Natural gas forced-air heating; Central electric air conditioning
- Interior features: Electric water heater; Electric range
- Laundry & utility: Electric dryer hookup
Neighborhood map
What this means for you Summary
Snapshot
- This is a 2-bed/2.0-bath single-family listed at $130k.
Deal economics
- At list price, monthly cash flow is $47 ($563/yr) — positive.
- The deal already cash-flows at list — no discount required.
- To meet the 1% rule (rent ≥ 1% of price), the offer needs to be $106k (18.4% below list).
- Recommended offer: $106k (18.4% below list) — sets the bar for 1% rule.
Location & tenants
- Location reads 61/100 on livability (#206 in SC) — a middle-class / working-renter tenant base. Strengths: cost of living A+, housing A+, health & safety A; Watch: amenities F, commute F, employment F.
- Cherokee 01 (rural): math 29% / reading 40% proficiency, ranked #47 of 80 in SC (top 59%) — families likely to look elsewhere, expect single-tenant / working-renter base with shorter leases; 64% free/reduced lunch — lower-income household profile, screen leases tightly.
- Zoned schools: Gaffney Middle (math 25% / reading 37%, grade F, #128 of 229 statewide, top 58%, 921 students, 100% FRL); Gaffney High (math 40% / reading 75%, grade C, #116 of 196 statewide, top 59%, 1,838 students, 84% FRL) — zoned schools average 92% FRL vs 64% district-wide (28 pts higher); higher-poverty schools than district average — tighter screening recommended.
- Market conditions: 160 active listings in the ZIP; 2 comparable units currently listed for rent nearby; lower-income renter base — watch delinquency; 200 units permitted in Cherokee County in 2024 (0 in 5+ unit buildings).
Forward outlook
- Local home prices are declining (-3.0%/yr); year-one equity from $899 of loan paydown is wiped out by about $4k of value loss. Plan a longer hold.
Negotiation context
- It's been on market 15 days — a 2% lower offer ($128k) is reasonable based on typical stale-listing flexibility.
Risks & watch-outs
- Watch-outs: built in 1950 — expect roof / HVAC / electrical / plumbing capex.
- Climate carrying-cost: extreme-heat days projected 7→16/yr by 2055 (HVAC capex compounding) — expect insurance premiums to compound above CPI over the hold.
Questions for the listing agent
- Built in 1950 — when were the roof, HVAC, electrical panel, plumbing, and water heater last replaced?
- Is there a deadline driving the sale (1031 exchange, divorce, estate, relocation)? That informs how much negotiation room exists.
- Schools are F-rated, which usually means shorter tenancies and higher turnover. Who's the typical renter profile here, and what's been the actual vacancy rate?
- The area grade is low — what's the realistic commute time and amenity access for the typical tenant pool here? Any planned neighborhood developments (good or bad) we should know about?
- What's the average days-on-market for RENTAL listings here right now (not sales)? A rising rental-DOM trend means longer vacancies and softer asking-rent achievability than the comps imply.
- What's the recent tenant-quality profile in this submarket — average credit score on applications, eviction rate, late-payment / NSF rate, and stable-employment percentage? A property-management company in the area should have these aggregated.
- How much new for-sale + rental construction is in the pipeline within 1–3 miles? Heavy new supply typically softens prices + rents 12–24 months out; constrained supply supports both.
Investment metrics
- 1% rule
- 0.82% ✗
- Cap rate
- 6.73%
- Cash-on-cash
- 1.55%
- DSCR
- 1.07
- GRM
- 10.2
CMA / ARV
- ARV (on-the-fly)
- $59,640
- Comps found
- 7
Show comp detail 7 sales within ~0.75 mi
| Address | Dist | Beds/Ba | Sqft | Sold | Price | $/sf | Match |
|---|---|---|---|---|---|---|---|
| 204 Chestnut St | 0.40mi | 2/1.0 | 850 (+1%) | 1mo | $60,000 | $71 | 75 |
| 1512 Beech St | 0.18mi | 2/1.0 | 928 (+10%) | 11mo | $43,000 | $46 | 61 |
| 1510 Beech St | 0.17mi | 2/1.0 | 780 (-7%) | 19mo | $33,000 | $42 | 61 |
| 813 9th St St | 0.56mi | 2/1.0 | 806 (-4%) | 3mo | $122,090 | $151 | 60 |
| 407 Willow St | 0.44mi | 2/1.0 | 965 (+15%) | 1mo | $37,000 | $38 | 50 |
| 438 E Dr LM Rosemond Ln | 0.71mi | 3/1.0 (+1) | 864 (+3%) | 11mo | $124,900 | $145 | 44 |
| 330 Sycamore St | 0.36mi | 2/1.0 | 932 (+11%) | 22mo | $155,000 | $166 | 42 |
Match score weights: distance 35% · size 25% · config 20% · recency 20%. Top-matched comps best support the ARV.
Projected returns pro-forma
-3.0% appreciation · 3.0% rent growth · sell at horizon
- IRR
- -13.9%
- Equity multiple
- 0.50×
- Total profit
- $-18,127
- Equity at exit
- $19,383
- IRR
- -5.1%
- Equity multiple
- 0.67×
- Total profit
- $-12,139
- Equity at exit
- $11,240
Cash invested: $36,400 (down + closing). Projections, not guarantees.
Landlord ↔ Tenant lean methodology
- Overall (STATE)
- 90 Strongly Landlord-Friendly
- State South Carolina
- 90 Strongly Landlord-Friendly · R+6
- County
- — inherits STATE
- City
- — inherits STATE
ZIP-level market 29340
- Home prices YoY
- -29.7%
- Active inventory
- 160
- Price-to-rent
- 10.2×
Monthly cashflow live
- Estimated rent
- $1,061 medium interval (Pro) →
- Mortgage (P&I)
- −$682
- Tax from tax record
- −$56 /mo · $666/yr
- Insurance
- −$54
- HOA
- −$0
- Vacancy / Maint / Mgmt
- −$223
- Net cashflow
- $47
Break-even live
Sensitivity live
| Price | -10% $121 | -5% $84 | +0% $47 | +5% $10 | +10% $-27 |
|---|---|---|---|---|---|
| Rent | -10% $-37 | -5% $5 | +0% $47 | +5% $89 | +10% $131 |
| Rate | -1.0pp $112 | -0.5pp $80 | base $47 | +0.5pp $13 | +1.0pp $-21 |
UW: 25.0% down · 7.5% · 30yr · 1.5% tax · 5.0% vac · 8.0% maint · 8.0% mgmt
Financing live
Cash to close
- Down payment
- $32,500
- Closing costs
- $3,900
- Reserves months
- —
- Total cash needed
- —
Loan-product check · same deal, 3 products live
Conventional
25% down · 7.5% · 30yr
- Down + closing
- —
- Monthly P&I
- —
- Monthly cashflow
- —
- DSCR
- —
- Eligible?
- —
Personal DTI + credit; lowest rate.
DSCR
20% down · 8.5% · 30yr
- Down + closing
- —
- Monthly P&I
- —
- Monthly cashflow
- —
- DSCR
- —
- Eligible?
- —
No personal income docs; deal must DSCR.
Hard money
10% down · 12.0% · 12mo
- Down + closing
- —
- Monthly P&I
- —
- Monthly cashflow
- —
- DSCR
- —
- Eligible?
- —
Short-term bridge; refi at stabilization.
Rent comps 2 comps
| Address | Beds | Baths | Sqft | Rent | $/sqft | DOM | Units | Dist |
|---|---|---|---|---|---|---|---|---|
| 266 Goldmine Springs Rd Gaffney, SC | 2.0 | 1.0 | 730 | $1,099 | $1.51 | 25d | 1 | 0.55mi |
| 506 S Oliver St Gaffney, SC | 1.0–2.0 | 1.0 | 900 | $955 | $1.06 | 18d | 5 | 1.46mi |
Listing history 2 events
-
2026-05-24status Pending
-
2026-02-19$130,000 Active
ⓘ Source: listings_history table (triggers on properties + properties_extension) + one-shot
backfill from property_details.listing_events for pre-trigger history.
Tax reassessment forecast SC · Resets to sale price
- Current annual tax
- $666 · $56/mo
- Projected year-2 tax
- $741 · $62/mo
- Expected delta
- +$75/yr (+$6/mo · 11.2%)
ⓘ Screening estimate from a state-policy table — verify with the county assessor before closing.
Climate risk First Street
- Flood 1/10 Low FEMA zone X (unshaded) · 0% chance over 30 yrs
- Wildfire 4/10 Moderate
- Heat 6/10 Major 7 d/yr ≥103°F today · 16 d/yr by 30 yrs out
- Wind 3/10 Moderate 4% chance of damaging wind over 30 yrs
- Air quality 3/10 Moderate 3 unhealthy d/yr today · 4 by 30 yrs out
Nearby sold comps map
Loading sold comps map…
Walkable amenities ~0.75 mi
Loading nearby amenities…
Taxation est. · year 1
- Rental income
- $12,734
- − Mortgage interest
- −$7,282
- − Property taxes
- −$666
- − Insurance
- −$650
- − Repairs & maintenance
- −$1,019
- − Management
- −$1,019
- − Depreciation
- −$3,782
- Taxable loss
- −$1,683
- Est. tax savings @ 24.0%
- +$404
- After-tax cash flow
- $967/yr
For passive investors: Depreciation is non-cash, so a rental often shows a tax loss while cash-flowing — sheltering income. Rental losses are passive: they offset passive income freely, and up to $25,000/yr can offset ordinary (W-2) income if you actively participate and your MAGI is under $100k (phasing out to $0 by $150k); unused losses carry forward. On sale, claimed depreciation is recaptured at up to 25%, and gains may owe capital-gains tax (a 1031 exchange can defer both). Figures are a year-1 estimate at your 24.0% rate — not tax advice; consult a CPA.
Schools (NCES district)
- District
- Cherokee 01
- NCES district ID
- 4501500
- Math proficiency
- 29% ▼ -9.00%
- Reading proficiency
- 40% ▼ -2.00%
- Median HH income
- $34,262
- Composite
- 28.39/100
- National rank
- #6768
- State rank
- #47 of 80 in SC
Livability — East Gaffney
- Score
- 61/100
- State rank
- #206
- US rank
- #17691
Category grades
Schools grade is shown separately in the Schools card above.
Census & demographics
- Census place
- East Gaffney, SC
- County
- Cherokee County · 41,410 people
- Metro
- Gaffney, SC
- Population (ZIP)
- 20,763
- Household income
- $44,123
- Rent vs Own
- Severe rent burden
- 257.0
Population outlook (Cherokee County) Hauer SSP2
- Today (2025)
- 58,602 people
- By 2030
- 59,336 · +1.3%
- By 2040
- 60,266 · +2.8%
- By 2050
- 60,314 · +2.9%
- By 2075
- 59,276 · +1.2%
- By 2100
- 53,788 · -8.2%
Race, ethnicity, and origin ACS 2023
- Neighborhood character
- Predominantly White (71%)
- Race & ethnicity
- White 71% Black 22% Two or more races 4% Hispanic / Latino 2%
- Common ancestry
- Slovak 2% Serbian 2% Italian 2%
- Foreign-born
- 2% · Canada, China
- Languages at home
- 97% English-only · Spanish 2%
Political lean MEDSL · Cherokee
- 2024 margin
- Solid R (+51.4) · D 23.9% · R 75.3%
- 2008→2024 swing
- -22.0pp toward R · 2008: -29.3pp · 2024: -51.4pp
- All cycles
- 2024: R+51.4 2020: R+43.8 2016: R+41.7 2012: R+29.3 2008: R+29.3
Not yet ingested
- Civics
- —
Market trends
- HPI YoY
- ▼ -85.24%
- Current HPI
- 201.4272
- Rent YoY
- —
- Metro
- Gaffney, SC
- State GDP YoY
- ▲ 4.51%
- F500 in state
- 2
Industry mix (Fortune 500 HQ in SC)
| Industry | F500 HQs | Revenue |
|---|---|---|
| Packaging | 1 | $7B |
|
||
Price history
2 events — show timeline
- 2026-05-24 Pending — SPMLS
- 2026-02-19 Listed $130,000 SPMLS
Property tax history
-0.3%/yrLatest (2025): $666 · +5.4% YoY. Source: county tax records.
Cash-flow waterfall
monthlySold comps — $/sqft
last 12 mo · ≤1 miLoading sold comps…