2720 Bullock Ave E · Nashville-Davidson metropolitan government (balance), TN
Flood risk 1/10 · Minimal
- FEMA flood zone
- X (unshaded)
- Chance of flooding over 30 yrs
- 0.0%
- Est. flood insurance / yr
- $507 – $1,088
Fire risk 1/10 · Minimal
- Est. fire insurance / yr
- $949 – $1,763
Heat risk 5/10 · Moderate
- Hot days now (above 106°F)
- 7 days/yr
- Hot days in 30 yrs
- 20 days/yr
Wind risk 4/10 · Minor
- Chance of severe wind over 30 yrs
- 8.0%
Air-quality risk 2/10 · Minimal
- Unhealthy air days now
- 1 days/yr
- Unhealthy air days in 30 yrs
- 2 days/yr
Risk factors via First Street. Map © Google.
Why this score? — see what drove the C- grade
The composite is a weighted blend of 9 inputs, each scored 0–100. Each bar is that input's sub-score; the figure is the points it added to the 100-point composite (weight × sub-score).
- Cash flow +17.0/30.0
- ARV discount +15.0/15.0
- DSCR +5.3/10.0
- 1% rule +3.9/10.0
- Rent growth +2.8/5.0
- Livability +2.5/5.0
- Condition / age +2.5/5.0
- Schools +1.4/10.0
- Appreciation +0.0/10.0
$249,900
🖨 Deal sheet (PDF) 📄 Offer letter ✓ Due diligence
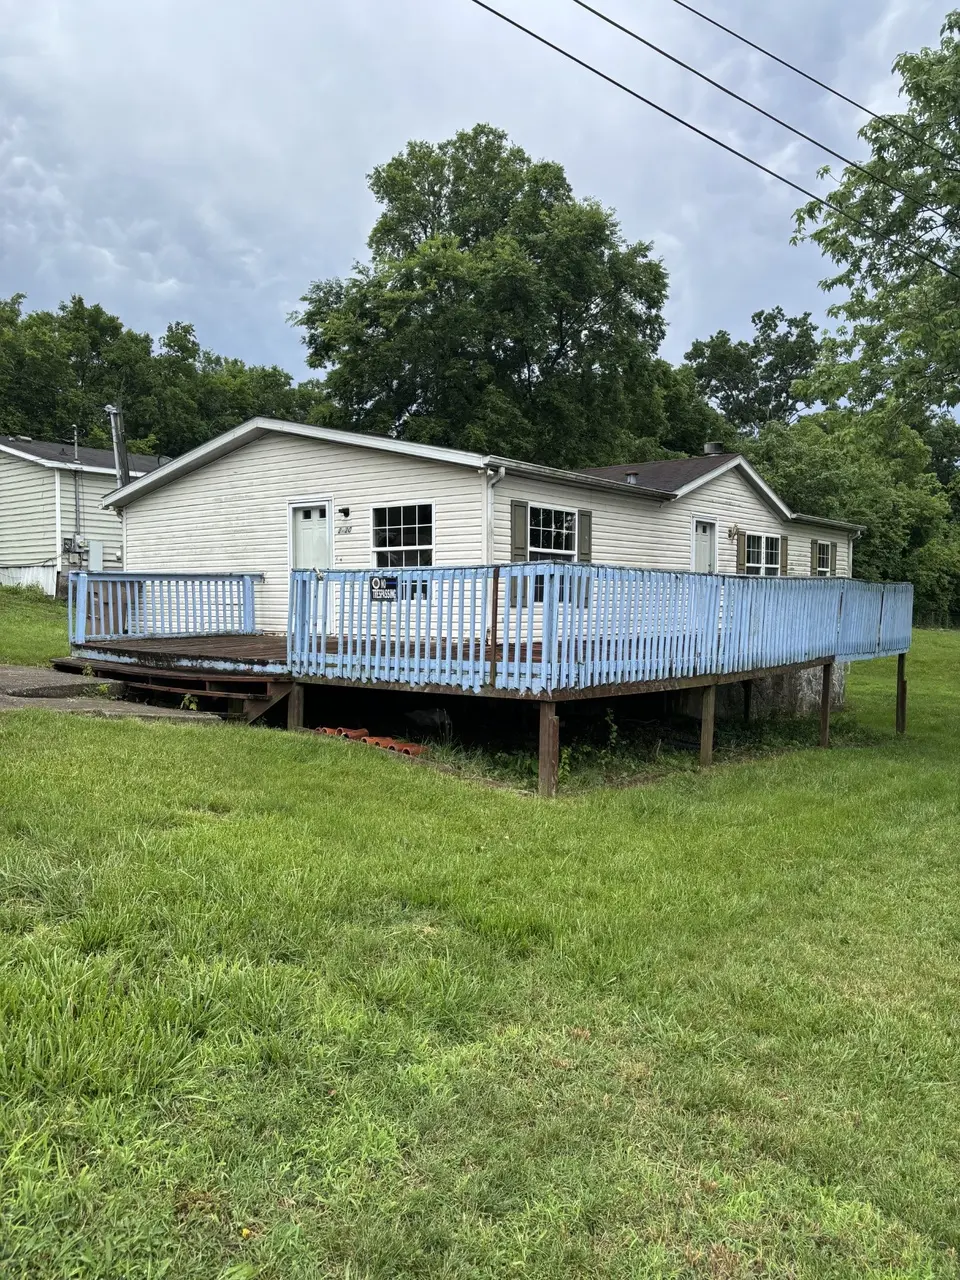
Listing remarks
Good rental or make your on home there, quite neighborhood, great lot, can rent for $1500.00 up to $2000.00, carport, Deck front and side, needs a little repair & stain. It's been good for me for rental! all plumbing has been made new,
Key facts
- Deck front and side
- 0.4 acre lot
- Built 1995
Tags
Property features AI
Exterior
- Parking: No covered spaces; No designated parking listed
- Utilities: Public water; Public sewer; Water available
- Home design: Modular residential home; One story
- Construction: Other construction materials; Existing structure
- Exterior features: Level lot
Interior
- Kitchen: Electric oven and electric range; Dishwasher; Refrigerator
- Bedrooms: 2 bedrooms (both on the main level)
- Flooring: Laminate flooring
- Bathrooms: 2 full bathrooms
- Heating & cooling: Central heating; Central air; Ceiling fan(s)
- Interior features: Electric oven and electric range; Dishwasher; Refrigerator; Ceiling fans; Central heating and central air
- Laundry & utility: Washer hookup; Electric dryer hookup
Neighborhood map
What this means for you Summary
Snapshot
- This is a 3-bed/2.0-bath single-family listed at $250k.
Deal economics
- At list price, monthly cash flow is $169 ($2k/yr) — positive.
- The deal already cash-flows at list — no discount required.
- To meet the 1% rule (rent ≥ 1% of price), the offer needs to be $221k (11.4% below list).
- Recommended offer: $221k (11.4% below list) — sets the bar for 1% rule.
- Cap rate 7.1% vs local median 2.9% in Nashville-Davidson metropolitan government (balance) — top-decile yield for the area; either an underpriced asset or a hidden risk that comps aren't pricing in. Stress-test before assuming the spread holds.
Location & tenants
- Location reads: area grade C — affects rentability + tenant quality, not the cash-flow math above.
- Davidson County (urban): math 12% / reading 19% proficiency, ranked #126 of 139 in TN (top 91%) — low school quality limits family demand, transient renter base, plan for 1-2y turnover; 66% free/reduced lunch — lower-income household profile, screen leases tightly.
- Zoned schools: Tom Joy Elementary (math 2% / reading 2%, grade F, #926 of 952 statewide, top 100%, 456 students, 0% FRL); Jere Baxter Middle (math 2% / reading 3%, grade F, #329 of 333 statewide, top 99%, 440 students, 0% FRL); Maplewood High (math 2% / reading 12%, grade F, #294 of 332 statewide, top 91%, 691 students, 0% FRL) — zoned schools average 0% FRL vs 66% district-wide (66 pts lower); this property's tenant base skews higher-income than the district average.
- Market conditions: Rents rising (+1.3%/yr); 539 active listings in the ZIP; 40 comparable units currently listed for rent nearby; rentals at typical pace (median 18d on market — plan ~3-4 weeks tenant-placement turnaround); 6,873 units permitted in Davidson County in 2024 (4,138 in 5+ unit buildings).
- This rent runs 43% of the median local income ($62k/yr) — at the standard rent-burdened threshold; future hikes will face affordability resistance.
Forward outlook
- Local home prices are declining (-3.0%/yr); year-one equity from $2k of loan paydown is wiped out by about $7k of value loss. Plan a longer hold.
- Davidson County population projected at +42% by 2050 — long-run rental-demand tailwind backs the buy-and-hold thesis.
Negotiation context
- Only 9 days on market — expect competitive offers; lowballing is unlikely to land.
- Current owner paid $68k; list at $250k implies a 268% gain — meaningful room to come down on a strong offer.
Risks & watch-outs
- Climate carrying-cost: extreme-heat days projected 7→20/yr by 2055 (HVAC capex compounding) — expect insurance premiums to compound above CPI over the hold.
Questions for the listing agent
- Is there a deadline driving the sale (1031 exchange, divorce, estate, relocation)? That informs how much negotiation room exists.
- What's the average days-on-market for RENTAL listings here right now (not sales)? A rising rental-DOM trend means longer vacancies and softer asking-rent achievability than the comps imply.
- What's the recent tenant-quality profile in this submarket — average credit score on applications, eviction rate, late-payment / NSF rate, and stable-employment percentage? A property-management company in the area should have these aggregated.
- How much new for-sale + rental construction is in the pipeline within 1–3 miles? Heavy new supply typically softens prices + rents 12–24 months out; constrained supply supports both.
Investment metrics
- 1% rule
- 0.89% ✗
- Cap rate
- 7.11%
- Cash-on-cash
- 2.90%
- DSCR
- 1.13
- GRM
- 9.4
CMA / ARV
- ARV (on-the-fly)
- $387,288
- Comps found
- 12
Show comp detail 12 sales within ~0.75 mi
| Address | Dist | Beds/Ba | Sqft | Sold | Price | $/sf | Match |
|---|---|---|---|---|---|---|---|
| 808 Jones Pl | 0.20mi | 3/2.0 | 1,152 (-3%) | 10mo | $494,900 | $430 | 77 |
| 120 Dellway Dr | 0.43mi | 3/1.0 | 1,148 (-3%) | 1mo | $362,000 | $315 | 69 |
| 2627 Woodyhill Dr | 0.25mi | 3/2.0 | 1,319 (+11%) | 1mo | $510,000 | $387 | 69 |
| 2800 Brunswick Dr | 0.36mi | 2/2.0 (-1) | 1,219 (+3%) | 8mo | $381,600 | $313 | 67 |
| 2573 Slaydon Dr | 0.34mi | 3/2.0 | 1,044 (-12%) | 1mo | $255,000 | $244 | 64 |
| 520 Norton Ave | 0.56mi | 3/1.0 | 1,164 (-2%) | 4mo | $380,000 | $326 | 63 |
| 2608 Woodyhill Dr | 0.35mi | 3/1.0 | 1,273 (+7%) | 7mo | $366,100 | $288 | 62 |
| 529 Wesley Ave | 0.60mi | 3/2.0 | 1,152 (-3%) | 9mo | $435,000 | $378 | 60 |
| 318 Queen Ave | 0.64mi | 2/2.0 (-1) | 1,160 (-2%) | 5mo | $375,000 | $323 | 57 |
| 2058 Oakwood Ave | 0.44mi | 3/2.0 | 1,080 (-9%) | 10mo | $430,000 | $398 | 56 |
| 143 Gordon Ter | 0.41mi | 3/1.0 | 1,075 (-10%) | 8mo | $390,000 | $363 | 54 |
| 2021 Jones Cir | 0.56mi | 3/2.0 | 1,360 (+14%) | 10mo | $424,999 | $312 | 41 |
Match score weights: distance 35% · size 25% · config 20% · recency 20%. Top-matched comps best support the ARV.
Projected returns pro-forma
-3.0% appreciation · 1.33% rent growth · sell at horizon
- IRR
- -13.5%
- Equity multiple
- 0.52×
- Total profit
- $-33,434
- Equity at exit
- $37,261
- IRR
- -7.3%
- Equity multiple
- 0.57×
- Total profit
- $-29,985
- Equity at exit
- $21,607
Cash invested: $69,972 (down + closing). Projections, not guarantees.
Landlord ↔ Tenant lean methodology
- Overall (STATE)
- 87 Strongly Landlord-Friendly
- State Tennessee
- 87 Strongly Landlord-Friendly · R+13
- County
- — inherits STATE
- City
- — inherits STATE
ZIP-level market 37207
- Home prices YoY
- -27.8%
- Rents YoY
- 1.3%
- Active inventory
- 539
- Price-to-rent
- 9.4×
Monthly cashflow live
- Estimated rent
- $2,213 high interval (Pro) →
- Mortgage (P&I)
- −$1,311
- Tax from tax record
- −$164 /mo · $1,973/yr
- Insurance
- −$104
- HOA
- −$0
- Vacancy / Maint / Mgmt
- −$465
- Net cashflow
- $169
Break-even live
Sensitivity live
| Price | -10% $311 | -5% $240 | +0% $169 | +5% $98 | +10% $28 |
|---|---|---|---|---|---|
| Rent | -10% $-6 | -5% $82 | +0% $169 | +5% $257 | +10% $344 |
| Rate | -1.0pp $295 | -0.5pp $233 | base $169 | +0.5pp $104 | +1.0pp $39 |
UW: 25.0% down · 7.5% · 30yr · 1.5% tax · 5.0% vac · 8.0% maint · 8.0% mgmt
Financing live
Cash to close
- Down payment
- $62,475
- Closing costs
- $7,497
- Reserves months
- —
- Total cash needed
- —
Loan-product check · same deal, 3 products live
Conventional
25% down · 7.5% · 30yr
- Down + closing
- —
- Monthly P&I
- —
- Monthly cashflow
- —
- DSCR
- —
- Eligible?
- —
Personal DTI + credit; lowest rate.
DSCR
20% down · 8.5% · 30yr
- Down + closing
- —
- Monthly P&I
- —
- Monthly cashflow
- —
- DSCR
- —
- Eligible?
- —
No personal income docs; deal must DSCR.
Hard money
10% down · 12.0% · 12mo
- Down + closing
- —
- Monthly P&I
- —
- Monthly cashflow
- —
- DSCR
- —
- Eligible?
- —
Short-term bridge; refi at stabilization.
Rent comps 40 comps
| Address | Beds | Baths | Sqft | Rent | $/sqft | DOM | Units | Dist |
|---|---|---|---|---|---|---|---|---|
| 3100 Conviser Dr Nashville, TN | 2.0 | 1.5 | 960 | $1,600 | $1.67 | 19d | 1 | 0.50mi |
| 128 Gordon Ter Nashville, TN | 3.0 | 2.0 | 1400 | $2,600 | $1.86 | 12d | 1 | 0.51mi |
| 538 Norton Ave Nashville, TN | 3.0 | 2.0 | 1394 | $2,000 | $1.43 | 21d | 1 | 0.56mi |
| 2003 Overby Rd Nashville, TN | 2.0 | 2.0 | 924 | $2,295 | $2.48 | 9d | 1 | 0.69mi |
| 600 E Trinity Ln Unit 1049679P Nashville, TN | 2.0 | 2.0 | 990 | $3,890 | $3.93 | 25d | 1 | 0.74mi |
| 308 Prince Ave Unit A Nashville, TN | 2.0 | 1.0 | 800 | $1,200 | $1.50 | 23d | 1 | 0.76mi |
| 308 Prince Ave Nashville, TN | 2.0 | 1.0 | 900 | $1,200 | $1.33 | 18d | 1 | 0.76mi |
| 618 Cogdill Ln Nashville, TN | 2.0–3.0 | 2.5–3.5 | 1857 | $4,325 | $2.33 | 5d | 8 | 0.80mi |
| 215 Prince Ave Unit D Nashville, TN | 2.0 | 1.0 | 780 | $999 | $1.28 | 25d | 1 | 0.83mi |
| 109 Duke St Unit E Nashville, TN | 2.0 | 2.5 | 1400 | $2,200 | $1.57 | 25d | 1 | 0.84mi |
| 301 Ben Allen Rd Nashville, TN | 1.0–3.0 | 1.0–2.0 | 1019 | $1,681 | $1.65 | 3d | 11 | 0.84mi |
| 109 Duke St Unit B Nashville, TN | 2.0 | 2.5 | 1400 | $2,000 | $1.43 | 25d | 1 | 0.85mi |
| 1100 Sunset Cir Nashville, TN | 1.0–3.0 | 1.0–2.5 | 1070 | $1,899 | $1.77 | 4d | 7 | 0.88mi |
| 204 Prince Ave Unit A Nashville, TN | 2.0 | 1.0 | 800 | $1,875 | $2.34 | 25d | 1 | 0.89mi |
| 614 Poplar Pl Nashville, TN | 3.0 | 2.0 | 1244 | $2,200 | $1.77 | 3d | 1 | 0.91mi |
| 849 Cherokee Ave #12 Nashville, TN | 2.0 | 2.5 | 1330 | $2,600 | $1.95 | 25d | 1 | 0.93mi |
| 901 Cherokee Ave Nashville, TN | 3.0 | 1.0–2.0 | 1457 | $3,563 | $2.45 | 3d | 12 | 0.94mi |
| 1801 Meridian St Nashville, TN | 1.0–2.0 | 1.0–2.5 | 1050 | $2,817 | $2.68 | 6d | 10 | 0.98mi |
| 488 Lemont Dr Nashville, TN | 1.0–3.0 | 1.0–1.5 | 951 | $2,065 | $2.17 | 3d | 47 | 1.02mi |
| 1067 Zophi St Nashville, TN | 2.0 | 2.0 | 1392 | $2,500 | $1.80 | 15d | 1 | 1.03mi |
| 917B Spain Ave Nashville, TN | 3.0 | 3.0 | 1428 | $2,450 | $1.72 | 6d | 1 | 1.03mi |
| 927 Chickasaw Ave Nashville, TN | 3.0 | 2.0 | 1223 | $2,600 | $2.13 | 19d | 1 | 1.04mi |
| 3108 Hillside Rd Unit 1 Nashville, TN | 3.0 | 2.0 | 1194 | $1,400 | $1.17 | 22d | 1 | 1.08mi |
| 120 Oak Valley Dr Nashville, TN | 2.0 | 1.0 | 1170 | $1,299 | $1.11 | 5d | 9 | 1.20mi |
| 905 Blue Ridge Dr Unit B Nashville, TN | 2.0 | 1.0 | 780 | $1,600 | $2.05 | 9d | 1 | 1.23mi |
| 1002 Fairwin Ave Unit 1 Nashville, TN | 4.0 | 2.0 | 1442 | $3,300 | $2.29 | 25d | 1 | 1.23mi |
| 1002 Fairwin Ave Nashville, TN | 3.0 | 2.0 | 1437 | $3,300 | $2.30 | 25d | 1 | 1.23mi |
| 2814 Gallatin Pike Nashville, TN | 1.0–2.0 | 1.0 | 800 | $1,733 | $2.17 | 5d | 11 | 1.26mi |
| 1118 Litton Ave Nashville, TN | 2.0 | 2.0–2.5 | 976 | $1,700 | $1.74 | 9d | 2 | 1.27mi |
| 1118 Litton Ave Nashville, TN | 2.0 | 2.0–2.5 | 976 | $1,688 | $1.73 | 3d | 2 | 1.27mi |
| 438 Roger Williams Ave Nashville, TN | 2.0 | 1.5 | 960 | $1,450 | $1.51 | 23d | 1 | 1.29mi |
| 1402 Montgomery Ave Unit B Nashville, TN | 2.0 | 1.0 | 885 | $2,250 | $2.54 | 9d | 1 | 1.29mi |
| 2424 Inga St Nashville, TN | 3.0 | 2.0 | 1440 | $2,495 | $1.73 | 18d | 1 | 1.30mi |
| 1122 Litton Ave #212 Nashville, TN | 2.0 | 2.0 | 1130 | $2,100 | $1.86 | 25d | 1 | 1.30mi |
| 1106B Stratford Ave Unit 1312367P Nashville, TN | 2.0 | 2.5 | 1280 | $3,559 | $2.78 | 17d | 1 | 1.35mi |
| 2312 Northview Ave Unit A Nashville, TN | 2.0 | 1.0 | 700 | $1,495 | $2.14 | 18d | 1 | 1.40mi |
| 323 E Village Ln Nashville, TN | 2.0 | 2.0 | 1143 | $2,475 | $2.17 | 25d | 1 | 1.42mi |
| 1310 Jones Ave Nashville, TN | 2.0 | 2.0 | 1200 | $1,895 | $1.58 | 19d | 1 | 1.43mi |
| 2516 Gallatin Pike Unit 1302205P Nashville, TN | 2.0 | 1.0 | 828 | $3,536 | $4.27 | 9d | 1 | 1.47mi |
| 3120 Creekwood Dr Nashville, TN | 2.0 | 1.0 | 910 | $1,300 | $1.43 | 23d | 1 | 1.49mi |
Listing history 8 events
-
2026-06-21days on market $249,900 Active 9 DOM
-
2026-06-19status $249,900 Active 6 DOM
-
2026-06-16status $249,900 Pending 6 DOM
-
2026-06-15days on market $249,900 Active 6 DOM
-
2026-06-13days on market $249,900 Active 4 DOM
-
2026-06-13days on market $249,900 Active 3 DOM
-
2026-06-10remarks 237-char remark
-
2026-06-10$249,900 Active 1 DOM
ⓘ Source: listings_history table (triggers on properties + properties_extension) + one-shot
backfill from property_details.listing_events for pre-trigger history.
Tax reassessment forecast TN · Resets to sale price
- Current annual tax
- $1,973 · $164/mo
- Projected year-2 tax
- $1,973 · $164/mo
- Expected delta
- $0/yr ($0/mo · -0.0%)
ⓘ Screening estimate from a state-policy table — verify with the county assessor before closing.
Climate risk First Street
- Flood 1/10 Low FEMA zone X (unshaded) · 0% chance over 30 yrs
- Wildfire 1/10 Low
- Heat 5/10 Major 7 d/yr ≥106°F today · 20 d/yr by 30 yrs out
- Wind 4/10 Moderate 8% chance of damaging wind over 30 yrs
- Air quality 2/10 Low 1 unhealthy d/yr today · 2 by 30 yrs out
Nearby sold comps map
Loading sold comps map…
Walkable amenities ~0.75 mi
Loading nearby amenities…
Taxation est. · year 1
- Rental income
- $26,556
- − Mortgage interest
- −$13,998
- − Property taxes
- −$1,973
- − Insurance
- −$1,250
- − Repairs & maintenance
- −$2,124
- − Management
- −$2,124
- − Depreciation
- −$7,270
- Taxable loss
- −$2,184
- Est. tax savings @ 24.0%
- +$524
- After-tax cash flow
- $2,555/yr
For passive investors: Depreciation is non-cash, so a rental often shows a tax loss while cash-flowing — sheltering income. Rental losses are passive: they offset passive income freely, and up to $25,000/yr can offset ordinary (W-2) income if you actively participate and your MAGI is under $100k (phasing out to $0 by $150k); unused losses carry forward. On sale, claimed depreciation is recaptured at up to 25%, and gains may owe capital-gains tax (a 1031 exchange can defer both). Figures are a year-1 estimate at your 24.0% rate — not tax advice; consult a CPA.
Schools (NCES district)
- District
- Davidson County
- NCES district ID
- 4703180
- Math proficiency
- 12% ▼ -17.00%
- Reading proficiency
- 19% ▼ -7.00%
- Median HH income
- $48,667
- Composite
- 14.03/100
- National rank
- #9472
- State rank
- #126 of 139 in TN
Livability — Nashville-Davidson metropolitan government (balance)
No livability data for this city. (Only ~50 U.S. cities are tracked.)
Census & demographics
- Census place
- Nashville-Davidson metropolitan government (balance), TN
- County
- Davidson County · 680,067 people
- City population
- 677,595
- Metro
- Nashville-Davidson--Murfreesboro--Franklin, TN
- Population (ZIP)
- 41,366
- Household income
- $61,744
- Rent vs Own
- Severe rent burden
- 1969.0
Population outlook (Davidson County) Hauer SSP2
- Today (2025)
- 808,568 people
- By 2030
- 874,489 · +8.2%
- By 2040
- 1,009,046 · +24.8%
- By 2050
- 1,147,294 · +41.9%
- By 2075
- 1,475,439 · +82.5%
- By 2100
- 1,714,101 · +112.0%
Race, ethnicity, and origin ACS 2023
- Neighborhood character
- Diverse neighborhood (Simpson 0.60)
- Race & ethnicity
- Black 57% White 24% Hispanic / Latino 13% Two or more races 8%
- Hispanic origin (detail)
- Mexican 6%
- Common ancestry
- Slovak 2% Serbian 1% Romanian 1%
- Foreign-born
- 10% · Canada, Jamaica
- Languages at home
- 88% English-only · Spanish 10%
Political lean MEDSL · Davidson
- 2024 margin
- Strong D (+27.4) · D 62.7% · R 35.3% · Other 2.0%
- 2008→2024 swing
- +6.5pp toward D · 2008: 21.0pp · 2024: 27.4pp
- All cycles
- 2024: D+27.4 2020: D+32.1 2016: D+26.0 2012: D+18.7 2008: D+21.0
Not yet ingested
- Civics
- —
Market trends
- HPI YoY
- ▼ -135.21%
- Current HPI
- 351.9628
- Rent YoY
- ▲ 1.33%
- Metro
- Nashville-Davidson--Murfreesboro--Franklin, TN
- State GDP YoY
- ▲ 2.78%
- F500 in state
- 22
Industry mix (Fortune 500 HQ in TN)
| Industry | F500 HQs | Revenue |
|---|---|---|
| Healthcare | 3 | $91B |
|
||
| Retail | 3 | $72B |
|
||
| Transportation / Logistics | 1 | $88B |
|
||
| Paper / Packaging | 1 | $19B |
|
||
| Insurance | 1 | $13B |
|
||
| Energy | 1 | $12B |
|
||
Price history
+267.5% since first listed2 events — show timeline
- 2026-06-09 Listed $249,900 REALTRACS as Distributed by MLS Grid
- 2014-04-17 Sold (Public Records) $68,000 Public Records
Property tax history
+8.2%/yrLatest (2025): $1,973 · +26.9% YoY. Source: county tax records.
Cash-flow waterfall
monthlySold comps — $/sqft
last 12 mo · ≤1 miLoading sold comps…