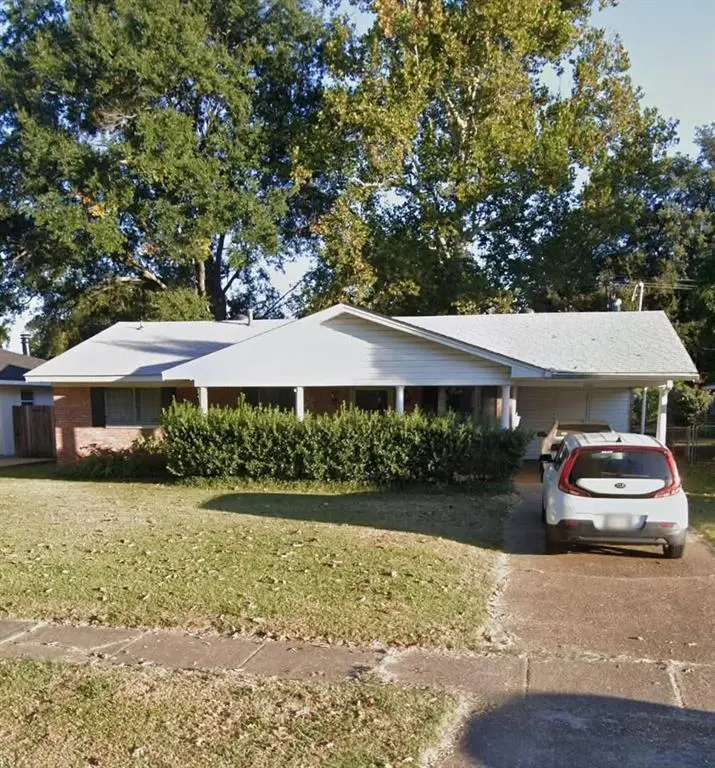
1123 Georgia St · Shreveport, LA
Flood risk 1/10 · Minimal
- FEMA flood zone
- X
- Chance of flooding over 30 yrs
- 0.0%
- Est. flood insurance / yr
- $507 – $1,088
Fire risk 1/10 · Minimal
- Est. fire insurance / yr
- $1,269 – $2,357
Heat risk 7/10 · Major
- Hot days now (above 111°F)
- 7 days/yr
- Hot days in 30 yrs
- 22 days/yr
Wind risk 6/10 · Moderate
- Chance of severe wind over 30 yrs
- 66.0%
Air-quality risk 2/10 · Minimal
- Unhealthy air days now
- 1 days/yr
- Unhealthy air days in 30 yrs
- 2 days/yr
Risk factors via First Street. Map © Google.
Why this score? — see what drove the D grade
The composite is a weighted blend of 9 inputs, each scored 0–100. Each bar is that input's sub-score; the figure is the points it added to the 100-point composite (weight × sub-score).
- Cash flow +14.2/30.0
- ARV discount +9.5/15.0
- DSCR +4.3/10.0
- 1% rule +3.5/10.0
- Rent growth +3.4/5.0
- Livability +3.0/5.0
- Condition / age +2.5/5.0
- Schools +2.2/10.0
- Appreciation +0.0/10.0
$145,000
🖨 Deal sheet 📄 Offer letter ✓ Due diligence
Listing remarks MLS
VERY WELL-MAINTAINED HOME, KITCHEN HAS A BREAKFAST BAR, LARGE DINING AREA, WONDERFUL FENCED IN YARD, SMALL FRONT PORCH, THREE BEDROOMS 1.5 BATHS, IN A SUBDIVISION THAT IS CLOSE TO SHOPPING, AND BAFB, SHOW AND SELL
Key facts
- 8,320 sq ft lot
- Parking
- Built 1958
Neighborhood map
What this means for you Summary
Snapshot
- This is a 3-bed/1.5-bath single-family listed at $145k.
Deal economics
- At list price, monthly cash flow is $24 ($286/yr) — positive.
- The deal already cash-flows at list — no discount required.
- To meet the 1% rule (rent ≥ 1% of price), the offer needs to be $123k (15.1% below list).
- Recommended offer: $123k (15.1% below list) — sets the bar for 1% rule.
Location & tenants
- Location reads 59/100 on livability (#270 in LA) — a working-class tenant base; expect higher turnover. Strengths: cost of living A+, housing A; Watch: schools D+, crime F, amenities F.
- Caddo Parish (urban): math 21% / reading 32% proficiency, ranked #53 of 98 in LA (top 54%) — low school quality limits family demand, transient renter base, plan for 1-2y turnover; 64% free/reduced lunch — lower-income household profile, screen leases tightly.
- Market conditions: Rents rising (+3.6%/yr); 146 active listings in the ZIP; 25 comparable units currently listed for rent nearby; rentals leasing fast (median 14d on market — plan ~1-2 weeks tenant-placement turnaround); 221 units permitted in Caddo Parish in 2024 (0 in 5+ unit buildings).
Forward outlook
- Local home prices are declining (-3.0%/yr); year-one equity from $1k of loan paydown is wiped out by about $4k of value loss. Plan a longer hold.
- Caddo County population projected at -15% by 2050 — secular population decline; favor cash flow + early exit over multi-decade hold.
Negotiation context
- Only 0 days on market — expect competitive offers; lowballing is unlikely to land.
- 2 sale attempts since 4y ago with the ask held roughly flat each time — persistent listings suggest the price (not the market) is what's stuck; bring a comps-based counter.
- Current owner paid $113k; 28% above their basis — modest negotiation headroom, anchor on the comps not their cost.
Risks & watch-outs
- Watch-outs: built in 1958 — expect roof / HVAC / electrical / plumbing capex.
- Climate carrying-cost: major wind risk, 66% chance of damaging wind over 30y; extreme-heat days projected 7→22/yr by 2055 (HVAC capex compounding) — expect insurance premiums to compound above CPI over the hold.
Questions for the listing agent
- Built in 1958 — when were the roof, HVAC, electrical panel, plumbing, and water heater last replaced?
- Is there a deadline driving the sale (1031 exchange, divorce, estate, relocation)? That informs how much negotiation room exists.
- Schools are D-rated, which usually means shorter tenancies and higher turnover. Who's the typical renter profile here, and what's been the actual vacancy rate?
- Crime grade is F in this area — have there been break-ins, vandalism, or insurance claims at this property in the last 3 years? What carrier currently insures it and at what premium?
- The area grade is low — what's the realistic commute time and amenity access for the typical tenant pool here? Any planned neighborhood developments (good or bad) we should know about?
- What's the average days-on-market for RENTAL listings here right now (not sales)? A rising rental-DOM trend means longer vacancies and softer asking-rent achievability than the comps imply.
- What's the recent tenant-quality profile in this submarket — average credit score on applications, eviction rate, late-payment / NSF rate, and stable-employment percentage? A property-management company in the area should have these aggregated.
- How much new for-sale + rental construction is in the pipeline within 1–3 miles? Heavy new supply typically softens prices + rents 12–24 months out; constrained supply supports both.
Investment metrics
- 1% rule
- 0.85% ✗
- Cap rate
- 6.49%
- Cash-on-cash
- 0.71%
- DSCR
- 1.03
- GRM
- 9.8
CMA / ARV
- ARV (on-the-fly)
- $151,844
- Comps found
- 12
Show comp detail 12 sales within ~0.75 mi
| Address | Dist | Beds/Ba | Sqft | Sold | Price | $/sf | Match |
|---|---|---|---|---|---|---|---|
| 1123 Georgia St | 0.00mi | 3/1.5 | 1,309 (0%) | 0mo | $145,000 | $111 | 100 |
| 2805 Doles Pl | 0.20mi | 3/1.5 | 1,249 (-5%) | 2mo | $149,900 | $120 | 82 |
| 1126 Carolina St | 0.03mi | 3/2.0 | 1,390 (+6%) | 6mo | $184,900 | $133 | 81 |
| 2903 Bolch St | 0.28mi | 3/1.5 | 1,275 (-3%) | 7mo | $147,900 | $116 | 77 |
| 2801 E Cavett Dr | 0.31mi | 3/1.5 | 1,224 (-6%) | 5mo | $174,500 | $143 | 70 |
| 2839 Alvin Ln | 0.18mi | 3/1.0 | 1,135 (-13%) | 2mo | $137,000 | $121 | 66 |
| 728 Kimbrough St | 0.54mi | 3/1.0 | 1,239 (-5%) | 1mo | $136,800 | $110 | 63 |
| 738 Acklen St | 0.53mi | 2/1.0 (-1) | 1,293 (-1%) | 8mo | $115,000 | $89 | 60 |
| 854 Surrey Rd | 0.51mi | 3/1.0 | 1,209 (-8%) | 5mo | $149,000 | $123 | 57 |
| 2608 E Cavett Dr | 0.42mi | 3/1.0 | 1,169 (-11%) | 5mo | $76,900 | $66 | 56 |
| 1305 Georgia St | 0.31mi | 3/1.0 | 1,495 (+14%) | 8mo | $158,000 | $106 | 54 |
| 2612 W Cavett Dr | 0.47mi | 3/1.0 | 1,121 (-14%) | 4mo | $130,000 | $116 | 49 |
Match score weights: distance 35% · size 25% · config 20% · recency 20%. Top-matched comps best support the ARV.
Projected returns pro-forma
-3.0% appreciation · 3.56% rent growth · sell at horizon
- IRR
- -14.6%
- Equity multiple
- 0.48×
- Total profit
- $-21,293
- Equity at exit
- $21,620
- IRR
- -5.1%
- Equity multiple
- 0.66×
- Total profit
- $-13,747
- Equity at exit
- $12,537
Cash invested: $40,600 (down + closing). Projections, not guarantees.
Landlord ↔ Tenant lean methodology
- Overall (STATE)
- 90 Strongly Landlord-Friendly
- State Louisiana
- 90 Strongly Landlord-Friendly · R+12
- County
- — inherits STATE
- City
- — inherits STATE
ZIP-level market 71104
- Home prices YoY
- -32.2%
- Rents YoY
- 3.6%
- Active inventory
- 146
- Price-to-rent
- 9.8×
Monthly cashflow live
- Estimated rent
- $1,231 high interval (Pro) →
- Mortgage (P&I)
- −$760
- Tax from tax record
- −$128 /mo · $1,535/yr
- Insurance
- −$60
- HOA
- −$0
- Vacancy / Maint / Mgmt
- −$259
- Net cashflow
- $24
Break-even live
UW: 25.0% down · 7.5% · 30yr · 1.5% tax · 5.0% vac · 8.0% maint · 8.0% mgmt
Financing live
Cash to close
- Down payment
- $36,250
- Closing costs
- $4,350
- Reserves months
- —
- Total cash needed
- —
Loan-product check · same deal, 3 products live
Conventional
25% down · 7.5% · 30yr
- Down + closing
- —
- Monthly P&I
- —
- Monthly cashflow
- —
- DSCR
- —
- Eligible?
- —
Personal DTI + credit; lowest rate.
DSCR
20% down · 8.5% · 30yr
- Down + closing
- —
- Monthly P&I
- —
- Monthly cashflow
- —
- DSCR
- —
- Eligible?
- —
No personal income docs; deal must DSCR.
Hard money
10% down · 12.0% · 12mo
- Down + closing
- —
- Monthly P&I
- —
- Monthly cashflow
- —
- DSCR
- —
- Eligible?
- —
Short-term bridge; refi at stabilization.
Rent comps 25 comps
| Address | Beds | Baths | Sqft | Rent | $/sqft | DOM | Units | Dist |
|---|---|---|---|---|---|---|---|---|
| 2903 Weyman St Shreveport, LA | 1.0–2.0 | 1.0 | 800 | $950 | $1.19 | 13d | 6 | 0.08mi |
| 1301 Coates Bluff Dr Shreveport, LA | 1.0–2.0 | 1.0–2.0 | 1004 | $2,300 | $2.29 | 13d | 11 | 0.28mi |
| 2615 Judith Pl Shreveport, LA | 3.0 | 2.0 | 1450 | $1,600 | $1.10 | 13d | 1 | 0.45mi |
| 818 E Washington St Shreveport, LA | 3.0 | 1.0 | 1100 | $1,300 | $1.18 | 21d | 1 | 0.45mi |
| 2506 Mecom Dr Shreveport, LA | 3.0 | 1.5 | 1433 | $1,350 | $0.94 | 13d | 1 | 0.53mi |
| 3131 Knight St Shreveport, LA | 1.0–2.0 | 1.0–2.0 | 866 | $985 | $1.14 | 13d | 11 | 0.54mi |
| 715 Camilla Dr Shreveport, LA | 3.0 | 1.0 | 1654 | $1,350 | $0.82 | 43d | 1 | 0.58mi |
| 3201 Knight St Shreveport, LA | 1.0–2.0 | 1.0 | 781 | $900 | $1.15 | 13d | 3 | 0.65mi |
| 3215 Knight St Shreveport, LA | 1.0–2.0 | 1.0–2.0 | 862 | $1,065 | $1.24 | 13d | 7 | 0.72mi |
| 1535 River Parkway Blvd Shreveport, LA | 1.0–3.0 | 1.0–2.0 | 928 | $2,042 | $2.20 | 13d | 10 | 0.78mi |
| 4024 Reily Ln Shreveport, LA | 3.0 | 1.0 | 1220 | $1,275 | $1.05 | 21d | 1 | 0.85mi |
| 140 E Wilkinson St Shreveport, LA | 3.0 | 3.0 | 1174 | $1,300 | $1.11 | 21d | 1 | 1.20mi |
| 3501 Champion Lake Blvd Shreveport, LA | 1.0–2.0 | 1.0–2.0 | 845 | $1,415 | $1.67 | 13d | 20 | 1.30mi |
| 126 E Olive St Shreveport, LA | 2.0 | 1.0 | 1200 | $1,500 | $1.25 | 13d | 1 | 1.30mi |
| 103 E Merrick St Shreveport, LA | 2.0 | 1.0 | 1200 | $900 | $0.75 | 44d | 1 | 1.31mi |
| 143 E Herndon St Unit 143 Shreveport, LA | 2.0 | 1.0 | 1200 | $830 | $0.69 | 21d | 1 | 1.35mi |
| 140 Wilkinson St Unit 142 Shreveport, LA | 3.0 | 3.0 | 1174 | $1,300 | $1.11 | 21d | 1 | 1.36mi |
| 140 Wilkinson St Unit 140 Shreveport, LA | 2.0 | 1.0 | 1000 | $1,200 | $1.20 | 21d | 1 | 1.36mi |
| 2515 Centenary Blvd Shreveport, LA | 2.0 | 1.0 | 1200 | $2,500 | $2.08 | 13d | 1 | 1.40mi |
| 144 Merrick St Shreveport, LA | 2.0 | 1.0 | 1532 | $800 | $0.52 | 43d | 1 | 1.41mi |
| 204 Boulevard St Shreveport, LA | 2.0 | 1.0 | 1028 | $1,195 | $1.16 | 43d | 1 | 1.44mi |
| 1225 Pecan St Unit B Shreveport, LA | 3.0 | 2.0 | 1070 | $900 | $0.84 | 21d | 1 | 1.46mi |
| 127 Herndon St Shreveport, LA | 2.0 | 1.0 | 1325 | $800 | $0.60 | 13d | 1 | 1.48mi |
| 204 Leo Ave Shreveport, LA | 4.0 | 2.0 | 1846 | $2,000 | $1.08 | 13d | 1 | 1.48mi |
| 3516 Alexander Ave Shreveport, LA | 2.0 | 1.0 | 1355 | $1,250 | $0.92 | 13d | 1 | 1.49mi |
Listing history 9 events
-
2026-05-19$145,000
-
2026-05-19historical
-
2022-11-14soldstatus $113,000
-
2022-11-10soldstatus Closed 213-char remark
Show marketing remark (213 chars)
VERY WELL-MAINTAINED HOME, KITCHEN HAS A BREAKFAST BAR, LARGE DINING AREA, WONDERFUL FENCED IN YARD, SMALL FRONT PORCH, THREE BEDROOMS 1.5 BATHS, IN A SUBDIVISION THAT IS CLOSE TO SHOPPING, AND BAFB, SHOW AND SELL
-
2022-10-14status Pending 213-char remark
Show marketing remark (213 chars)
VERY WELL-MAINTAINED HOME, KITCHEN HAS A BREAKFAST BAR, LARGE DINING AREA, WONDERFUL FENCED IN YARD, SMALL FRONT PORCH, THREE BEDROOMS 1.5 BATHS, IN A SUBDIVISION THAT IS CLOSE TO SHOPPING, AND BAFB, SHOW AND SELL
-
2022-10-11price $119,000 213-char remark
Show marketing remark (213 chars)
VERY WELL-MAINTAINED HOME, KITCHEN HAS A BREAKFAST BAR, LARGE DINING AREA, WONDERFUL FENCED IN YARD, SMALL FRONT PORCH, THREE BEDROOMS 1.5 BATHS, IN A SUBDIVISION THAT IS CLOSE TO SHOPPING, AND BAFB, SHOW AND SELL
-
2022-09-21$127,000 Active 213-char remark
Show marketing remark (213 chars)
VERY WELL-MAINTAINED HOME, KITCHEN HAS A BREAKFAST BAR, LARGE DINING AREA, WONDERFUL FENCED IN YARD, SMALL FRONT PORCH, THREE BEDROOMS 1.5 BATHS, IN A SUBDIVISION THAT IS CLOSE TO SHOPPING, AND BAFB, SHOW AND SELL
-
2006-05-01soldstatus
-
2000-07-25soldstatus
ⓘ Source: listings_history table (triggers on properties + properties_extension) + one-shot
backfill from property_details.listing_events for pre-trigger history.
Tax reassessment forecast LA · Resets to sale price
- Current annual tax
- $1,535 · $128/mo
- Projected year-2 tax
- $1,535 · $128/mo
- Expected delta
- $0/yr ($0/mo · 0.0%)
ⓘ Screening estimate from a state-policy table — verify with the county assessor before closing.
Climate risk First Street
- Flood 1/10 Low FEMA zone X · 0% chance over 30 yrs
- Wildfire 1/10 Low
- Heat 7/10 Severe 7 d/yr ≥111°F today · 22 d/yr by 30 yrs out
- Wind 6/10 Major 66% chance of damaging wind over 30 yrs
- Air quality 2/10 Low 1 unhealthy d/yr today · 2 by 30 yrs out
Nearby sold comps map
Loading sold comps map…
Walkable amenities ~0.75 mi
Loading nearby amenities…
Taxation est. · year 1
- Rental income
- $14,774
- − Mortgage interest
- −$8,122
- − Property taxes
- −$1,535
- − Insurance
- −$725
- − Repairs & maintenance
- −$1,182
- − Management
- −$1,182
- − Depreciation
- −$4,218
- Taxable loss
- −$2,191
- Est. tax savings @ 24.0%
- +$526
- After-tax cash flow
- $812/yr
For passive investors: Depreciation is non-cash, so a rental often shows a tax loss while cash-flowing — sheltering income. Rental losses are passive: they offset passive income freely, and up to $25,000/yr can offset ordinary (W-2) income if you actively participate and your MAGI is under $100k (phasing out to $0 by $150k); unused losses carry forward. On sale, claimed depreciation is recaptured at up to 25%, and gains may owe capital-gains tax (a 1031 exchange can defer both). Figures are a year-1 estimate at your 24.0% rate — not tax advice; consult a CPA.
Schools (NCES district)
- District
- Caddo Parish
- NCES district ID
- 2200300
- Math proficiency
- 21% ▼ -33.00%
- Reading proficiency
- 32% ▼ -30.00%
- Median HH income
- $39,227
- Composite
- 22.23/100
- National rank
- #8148
- State rank
- #53 of 98 in LA
Livability — Shreveport
- Score
- 59/100
- State rank
- #270
- US rank
- #19730
Category grades
Schools grade is shown separately in the Schools card above.
Census & demographics
- Census place
- Shreveport, LA
- County
- Caddo Parish · 178,536 people
- City population
- 164,123
- Metro
- Shreveport-Bossier City, LA
- Population (ZIP)
- 12,975
- Household income
- $56,833
- Rent vs Own
- Severe rent burden
- 759.0
Population outlook (Caddo County) Hauer SSP2
- Today (2025)
- 243,190 people
- By 2030
- 237,231 · -2.5%
- By 2040
- 222,502 · -8.5%
- By 2050
- 206,516 · -15.1%
- By 2075
- 165,706 · -31.9%
- By 2100
- 122,262 · -49.7%
Race, ethnicity, and origin ACS 2023
- Neighborhood character
- Diverse neighborhood (Simpson 0.63)
- Race & ethnicity
- White 53% Black 28% Two or more races 10% Hispanic / Latino 10% Asian 3%
- Hispanic origin (detail)
- Mexican 7%
- Common ancestry
- Slovak 6% Lithuanian 4% Scottish 2%
- Foreign-born
- 5% · Canada, Vietnam
- Languages at home
- 90% English-only · Spanish 5% French/Haitian/Cajun 1% Tagalog/Filipino 1%
Political lean MEDSL · Caddo
- 2024 margin
- Toss-up / Even · D 51.6% · R 47.0% · Other 1.4%
- 2008→2024 swing
- +1.6pp toward D · 2008: 3.0pp · 2024: 4.6pp
- All cycles
- 2024: D+4.6 2020: D+6.8 2016: D+4.2 2012: D+4.9 2008: D+3.0
Not yet ingested
- Civics
- —
Market trends
- HPI YoY
- ▼ -49.61%
- Current HPI
- 104.3781
- Rent YoY
- ▲ 3.56%
- Metro
- Shreveport-Bossier City, LA
- State GDP YoY
- ▲ 3.29%
- F500 in state
- 10
Industry mix (Fortune 500 HQ in LA)
| Industry | F500 HQs | Revenue |
|---|---|---|
| Telecommunications | 2 | $23B |
|
||
| Utilities | 1 | $12B |
|
||
| Wholesale / Distribution | 1 | $5B |
|
||
| Advertising | 1 | $2B |
|
||
Price history
+14.2% since first listed9 events — show timeline
- 2026-05-19 Listing Removed — NTREIS
- 2026-05-19 Listed $145,000 NTREIS
- 2022-11-14 Sold (Public Records) $113,000 Public Records
- 2022-11-10 Sold (MLS) — NTREIS
- 2022-10-14 Pending — NTREIS
- 2022-10-11 Price Changed $119,000 NTREIS
- 2022-09-21 Listed $127,000 NTREIS
- 2006-05-01 Sold (Public Records) — Public Records
- 2000-07-25 Sold (Public Records) — Public Records
Property tax history
+9.4%/yrLatest (2025): $1,535 · +0.4% YoY. Source: county tax records.
Cash-flow waterfall
monthlySold comps — $/sqft
last 12 mo · ≤1 miLoading sold comps…