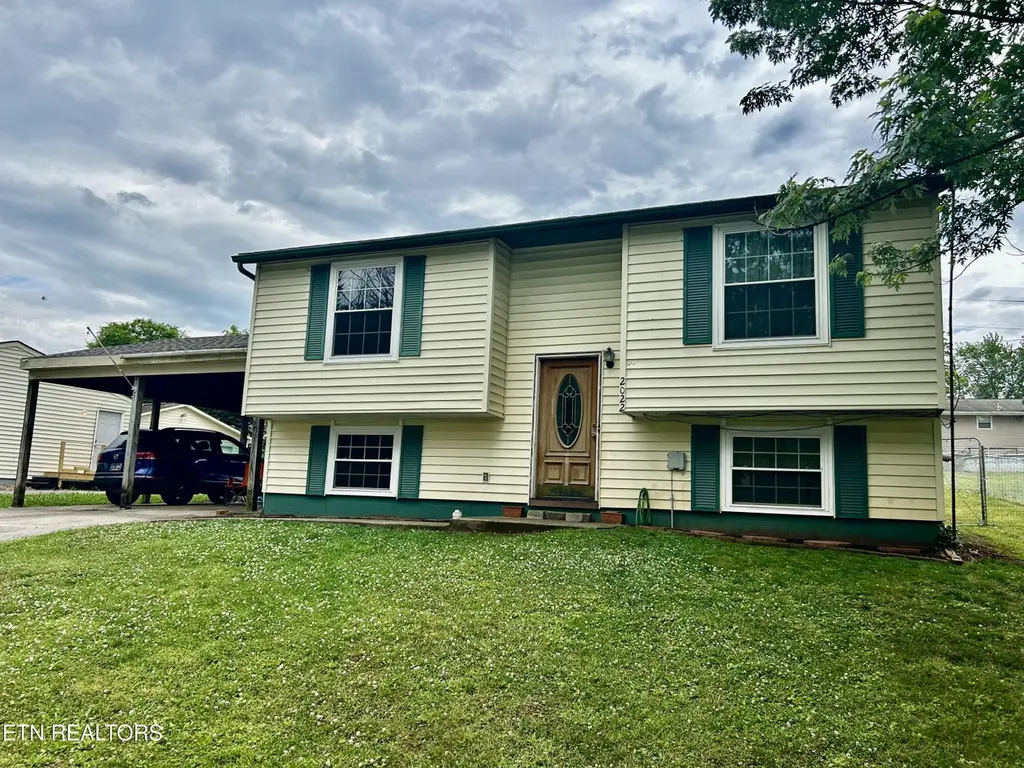
2022 Lansdowne Ln · Maryville, TN
Flood risk 1/10 · Minimal
- FEMA flood zone
- X (unshaded)
- Chance of flooding over 30 yrs
- 0.0%
- Est. flood insurance / yr
- $473 – $860
Fire risk 3/10 · Minor
- Est. fire insurance / yr
- $949 – $1,763
Heat risk 6/10 · Moderate
- Hot days now (above 103°F)
- 7 days/yr
- Hot days in 30 yrs
- 20 days/yr
Wind risk 2/10 · Minimal
- Chance of severe wind over 30 yrs
- —
Air-quality risk 3/10 · Minor
- Unhealthy air days now
- 2 days/yr
- Unhealthy air days in 30 yrs
- 2 days/yr
Risk factors via First Street. Map © Google.
Why this score? — see what drove the C- grade
The composite is a weighted blend of 9 inputs, each scored 0–100. Each bar is that input's sub-score; the figure is the points it added to the 100-point composite (weight × sub-score).
- ARV discount +15.0/15.0
- Cash flow +13.9/30.0
- Schools +4.8/10.0
- DSCR +4.2/10.0
- Rent growth +3.8/5.0
- Livability +3.6/5.0
- 1% rule +3.0/10.0
- Condition / age +2.5/5.0
- Appreciation +0.0/10.0
$289,900
🖨 Deal sheet (PDF) 📄 Offer letter ✓ Due diligence
Listing remarks
This home is full of potential and ready for its next chapter. With major updates already in place including a newer roof (2022), windows (2019), water heater (2024), and updated gas lines inside and out you have a solid foundation to build on. The layout offers flexibility to fit a variety of needs, featuring three bedrooms and two baths, plus a versatile lower-level flex space that could serve as a den, rec room, or even a fourth bedroom. Upstairs, you'll find solid wood doors that add warmth and character. Outside, enjoy a fenced backyard and a location that's hard to beat--within walking distance to John Sevier School, the community pool, and the park, with everyday conveniences just mi
Key facts
- Community pool
- Newer roof
- Updated gas lines
Tags
Property features AI
Finance
- Other: Lot about 0.22 acre; Approximate building area 1,932 (from tax records)
Exterior
- Parking: 2-space carport
- Utilities: Public sewer
- Home design: Detached property
- Construction: Vinyl siding; Brick; Frame construction
- Exterior features: Vinyl siding and brick with frame construction; Exterior storage structure
Interior
- Kitchen: Refrigerator
- Flooring: Carpet; Vinyl
- Bathrooms: 2 full bathrooms
- Heating & cooling: Central heating (natural gas); Central cooling
- Interior features: 7 total rooms; Finished basement; Windows are vinyl
- Laundry & utility: Washer; Dryer
Neighborhood map
What this means for you Summary
Snapshot
- This is a 3-bed/2.0-bath single-family listed at $290k.
Deal economics
- At list price, monthly cash flow is $32 ($378/yr) — positive.
- The deal already cash-flows at list — no discount required.
- To meet the 1% rule (rent ≥ 1% of price), the offer needs to be $233k (19.5% below list).
- Recommended offer: $233k (19.5% below list) — sets the bar for 1% rule.
- Cap rate 6.4% vs local median 3.6% in Maryville — top-decile yield for the area; either an underpriced asset or a hidden risk that comps aren't pricing in. Stress-test before assuming the spread holds.
Location & tenants
- Location reads 71/100 on livability (#38 in TN) — a middle-class / working-renter tenant base. Strengths: crime A+, cost of living A+, housing A+; Watch: amenities D, commute F, health & safety F.
- Maryville (suburban): math 58% / reading 55% proficiency, ranked #5 of 139 in TN (top 4%) — acceptable for families but not a draw, mixed tenant base, ~2y average lease.
- Zoned schools: John Sevier Elementary (math 67% / reading 52%, grade B-, #60 of 952 statewide, top 7%, 613 students, 0% FRL); Coulter Grove Intermediate School (math 60% / reading 56%, grade B, #9 of 333 statewide, top 2%, 881 students, 0% FRL); Maryville High School (math 15% / reading 60%, grade F, #32 of 332 statewide, top 9%, 1,242 students, 0% FRL) — zoned schools average 0% FRL vs 26% district-wide (26 pts lower); this property's tenant base skews higher-income than the district average.
- Market conditions: Rents rising fast (+5.3%/yr); 137 active listings in the ZIP; 2 comparable units currently listed for rent nearby; solid renter incomes; 937 units permitted in Blount County in 2024 (57 in 5+ unit buildings).
- This rent runs 35% of the median local income ($79k/yr) — at the standard rent-burdened threshold; future hikes will face affordability resistance.
Forward outlook
- Local home prices are declining (-3.0%/yr); year-one equity from $2k of loan paydown is wiped out by about $9k of value loss. Plan a longer hold.
- Blount County population projected at +8% by 2050 — modest demand growth; plan on rents tracking national, not racing it.
Negotiation context
- It's been on market 27 days — a 2% lower offer ($286k) is reasonable based on typical stale-listing flexibility.
Risks & watch-outs
- Climate carrying-cost: extreme-heat days projected 7→20/yr by 2055 (HVAC capex compounding) — expect insurance premiums to compound above CPI over the hold.
Questions for the listing agent
- Is there a deadline driving the sale (1031 exchange, divorce, estate, relocation)? That informs how much negotiation room exists.
- What's the average days-on-market for RENTAL listings here right now (not sales)? A rising rental-DOM trend means longer vacancies and softer asking-rent achievability than the comps imply.
- What's the recent tenant-quality profile in this submarket — average credit score on applications, eviction rate, late-payment / NSF rate, and stable-employment percentage? A property-management company in the area should have these aggregated.
- How much new for-sale + rental construction is in the pipeline within 1–3 miles? Heavy new supply typically softens prices + rents 12–24 months out; constrained supply supports both.
Investment metrics
- 1% rule
- 0.80% ✗
- Cap rate
- 6.42%
- Cash-on-cash
- 0.47%
- DSCR
- 1.02
- GRM
- 10.4
CMA / ARV
- ARV (on-the-fly)
- $444,540
- Comps found
- 6
Show comp detail 6 sales within ~0.75 mi
| Address | Dist | Beds/Ba | Sqft | Sold | Price | $/sf | Match |
|---|---|---|---|---|---|---|---|
| 2013 Wayne Cir | 0.19mi | 3/1.5 | 2,696 (-6%) | 11mo | $350,000 | $130 | 70 |
| 2019 Cheltenham Rd. Rd | 0.14mi | 4/3.0 (+1) | 2,976 (+4%) | 11mo | $208,800 | $70 | 69 |
| 103 Comanche Trl | 0.52mi | 4/3.0 (+1) | 2,946 (+3%) | 6mo | $466,000 | $158 | 57 |
| 1310 Mary Katherine Dr | 0.68mi | 4/3.5 (+1) | 2,862 (-0%) | 11mo | $595,000 | $208 | 48 |
| 1609 Jett Rd | 0.47mi | 4/3.0 (+1) | 2,520 (-12%) | 17mo | $383,500 | $152 | 35 |
| 1215 Withers Dr | 0.64mi | 4/3.0 (+1) | 2,992 (+4%) | 24mo | $463,000 | $155 | 34 |
Match score weights: distance 35% · size 25% · config 20% · recency 20%. Top-matched comps best support the ARV.
Projected returns pro-forma
-3.0% appreciation · 5.29% rent growth · sell at horizon
- IRR
- -13.3%
- Equity multiple
- 0.51×
- Total profit
- $-39,554
- Equity at exit
- $43,225
- IRR
- -1.4%
- Equity multiple
- 0.89×
- Total profit
- $-8,555
- Equity at exit
- $25,065
Cash invested: $81,172 (down + closing). Projections, not guarantees.
Landlord ↔ Tenant lean methodology
- Overall (STATE)
- 87 Strongly Landlord-Friendly
- State Tennessee
- 87 Strongly Landlord-Friendly · R+13
- County
- — inherits STATE
- City
- — inherits STATE
ZIP-level market 37804
- Home prices YoY
- -15.4%
- Rents YoY
- 5.3%
- Active inventory
- 137
- Price-to-rent
- 10.4×
Monthly cashflow live
- Estimated rent
- $2,332 medium interval (Pro) →
- Mortgage (P&I)
- −$1,520
- Tax from tax record
- −$170 /mo · $2,039/yr
- Insurance
- −$121
- HOA
- −$0
- Vacancy / Maint / Mgmt
- −$490
- Net cashflow
- $32
Break-even live
Sensitivity live
| Price | -10% $196 | -5% $114 | +0% $32 | +5% $-51 | +10% $-133 |
|---|---|---|---|---|---|
| Rent | -10% $-153 | -5% $-61 | +0% $32 | +5% $124 | +10% $216 |
| Rate | -1.0pp $178 | -0.5pp $105 | base $32 | +0.5pp $-44 | +1.0pp $-120 |
UW: 25.0% down · 7.5% · 30yr · 1.5% tax · 5.0% vac · 8.0% maint · 8.0% mgmt
Financing live
Cash to close
- Down payment
- $72,475
- Closing costs
- $8,697
- Reserves months
- —
- Total cash needed
- —
Loan-product check · same deal, 3 products live
Conventional
25% down · 7.5% · 30yr
- Down + closing
- —
- Monthly P&I
- —
- Monthly cashflow
- —
- DSCR
- —
- Eligible?
- —
Personal DTI + credit; lowest rate.
DSCR
20% down · 8.5% · 30yr
- Down + closing
- —
- Monthly P&I
- —
- Monthly cashflow
- —
- DSCR
- —
- Eligible?
- —
No personal income docs; deal must DSCR.
Hard money
10% down · 12.0% · 12mo
- Down + closing
- —
- Monthly P&I
- —
- Monthly cashflow
- —
- DSCR
- —
- Eligible?
- —
Short-term bridge; refi at stabilization.
Rent comps 2 comps
| Address | Beds | Baths | Sqft | Rent | $/sqft | DOM | Units | Dist |
|---|---|---|---|---|---|---|---|---|
| 1305 Forest Ave Maryville, TN | 3.0 | 3.0 | 2006 | $2,100 | $1.05 | 25d | 1 | 0.87mi |
| 212 Janet Ln Maryville, TN | 3.0 | 2.5 | 2200 | $2,500 | $1.14 | 25d | 1 | 1.21mi |
Listing history 17 events
-
2026-06-22days on market $289,900 Active 27 DOM
-
2026-06-18days on market $289,900 Active 24 DOM
-
2026-06-17days on market $289,900 Active 23 DOM
-
2026-06-16days on market $289,900 Active 22 DOM
-
2026-06-15days on market $289,900 Active 21 DOM
-
2026-06-14days on market $289,900 Active 19 DOM
-
2026-06-13pricedays on market $289,900 Active 18 DOM
-
2026-06-10days on market $299,900 Active 16 DOM
-
2026-06-09days on market $299,900 Active 15 DOM
-
2026-06-08days on market $299,900 Active 14 DOM
-
2026-06-07days on market $299,900 Active 13 DOM
-
2026-06-03days on market $299,900 Active 9 DOM
-
2026-06-02days on market $299,900 Active 8 DOM
-
2026-06-01days on market $299,900 Active 7 DOM
-
2026-05-31days on market $299,900 Active 6 DOM
-
2026-05-31days on market $299,900 Active 5 DOM
-
2026-05-25$299,900 Active
ⓘ Source: listings_history table (triggers on properties + properties_extension) + one-shot
backfill from property_details.listing_events for pre-trigger history.
Tax reassessment forecast TN · Resets to sale price
- Current annual tax
- $2,039 · $170/mo
- Projected year-2 tax
- $2,058 · $172/mo
- Expected delta
- +$19/yr (+$2/mo · 0.9%)
ⓘ Screening estimate from a state-policy table — verify with the county assessor before closing.
Climate risk First Street
- Flood 1/10 Low FEMA zone X (unshaded) · 0% chance over 30 yrs
- Wildfire 3/10 Moderate
- Heat 6/10 Major 7 d/yr ≥103°F today · 20 d/yr by 30 yrs out
- Wind 2/10 Low
- Air quality 3/10 Moderate 2 unhealthy d/yr today · 2 by 30 yrs out
Nearby sold comps map
Loading sold comps map…
Walkable amenities ~0.75 mi
Loading nearby amenities…
Taxation est. · year 1
- Rental income
- $27,988
- − Mortgage interest
- −$16,239
- − Property taxes
- −$2,039
- − Insurance
- −$1,450
- − Repairs & maintenance
- −$2,239
- − Management
- −$2,239
- − Depreciation
- −$8,433
- Taxable loss
- −$4,651
- Est. tax savings @ 24.0%
- +$1,116
- After-tax cash flow
- $1,495/yr
For passive investors: Depreciation is non-cash, so a rental often shows a tax loss while cash-flowing — sheltering income. Rental losses are passive: they offset passive income freely, and up to $25,000/yr can offset ordinary (W-2) income if you actively participate and your MAGI is under $100k (phasing out to $0 by $150k); unused losses carry forward. On sale, claimed depreciation is recaptured at up to 25%, and gains may owe capital-gains tax (a 1031 exchange can defer both). Figures are a year-1 estimate at your 24.0% rate — not tax advice; consult a CPA.
Schools (NCES district)
- District
- Maryville
- NCES district ID
- 4702700
- Math proficiency
- 58% ▼ -3.00%
- Reading proficiency
- 55% ▼ -3.00%
- Median HH income
- $52,318
- Composite
- 48.42/100
- National rank
- #2134
- State rank
- #5 of 139 in TN
Livability — Maryville
- Score
- 71/100
- State rank
- #38
- US rank
- #6533
Category grades
Schools grade is shown separately in the Schools card above.
Census & demographics
- Census place
- Maryville, TN
- County
- Blount County · 112,418 people
- City population
- 89,294
- Metro
- Knoxville, TN
- Population (ZIP)
- 27,382
- Household income
- $79,025
- Rent vs Own
- Severe rent burden
- 466.0
Population outlook (Blount County) Hauer SSP2
- Today (2025)
- 135,873 people
- By 2030
- 139,460 · +2.6%
- By 2040
- 144,767 · +6.5%
- By 2050
- 147,393 · +8.5%
- By 2075
- 151,597 · +11.6%
- By 2100
- 147,393 · +8.5%
Race, ethnicity, and origin ACS 2023
- Neighborhood character
- Predominantly White (87%)
- Race & ethnicity
- White 87% Hispanic / Latino 6% Two or more races 5% Black 3% Asian 1%
- Hispanic origin (detail)
- Mexican 4%
- Common ancestry
- Serbian 2% Slovak 2% Lithuanian 2%
- Foreign-born
- 3% · Canada, South Korea
- Languages at home
- 95% English-only · Spanish 3% Other Asian/Pacific 1%
Political lean MEDSL · Blount
- 2024 margin
- Solid R (+47.7) · D 25.5% · R 73.2% · Other 1.2%
- 2008→2024 swing
- -8.4pp toward R · 2008: -39.4pp · 2024: -47.7pp
- All cycles
- 2024: R+47.7 2020: R+44.2 2016: R+48.8 2012: R+45.7 2008: R+39.4
Not yet ingested
- Civics
- —
Market trends
- HPI YoY
- ▼ -62.46%
- Current HPI
- 343.4773
- Rent YoY
- ▲ 5.29%
- Metro
- Knoxville, TN
- State GDP YoY
- ▲ 2.78%
- F500 in state
- 22
Industry mix (Fortune 500 HQ in TN)
| Industry | F500 HQs | Revenue |
|---|---|---|
| Healthcare | 3 | $91B |
|
||
| Retail | 3 | $72B |
|
||
| Transportation / Logistics | 1 | $88B |
|
||
| Paper / Packaging | 1 | $19B |
|
||
| Insurance | 1 | $13B |
|
||
| Energy | 1 | $12B |
|
||
Price history
1 event — show timeline
- 2026-05-25 Listed $299,900 Knoxville MLS
Property tax history
+2.1%/yrLatest (2025): $2,039 · +0.0% YoY. Source: county tax records.
Cash-flow waterfall
monthlySold comps — $/sqft
last 12 mo · ≤1 miLoading sold comps…