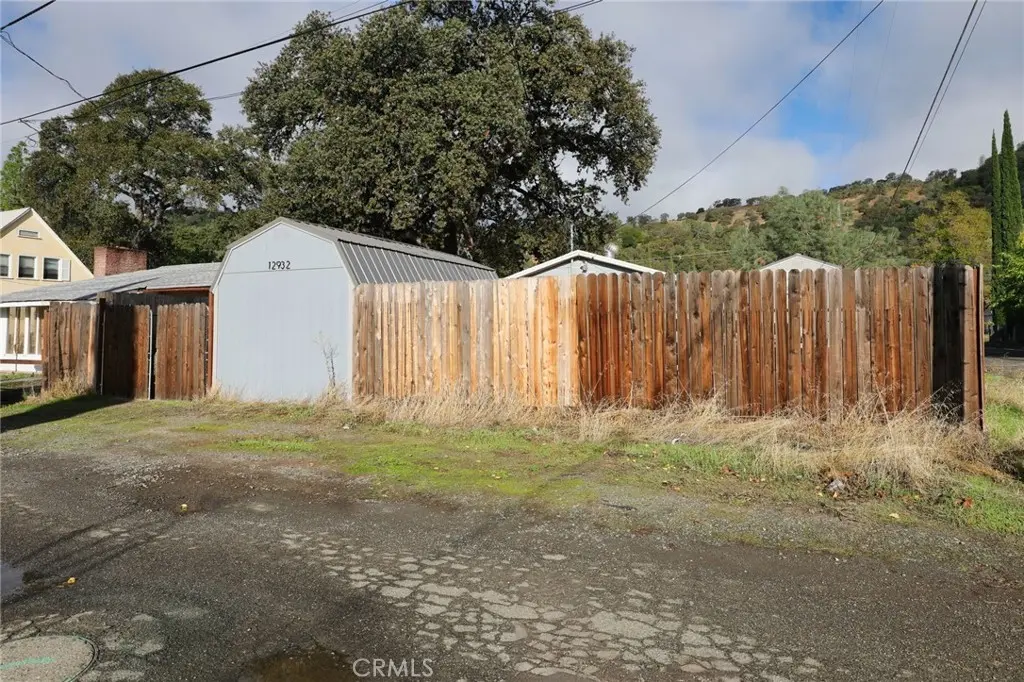
12932 3rd · Clearlake Oaks, CA
Flood risk 6/10 · Moderate
- FEMA flood zone
- X (shaded)
- Chance of flooding over 30 yrs
- 0.73%
- Est. flood insurance / yr
- $507 – $1,088
Fire risk 10/10 · Severe
- Est. fire insurance / yr
- $659 – $1,223
Heat risk 6/10 · Moderate
- Hot days now (above 99°F)
- 7 days/yr
- Hot days in 30 yrs
- 15 days/yr
Wind risk 1/10 · Minimal
- Chance of severe wind over 30 yrs
- —
Air-quality risk 10/10 · Severe
- Unhealthy air days now
- 32 days/yr
- Unhealthy air days in 30 yrs
- 34 days/yr
Risk factors via First Street. Map © Google.
Why this score? — see what drove the D+ grade
The composite is a weighted blend of 9 inputs, each scored 0–100. Each bar is that input's sub-score; the figure is the points it added to the 100-point composite (weight × sub-score).
- Cash flow +19.8/30.0
- ARV discount +9.0/15.0
- DSCR +6.3/10.0
- 1% rule +4.8/10.0
- Livability +3.0/5.0
- Rent growth +2.5/5.0
- Condition / age +2.5/5.0
- Schools +1.2/10.0
- Appreciation +0.0/10.0
$150,000
🖨 Deal sheet (PDF) 📄 Offer letter ✓ Due diligence
Listing remarks MLS
All fenced in with 3 tuff sheds on the property. Needs some tlc. Corner lot.
Key facts
- 3 tuff sheds
- Fenced in
- Corner lot
Tags
Neighborhood map
What this means for you Summary
Snapshot
- This is a 1-bed/1.0-bath single-family listed at $150k.
Deal economics
- At list price, monthly cash flow is $180 ($2k/yr) — positive.
- The deal already cash-flows at list — no discount required.
- To meet the 1% rule (rent ≥ 1% of price), the offer needs to be $147k (2.3% below list).
- Recommended offer: $132k (12.0% below list) — sets the bar for market timing.
- Cap rate 7.7% vs local median 4.3% in Clearlake Oaks — top-decile yield for the area; either an underpriced asset or a hidden risk that comps aren't pricing in. Stress-test before assuming the spread holds.
Location & tenants
- Location reads 60/100 on livability (#569 in CA) — a middle-class / working-renter tenant base. Strengths: housing A+, crime B; Watch: health & safety C-, amenities F, commute F.
- Konocti Unified (town): math 9% / reading 21% proficiency, ranked #494 of 517 in CA (top 96%) — low school quality limits family demand, transient renter base, plan for 1-2y turnover; 77% free/reduced lunch — lower-income household profile, screen leases tightly.
- Zoned schools: East Lake (math 2% / reading 12%, grade F, #1,555 of 1,571 statewide, top 99%, 244 students, 88% FRL); Highlands Academy (reading 24%, 12 students, 92% FRL); Lower Lake High (math 4% / reading 28%, grade F, #1,034 of 1,170 statewide, top 88%, 1,057 students, 79% FRL).
- Market conditions: 138 active listings in the ZIP; 107 units permitted in Lake County in 2024 (40 in 5+ unit buildings).
Forward outlook
- Local home prices are declining (-3.0%/yr); year-one equity from $1k of loan paydown is wiped out by about $4k of value loss. Plan a longer hold.
- Lake County population projected at -15% by 2050 — secular population decline; favor cash flow + early exit over multi-decade hold.
Negotiation context
- It's been on market 237 days — a 12% lower offer ($132k) is reasonable based on typical stale-listing flexibility.
- 4 sale attempts since 9y ago with the ask held roughly flat each time — persistent listings suggest the price (not the market) is what's stuck; bring a comps-based counter.
- Current owner paid $125k; 20% above their basis — modest negotiation headroom, anchor on the comps not their cost.
Risks & watch-outs
- Watch-outs: built in 1946 — expect roof / HVAC / electrical / plumbing capex.
- Climate carrying-cost: major flood risk; severe wildfire risk; extreme-heat days projected 7→15/yr by 2055 (HVAC capex compounding) — expect insurance premiums to compound above CPI over the hold.
Questions for the listing agent
- It's been on market 237 days. Have you received any prior offers? Is the seller open to a 12% concession, seller financing, or rate buy-down credit?
- Built in 1946 — when were the roof, HVAC, electrical panel, plumbing, and water heater last replaced?
- Why hasn't it sold? Are there any deal-killer items the seller is aware of (foundation, flood, title, zoning, code violations)?
- Is there a deadline driving the sale (1031 exchange, divorce, estate, relocation)? That informs how much negotiation room exists.
- Schools are F-rated, which usually means shorter tenancies and higher turnover. Who's the typical renter profile here, and what's been the actual vacancy rate?
- The area grade is low — what's the realistic commute time and amenity access for the typical tenant pool here? Any planned neighborhood developments (good or bad) we should know about?
- What's the average days-on-market for RENTAL listings here right now (not sales)? A rising rental-DOM trend means longer vacancies and softer asking-rent achievability than the comps imply.
- What's the recent tenant-quality profile in this submarket — average credit score on applications, eviction rate, late-payment / NSF rate, and stable-employment percentage? A property-management company in the area should have these aggregated.
- How much new for-sale + rental construction is in the pipeline within 1–3 miles? Heavy new supply typically softens prices + rents 12–24 months out; constrained supply supports both.
Investment metrics
- 1% rule
- 0.98% ✗
- Cap rate
- 7.73%
- Cash-on-cash
- 5.13%
- DSCR
- 1.23
- GRM
- 8.5
CMA / ARV
- ARV (median comp)
- $155,209
- List price
- $150,000
- Delta
- -3.36%
- Verdict
- FAIR
- Comps
- 13 within 1.0 mi
Show comp detail 2 sales within ~0.75 mi
| Address | Dist | Beds/Ba | Sqft | Sold | Price | $/sf | Match |
|---|---|---|---|---|---|---|---|
| 12881 4th | 0.12mi | 2/1.0 (+1) | 640 (+14%) | 5mo | $50,000 | $78 | 62 |
| 680 Pebble Way | 0.53mi | 2/1.0 (+1) | 624 (+11%) | 20mo | $216,500 | $347 | 34 |
Match score weights: distance 35% · size 25% · config 20% · recency 20%. Top-matched comps best support the ARV.
Projected returns pro-forma
-3.0% appreciation · 3.0% rent growth · sell at horizon
- IRR
- -8.3%
- Equity multiple
- 0.69×
- Total profit
- $-12,882
- Equity at exit
- $22,365
- IRR
- 1.2%
- Equity multiple
- 1.08×
- Total profit
- $3,456
- Equity at exit
- $12,969
Cash invested: $42,000 (down + closing). Projections, not guarantees.
Landlord ↔ Tenant lean methodology
- Overall (STATE)
- 18 Strongly Tenant-Friendly
- State California
- 18 Strongly Tenant-Friendly · D+13
- County
- — inherits STATE
- City
- — inherits STATE
ZIP-level market 95423
- Home prices YoY
- -20.6%
- Active inventory
- 138
- Price-to-rent
- 8.5×
Monthly cashflow live
- Estimated rent
- $1,466 medium interval (Pro) →
- Mortgage (P&I)
- −$787
- Tax from tax record
- −$130 /mo · $1,555/yr
- Insurance
- −$62
- HOA
- −$0
- Lot rent
- −$0
- Vacancy / Maint / Mgmt
- −$308
- Net cashflow
- $180
Break-even live
Sensitivity live
| Price | -10% $264 | -5% $222 | +0% $180 | +5% $137 | +10% $95 |
|---|---|---|---|---|---|
| Rent | -10% $64 | -5% $122 | +0% $180 | +5% $238 | +10% $295 |
| Rate | -1.0pp $255 | -0.5pp $218 | base $180 | +0.5pp $141 | +1.0pp $101 |
UW: 25.0% down · 7.5% · 30yr · 1.5% tax · 5.0% vac · 8.0% maint · 8.0% mgmt
Financing live
Cash to close
- Down payment
- $37,500
- Closing costs
- $4,500
- Reserves months
- —
- Total cash needed
- —
Loan-product check · same deal, 3 products live
Conventional
25% down · 7.5% · 30yr
- Down + closing
- —
- Monthly P&I
- —
- Monthly cashflow
- —
- DSCR
- —
- Eligible?
- —
Personal DTI + credit; lowest rate.
DSCR
20% down · 8.5% · 30yr
- Down + closing
- —
- Monthly P&I
- —
- Monthly cashflow
- —
- DSCR
- —
- Eligible?
- —
No personal income docs; deal must DSCR.
Hard money
10% down · 12.0% · 12mo
- Down + closing
- —
- Monthly P&I
- —
- Monthly cashflow
- —
- DSCR
- —
- Eligible?
- —
Short-term bridge; refi at stabilization.
Listing history 28 events
-
2026-06-23days on market $150,000 Active 237 DOM
-
2026-06-21days on market $150,000 Active 236 DOM
-
2026-06-19days on market $150,000 Active 234 DOM
-
2026-06-18days on market $150,000 Active 233 DOM
-
2026-06-17days on market $150,000 Active 232 DOM
-
2026-06-16days on market $150,000 Active 231 DOM
-
2026-06-15days on market $150,000 Active 230 DOM
-
2026-06-14days on market $150,000 Active 228 DOM
-
2026-06-13days on market $150,000 Active 227 DOM
-
2026-06-10days on market $150,000 Active 225 DOM
-
2026-06-09days on market $150,000 Active 224 DOM
-
2026-06-08days on market $150,000 Active 223 DOM
-
2026-06-07days on market $150,000 Active 222 DOM
-
2026-06-05days on market $150,000 Active 219 DOM
-
2026-06-02days on market $150,000 Active 217 DOM
-
2026-06-01days on market $150,000 Active 216 DOM
-
2026-05-31days on market $150,000 Active 215 DOM
-
2026-05-30days on market $150,000 Active 214 DOM
-
2025-10-28$150,000 Active 76-char remark
Show marketing remark (76 chars)
All fenced in with 3 tuff sheds on the property. Needs some tlc. Corner lot.
-
2018-08-03soldstatus $125,000 Closed Sale 382-char remark
Show marketing remark (382 chars)
This home has been completely remodeled and fully renovated with new flooring, paint, kitchen and bath. Plenty of storage with 3 out buildings that can be an office or shop. Home sits on a large corner lot with room for a garden and family gatherings. This one will not last long, and is priced right. Make this bungalow your new home or vacation spot here in beautiful Clear Lake.
-
2018-07-25Active Under Contract 382-char remark
Show marketing remark (382 chars)
This home has been completely remodeled and fully renovated with new flooring, paint, kitchen and bath. Plenty of storage with 3 out buildings that can be an office or shop. Home sits on a large corner lot with room for a garden and family gatherings. This one will not last long, and is priced right. Make this bungalow your new home or vacation spot here in beautiful Clear Lake.
-
2018-07-18soldstatus $125,000 Closed Sale 382-char remark
Show marketing remark (382 chars)
This home has been completely remodeled and fully renovated with new flooring, paint, kitchen and bath. Plenty of storage with 3 out buildings that can be an office or shop. Home sits on a large corner lot with room for a garden and family gatherings. This one will not last long, and is priced right. Make this bungalow your new home or vacation spot here in beautiful Clear Lake.
-
2018-06-04historical Active Under Contract 382-char remark
Show marketing remark (382 chars)
This home has been completely remodeled and fully renovated with new flooring, paint, kitchen and bath. Plenty of storage with 3 out buildings that can be an office or shop. Home sits on a large corner lot with room for a garden and family gatherings. This one will not last long, and is priced right. Make this bungalow your new home or vacation spot here in beautiful Clear Lake.
-
2018-05-23$119,000 Active 382-char remark
Show marketing remark (382 chars)
This home has been completely remodeled and fully renovated with new flooring, paint, kitchen and bath. Plenty of storage with 3 out buildings that can be an office or shop. Home sits on a large corner lot with room for a garden and family gatherings. This one will not last long, and is priced right. Make this bungalow your new home or vacation spot here in beautiful Clear Lake.
-
2018-05-05historical
-
2018-05-04price $89,000
-
2018-04-04price $99,000
-
2017-11-06$115,000 Active
ⓘ Source: listings_history table (triggers on properties + properties_extension) + one-shot
backfill from property_details.listing_events for pre-trigger history.
Tax reassessment forecast CA · Resets to sale price
- Current annual tax
- $1,555 · $130/mo
- Projected year-2 tax
- $1,555 · $130/mo
- Expected delta
- $0/yr ($0/mo · 0.0%)
ⓘ Screening estimate from a state-policy table — verify with the county assessor before closing.
Climate risk First Street
- Flood 6/10 Major FEMA zone X (shaded) · 73% chance over 30 yrs
- Wildfire 10/10 Extreme
- Heat 6/10 Major 7 d/yr ≥99°F today · 15 d/yr by 30 yrs out
- Wind 1/10 Low
- Air quality 10/10 Extreme 32 unhealthy d/yr today · 34 by 30 yrs out
Nearby sold comps map
Loading sold comps map…
Walkable amenities ~0.75 mi
Loading nearby amenities…
Taxation est. · year 1
- Rental income
- $17,594
- − Mortgage interest
- −$8,402
- − Property taxes
- −$1,555
- − Insurance
- −$750
- − Repairs & maintenance
- −$1,408
- − Management
- −$1,408
- − Depreciation
- −$4,364
- Taxable loss
- −$292
- Est. tax savings @ 24.0%
- +$70
- After-tax cash flow
- $2,225/yr
For passive investors: Depreciation is non-cash, so a rental often shows a tax loss while cash-flowing — sheltering income. Rental losses are passive: they offset passive income freely, and up to $25,000/yr can offset ordinary (W-2) income if you actively participate and your MAGI is under $100k (phasing out to $0 by $150k); unused losses carry forward. On sale, claimed depreciation is recaptured at up to 25%, and gains may owe capital-gains tax (a 1031 exchange can defer both). Figures are a year-1 estimate at your 24.0% rate — not tax advice; consult a CPA.
Schools (NCES district)
- District
- Konocti Unified
- NCES district ID
- 0620070
- Math proficiency
- 9% ▼ -5.00%
- Reading proficiency
- 21% ▼ -6.00%
- Median HH income
- $30,026
- Composite
- 11.81/100
- National rank
- #9677
- State rank
- #494 of 517 in CA
Livability — Clearlake Oaks
- Score
- 60/100
- State rank
- #569
- US rank
- #18675
Category grades
Schools grade is shown separately in the Schools card above.
Census & demographics
- Census place
- Clearlake Oaks, CA
- Population (ZIP)
- 3,432
Population outlook (Lake County) Hauer SSP2
- Today (2025)
- 62,396 people
- By 2030
- 60,626 · -2.8%
- By 2040
- 56,453 · -9.5%
- By 2050
- 53,054 · -15.0%
- By 2075
- 47,663 · -23.6%
- By 2100
- 41,804 · -33.0%
Race, ethnicity, and origin ACS 2023
- Neighborhood character
- Predominantly White (69%)
- Race & ethnicity
- White 69% Hispanic / Latino 18% Two or more races 9% Native American 3% Black 1% Asian 1%
- Hispanic origin (detail)
- Mexican 17%
- Common ancestry
- Slovak 5% Lithuanian 4% Russian 2%
- Foreign-born
- 11% · Canada, Vietnam
- Languages at home
- 84% English-only · Spanish 8% Other Indo-European 7% German/W. Germanic 1%
Political lean MEDSL · Lake
- 2024 margin
- Toss-up / Even · D 47.8% · R 49.2% · Other 3.0%
- 2008→2024 swing
- -20.6pp toward R · 2008: 19.3pp · 2024: -1.4pp
- All cycles
- 2024: R+1.4 2020: D+6.3 2016: D+3.7 2012: D+16.5 2008: D+19.3
Not yet ingested
- Civics
- —
Market trends
- HPI YoY
- ▼ -46.32%
- Current HPI
- 178.9812
- Rent YoY
- —
- Metro
- —
- State GDP YoY
- ▲ 3.21%
- F500 in state
- 116
Industry mix (Fortune 500 HQ in CA)
| Industry | F500 HQs | Revenue |
|---|---|---|
| Technology | 27 | $1,492B |
|
||
| Financial Services | 3 | $174B |
|
||
| Retail | 3 | $44B |
|
||
| Insurance | 3 | $26B |
|
||
| Media / Entertainment | 2 | $115B |
|
||
| Pharmaceuticals / Biotech | 2 | $62B |
|
||
Price history
+30.4% since first listed10 events — show timeline
- 2025-10-28 Listed $150,000 CRMLS
- 2018-08-03 Sold (MLS) $125,000 CRMLS
- 2018-07-25 Listed — CRMLS
- 2018-07-18 Sold (MLS) $125,000 CRMLS
- 2018-06-04 Contingent — CRMLS
- 2018-05-23 Listed $119,000 CRMLS
- 2018-05-05 Listing Removed — CRMLS
- 2018-05-04 Price Changed $89,000 CRMLS
- 2018-04-04 Price Changed $99,000 CRMLS
- 2017-11-06 Listed $115,000 CRMLS
Property tax history
+13.0%/yrLatest (2025): $1,555 · +1.1% YoY. Source: county tax records.
Cash-flow waterfall
monthlySold comps — $/sqft
last 12 mo · ≤1 miLoading sold comps…