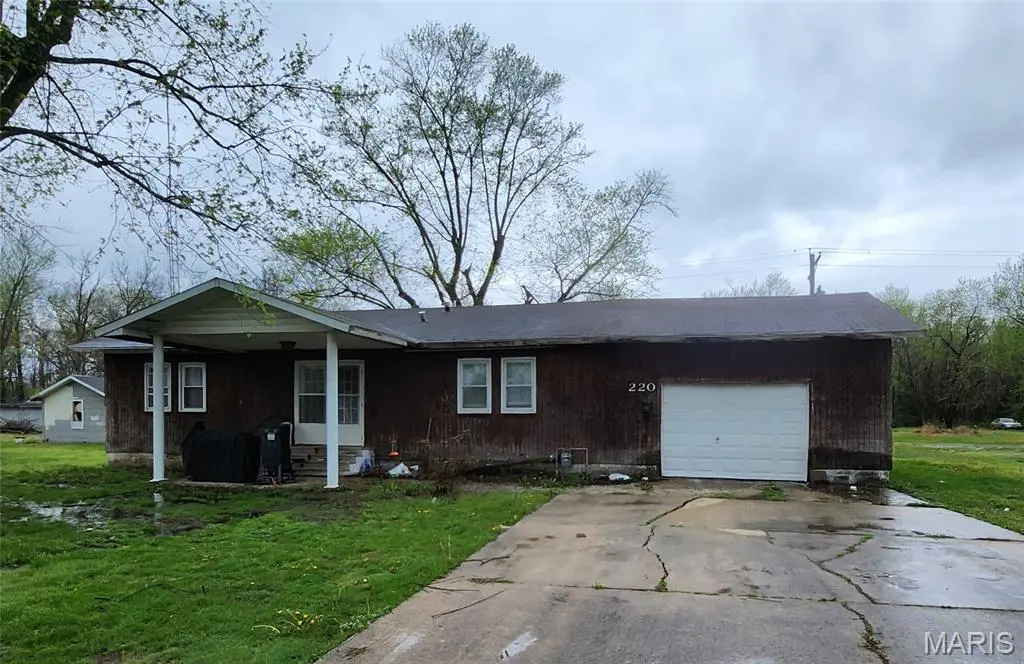
220 S Marion St · Central City, IL
Flood risk 1/10 · Minimal
- FEMA flood zone
- X (unshaded)
- Chance of flooding over 30 yrs
- 0.0%
- Est. flood insurance / yr
- $473 – $860
Fire risk 1/10 · Minimal
- Est. fire insurance / yr
- $804 – $1,492
Heat risk 4/10 · Minor
- Hot days now (above 106°F)
- 7 days/yr
- Hot days in 30 yrs
- 20 days/yr
Wind risk 2/10 · Minimal
- Chance of severe wind over 30 yrs
- 2.0%
Air-quality risk 2/10 · Minimal
- Unhealthy air days now
- 1 days/yr
- Unhealthy air days in 30 yrs
- 1 days/yr
Risk factors via First Street. Map © Google.
Why this score? — see what drove the B- grade
The composite is a weighted blend of 9 inputs, each scored 0–100. Each bar is that input's sub-score; the figure is the points it added to the 100-point composite (weight × sub-score).
- Cash flow +30.0/30.0
- 1% rule +10.0/10.0
- DSCR +10.0/10.0
- ARV discount +7.5/15.0
- Livability +3.2/5.0
- Rent growth +2.5/5.0
- Condition / age +2.5/5.0
- Schools +2.2/10.0
- Appreciation +0.0/10.0
$39,900
🖨 Deal sheet 📄 Offer letter ✓ Due diligence
Listing remarks MLS
Welcome Home to 220 S. Marion Street! This ranch-style home features an attached 1 car garage and approximately 1,176 square feet! SOLD AS-IS. This property is eligible under the Freddie Mac First Look Initiative though 10/28/25. Seller will not complete any repairs to the subject property, either lender or buyer requested. The property is sold in AS IS condition Taxes prorated at 100 precent. EM MUST BE CERTIFIED FUNDS. Info not guaranteed. Seller does not provide survey. Equal Housing Opportunity. AS-IS
Key facts
- 0.29 acre lot
- Garage
- Built 1920
Property features AI
Finance
- Other: Living area reported as about 1,176–1,191 (public records)
Exterior
- Parking: Attached garage (1 car)
- Utilities: Public water; Public sewer; Single-phase electric service; Natural gas available
- Home design: Single-family residence; One story
- Construction: Wood siding construction
- Exterior features: Lot features: Other; Lot dimensions approximately 50 x 125
Interior
- Bedrooms: Three bedrooms on the main level
- Bathrooms: One full bathroom (main level)
- Heating & cooling: Forced air heating; Central air conditioning
- Interior features: Five total rooms
Neighborhood map
What this means for you Summary
Snapshot
- This is a 3-bed/1.0-bath other listed at $40k.
Deal economics
- At list price, monthly cash flow is $687 ($8k/yr) — positive.
- The deal already cash-flows at list — no discount required.
- Meets the 1% rule at list price ($1k rent vs $40k).
- Recommended offer: $38k (6.0% below list) — sets the bar for market timing.
Location & tenants
- Location reads 63/100 on livability (#742 in IL) — a middle-class / working-renter tenant base. Strengths: cost of living A+, crime A, housing A-; Watch: amenities F, commute F, employment F.
- Centralia Hsd 200 (town): math 21% / reading 26% proficiency, ranked #668 of 919 in IL (top 73%) — low school quality limits family demand, transient renter base, plan for 1-2y turnover.
- Zoned schools: Centralia High School (math 22% / reading 17%, grade F, #397 of 693 statewide, top 61%, 863 students, 0% FRL).
- Market conditions: 99 active listings in the ZIP; 2 units permitted in Marion County in 2024 (0 in 5+ unit buildings).
Forward outlook
- Local home prices are declining (-3.0%/yr); year-one equity from $276 of loan paydown is wiped out by about $1k of value loss. Plan a longer hold.
- Marion County population projected at -20% by 2050 — secular population decline; favor cash flow + early exit over multi-decade hold.
- At projected returns (-3.0% appreciation + 3.0% rent growth), your $11k cash investment doubles in ~2 years — after that, you're playing with house money.
Negotiation context
- It's been on market 63 days — a 6% lower offer ($38k) is reasonable based on typical stale-listing flexibility.
- 2 sale attempts with the ask held roughly flat each time — persistent listings suggest the price (not the market) is what's stuck; bring a comps-based counter.
Risks & watch-outs
- Watch-outs: built in 1920 — expect roof / HVAC / electrical / plumbing capex.
Questions for the listing agent
- It's been on market 63 days. Have you received any prior offers? Is the seller open to a 6% concession, seller financing, or rate buy-down credit?
- Built in 1920 — when were the roof, HVAC, electrical panel, plumbing, and water heater last replaced?
- Why hasn't it sold? Are there any deal-killer items the seller is aware of (foundation, flood, title, zoning, code violations)?
- Is there a deadline driving the sale (1031 exchange, divorce, estate, relocation)? That informs how much negotiation room exists.
- Schools are D-rated, which usually means shorter tenancies and higher turnover. Who's the typical renter profile here, and what's been the actual vacancy rate?
- What's the average days-on-market for RENTAL listings here right now (not sales)? A rising rental-DOM trend means longer vacancies and softer asking-rent achievability than the comps imply.
- What's the recent tenant-quality profile in this submarket — average credit score on applications, eviction rate, late-payment / NSF rate, and stable-employment percentage? A property-management company in the area should have these aggregated.
- How much new for-sale + rental construction is in the pipeline within 1–3 miles? Heavy new supply typically softens prices + rents 12–24 months out; constrained supply supports both.
Investment metrics
- 1% rule
- 3.15% ✓
- Cap rate
- 26.94%
- Cash-on-cash
- 73.75%
- DSCR
- 4.28
- GRM
- 2.6
CMA / ARV
No comps found within radius.
Projected returns pro-forma
-3.0% appreciation · 3.0% rent growth · sell at horizon
- IRR
- 73.6%
- Equity multiple
- 4.34×
- Total profit
- $37,303
- Equity at exit
- $5,949
- IRR
- 77.4%
- Equity multiple
- 8.96×
- Total profit
- $88,946
- Equity at exit
- $3,450
Cash invested: $11,172 (down + closing). Projections, not guarantees.
Landlord ↔ Tenant lean methodology
- Overall (STATE)
- 43 Moderately Tenant-Leaning
- State Illinois
- 43 Moderately Tenant-Leaning · D+7
- County
- — inherits STATE
- City
- — inherits STATE
ZIP-level market 62801
- Home prices YoY
- -13.9%
- Active inventory
- 99
- Price-to-rent
- 2.6×
Monthly cashflow live
- Estimated rent
- $1,256 medium interval (Pro) →
- Mortgage (P&I)
- −$209
- Tax from tax record
- −$80 /mo · $960/yr
- Insurance
- −$17
- HOA
- −$0
- Vacancy / Maint / Mgmt
- −$264
- Net cashflow
- $687
Break-even live
UW: 25.0% down · 7.5% · 30yr · 1.5% tax · 5.0% vac · 8.0% maint · 8.0% mgmt
Financing live
Cash to close
- Down payment
- $9,975
- Closing costs
- $1,197
- Reserves months
- —
- Total cash needed
- —
Loan-product check · same deal, 3 products live
Conventional
25% down · 7.5% · 30yr
- Down + closing
- —
- Monthly P&I
- —
- Monthly cashflow
- —
- DSCR
- —
- Eligible?
- —
Personal DTI + credit; lowest rate.
DSCR
20% down · 8.5% · 30yr
- Down + closing
- —
- Monthly P&I
- —
- Monthly cashflow
- —
- DSCR
- —
- Eligible?
- —
No personal income docs; deal must DSCR.
Hard money
10% down · 12.0% · 12mo
- Down + closing
- —
- Monthly P&I
- —
- Monthly cashflow
- —
- DSCR
- —
- Eligible?
- —
Short-term bridge; refi at stabilization.
Listing history 19 events
-
2026-06-18days on market $39,900 Active 63 DOM
-
2026-06-17days on market $39,900 Active 62 DOM
-
2026-06-16days on market $39,900 Active 61 DOM
-
2026-06-15days on market $39,900 Active 60 DOM
-
2026-06-13days on market $39,900 Active 58 DOM
-
2026-06-12days on market $39,900 Active 57 DOM
-
2026-06-09days on market $39,900 Active 54 DOM
-
2026-06-08days on market $39,900 Active 53 DOM
-
2026-06-07days on market $39,900 Active 52 DOM
-
2026-06-07days on market $39,900 Active 51 DOM
-
2026-06-04days on market $39,900 Active 48 DOM
-
2026-06-02days on market $39,900 Active 47 DOM
-
2026-06-01days on market $39,900 Active 46 DOM
-
2026-05-31days on market $39,900 Active 45 DOM
-
2026-05-31days on market $39,900 Active 44 DOM
-
2026-04-16$39,900 Active
-
2026-03-27soldstatus Closed 510-char remark
Show marketing remark (510 chars)
Welcome Home to 220 S. Marion Street! This ranch-style home features an attached 1 car garage and approximately 1,176 square feet! SOLD AS-IS. This property is eligible under the Freddie Mac First Look Initiative though 10/28/25. Seller will not complete any repairs to the subject property, either lender or buyer requested. The property is sold in AS IS condition Taxes prorated at 100 precent. EM MUST BE CERTIFIED FUNDS. Info not guaranteed. Seller does not provide survey. Equal Housing Opportunity. AS-IS
-
2025-12-05status Pending 510-char remark
Show marketing remark (510 chars)
Welcome Home to 220 S. Marion Street! This ranch-style home features an attached 1 car garage and approximately 1,176 square feet! SOLD AS-IS. This property is eligible under the Freddie Mac First Look Initiative though 10/28/25. Seller will not complete any repairs to the subject property, either lender or buyer requested. The property is sold in AS IS condition Taxes prorated at 100 precent. EM MUST BE CERTIFIED FUNDS. Info not guaranteed. Seller does not provide survey. Equal Housing Opportunity. AS-IS
-
2025-10-15$1 Auction 510-char remark
Show marketing remark (510 chars)
Welcome Home to 220 S. Marion Street! This ranch-style home features an attached 1 car garage and approximately 1,176 square feet! SOLD AS-IS. This property is eligible under the Freddie Mac First Look Initiative though 10/28/25. Seller will not complete any repairs to the subject property, either lender or buyer requested. The property is sold in AS IS condition Taxes prorated at 100 precent. EM MUST BE CERTIFIED FUNDS. Info not guaranteed. Seller does not provide survey. Equal Housing Opportunity. AS-IS
ⓘ Source: listings_history table (triggers on properties + properties_extension) + one-shot
backfill from property_details.listing_events for pre-trigger history.
Tax reassessment forecast IL · Partial reset (capped growth)
- Current annual tax
- $960 · $80/mo
- Projected year-2 tax
- $960 · $80/mo
- Expected delta
- $0/yr ($0/mo · 0.0%)
ⓘ Screening estimate from a state-policy table — verify with the county assessor before closing.
Climate risk First Street
- Flood 1/10 Low FEMA zone X (unshaded) · 0% chance over 30 yrs
- Wildfire 1/10 Low
- Heat 4/10 Moderate 7 d/yr ≥106°F today · 20 d/yr by 30 yrs out
- Wind 2/10 Low 2% chance of damaging wind over 30 yrs
- Air quality 2/10 Low 1 unhealthy d/yr today · 1 by 30 yrs out
Nearby sold comps map
Loading sold comps map…
Walkable amenities ~0.75 mi
Loading nearby amenities…
Taxation est. · year 1
- Rental income
- $15,076
- − Mortgage interest
- −$2,235
- − Property taxes
- −$960
- − Insurance
- −$200
- − Repairs & maintenance
- −$1,206
- − Management
- −$1,206
- − Depreciation
- −$1,161
- Taxable income
- $8,108
- Est. tax owed @ 24.0%
- −$1,946
- After-tax cash flow
- $6,293/yr
For passive investors: Depreciation is non-cash, so a rental often shows a tax loss while cash-flowing — sheltering income. Rental losses are passive: they offset passive income freely, and up to $25,000/yr can offset ordinary (W-2) income if you actively participate and your MAGI is under $100k (phasing out to $0 by $150k); unused losses carry forward. On sale, claimed depreciation is recaptured at up to 25%, and gains may owe capital-gains tax (a 1031 exchange can defer both). Figures are a year-1 estimate at your 24.0% rate — not tax advice; consult a CPA.
Schools (NCES district)
- District
- Centralia Hsd 200
- NCES district ID
- 1709300
- Math proficiency
- 21% ▲ 6.00%
- Reading proficiency
- 26% ▲ 1.00%
- Median HH income
- $34,555
- Composite
- 22.43/100
- National rank
- #13470
- State rank
- #668 of 919 in IL
Livability — Central City
- Score
- 63/100
- State rank
- #742
- US rank
- #14968
Category grades
Schools grade is shown separately in the Schools card above.
Census & demographics
- Census place
- Central City, IL
- Population (ZIP)
- 19,941
Population outlook (Marion County) Hauer SSP2
- Today (2025)
- 36,071 people
- By 2030
- 34,598 · -4.1%
- By 2040
- 31,754 · -12.0%
- By 2050
- 28,912 · -19.8%
- By 2075
- 22,527 · -37.5%
- By 2100
- 16,455 · -54.4%
Race, ethnicity, and origin ACS 2023
- Neighborhood character
- Predominantly White (81%)
- Race & ethnicity
- White 81% Black 11% Two or more races 4% Hispanic / Latino 4% Asian 1%
- Common ancestry
- Serbian 2% Romanian 2% Lithuanian 1%
- Foreign-born
- 3% · Canada, China
- Languages at home
- 96% English-only · Spanish 2%
Political lean MEDSL · Marion
- 2024 margin
- Solid R (+49.5) · D 24.6% · R 74.1% · Other 1.4%
- 2008→2024 swing
- -47.5pp toward R · 2008: -2.0pp · 2024: -49.5pp
- All cycles
- 2024: R+49.5 2020: R+46.6 2016: R+44.9 2012: R+19.2 2008: R+2.0
Not yet ingested
- Civics
- —
Market trends
- HPI YoY
- ▼ -34.12%
- Current HPI
- 211.3835
- Rent YoY
- —
- Metro
- —
- State GDP YoY
- ▲ 1.59%
- F500 in state
- 60
Industry mix (Fortune 500 HQ in IL)
| Industry | F500 HQs | Revenue |
|---|---|---|
| Insurance | 4 | $201B |
|
||
| Consumer Goods | 4 | $87B |
|
||
| Industrial Machinery | 3 | $64B |
|
||
| Healthcare | 2 | $55B |
|
||
| Retail / Pharmacy | 1 | $148B |
|
||
| Agriculture / Food | 1 | $86B |
|
||
Price history
4 events — show timeline
- 2026-04-16 Listed $39,900 MARIS as Distributed by MLS Grid
- 2026-03-27 Sold (MLS) — MRED as Distributed by MLS Grid
- 2025-12-05 Pending — MRED as Distributed by MLS Grid
- 2025-10-15 Listed $1 MRED as Distributed by MLS Grid
Property tax history
-0.1%/yrLatest (2024): $960 · -3.3% YoY. Source: county tax records.
Cash-flow waterfall
monthlySold comps — $/sqft
last 12 mo · ≤1 miLoading sold comps…