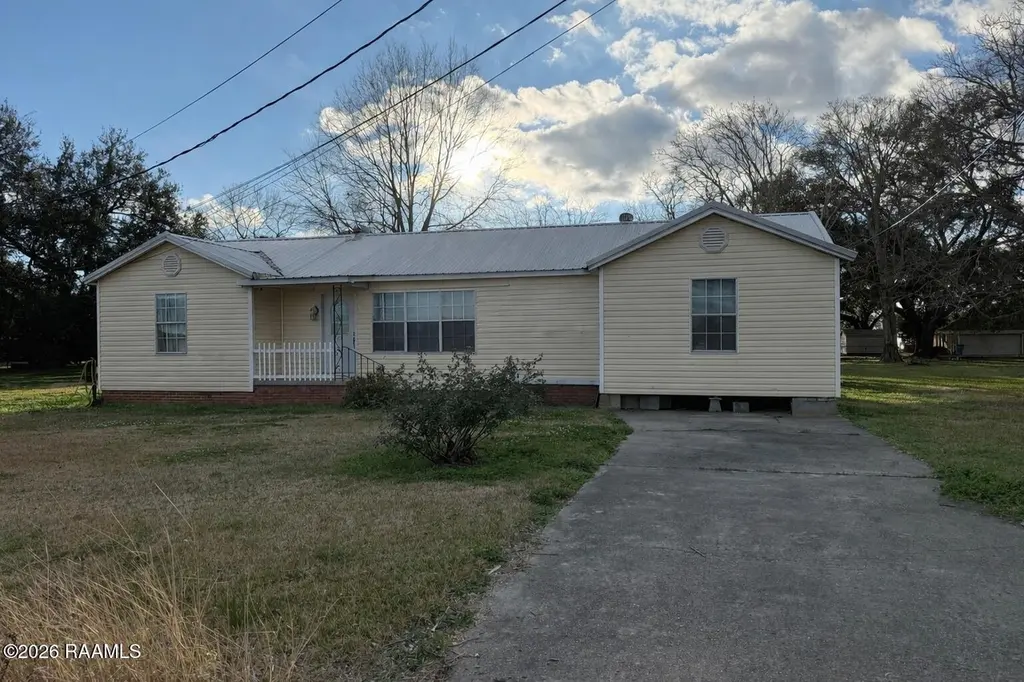
1914 Chatsworth Rd · Franklin, LA
Flood risk 5/10 · Moderate
- FEMA flood zone
- AE
- Chance of flooding over 30 yrs
- 0.23%
- Est. flood insurance / yr
- $1,737 – $8,500
Fire risk 1/10 · Minimal
- Est. fire insurance / yr
- $1,269 – $2,357
Heat risk 9/10 · Severe
- Hot days now (above 105°F)
- 7 days/yr
- Hot days in 30 yrs
- 23 days/yr
Wind risk 9/10 · Severe
- Chance of severe wind over 30 yrs
- 99.0%
Air-quality risk 1/10 · Minimal
- Unhealthy air days now
- 0 days/yr
- Unhealthy air days in 30 yrs
- 0 days/yr
Risk factors via First Street. Map © Google.
Why this score? — see what drove the A- grade
The composite is a weighted blend of 9 inputs, each scored 0–100. Each bar is that input's sub-score; the figure is the points it added to the 100-point composite (weight × sub-score).
- Cash flow +30.0/30.0
- ARV discount +15.0/15.0
- DSCR +10.0/10.0
- 1% rule +9.7/10.0
- Appreciation +6.3/10.0
- Livability +3.4/5.0
- Schools +2.8/10.0
- Rent growth +2.5/5.0
- Condition / age +2.5/5.0
$90,000
🖨 Deal sheet (PDF) 📄 Offer letter ✓ Due diligence
Listing remarks MLS
Opportunity awaits! This 3 bedroom, 2 bathroom home offers generous square footage and tons of potential for the right buyer. With a spacious layout and solid footprint, this property would make an excellent rental investment or a great option for someone looking to fully renovate and customize before moving in.Located outside city limits and less than one mile from Bayou Bend, you'll enjoy added flexibility with a convenient location. Bring your vision and make this one your own!
Key facts
- 0.38 acre lot
- 2 parking spots
- Listed 121 days
Neighborhood map
What this means for you Summary
Snapshot
- This is a 3-bed/2.0-bath single-family listed at $90k.
Deal economics
- At list price, monthly cash flow is $10 ($116/yr) — positive.
- The deal already cash-flows at list — no discount required.
- Meets the 1% rule at list price ($1k rent vs $90k).
- Recommended offer: $79k (12.0% below list) — sets the bar for market timing.
- Cap rate 12.1% vs local median 5.9% in Franklin — top-decile yield for the area; either an underpriced asset or a hidden risk that comps aren't pricing in. Stress-test before assuming the spread holds.
Location & tenants
- Location reads 67/100 on livability (#107 in LA) — a middle-class / working-renter tenant base. Strengths: cost of living A+, housing A+, health & safety B+; Watch: crime F, amenities F, commute F.
- St. Mary Parish (town): math 28% / reading 39% proficiency, ranked #37 of 98 in LA (top 38%) — families likely to look elsewhere, expect single-tenant / working-renter base with shorter leases; 68% free/reduced lunch — lower-income household profile, screen leases tightly.
- Market conditions: 93 active listings in the ZIP; 37 units permitted in St. Mary Parish in 2024 (20 in 5+ unit buildings).
Forward outlook
- In year one you build about $3k of equity ($622 loan paydown + $2k appreciation (2.6% local appreciation)).
- St. Mary County population projected at -18% by 2050 — secular population decline; favor cash flow + early exit over multi-decade hold.
- At projected returns (2.6% appreciation + 3.0% rent growth), your $25k cash investment doubles in ~7 years — after that, you're playing with house money.
Negotiation context
- It's been on market 122 days — a 12% lower offer ($79k) is reasonable based on typical stale-listing flexibility.
Risks & watch-outs
- Watch-outs: flood insurance adds $427/mo.
- Climate carrying-cost: in FEMA flood zone AE (mandatory federal flood insurance); severe wind risk, 99% chance of damaging wind over 30y; extreme-heat days projected 7→23/yr by 2055 (HVAC capex compounding) — expect insurance premiums to compound above CPI over the hold.
Questions for the listing agent
- It's been on market 122 days. Have you received any prior offers? Is the seller open to a 12% concession, seller financing, or rate buy-down credit?
- What's the actual annual flood-insurance premium (NFIP or private), and is the property in a SFHA with mandatory coverage?
- Why hasn't it sold? Are there any deal-killer items the seller is aware of (foundation, flood, title, zoning, code violations)?
- Is there a deadline driving the sale (1031 exchange, divorce, estate, relocation)? That informs how much negotiation room exists.
- Crime grade is F in this area — have there been break-ins, vandalism, or insurance claims at this property in the last 3 years? What carrier currently insures it and at what premium?
- What's the average days-on-market for RENTAL listings here right now (not sales)? A rising rental-DOM trend means longer vacancies and softer asking-rent achievability than the comps imply.
- What's the recent tenant-quality profile in this submarket — average credit score on applications, eviction rate, late-payment / NSF rate, and stable-employment percentage? A property-management company in the area should have these aggregated.
- How much new for-sale + rental construction is in the pipeline within 1–3 miles? Heavy new supply typically softens prices + rents 12–24 months out; constrained supply supports both.
Investment metrics
- 1% rule
- 1.47% ✓
- Cap rate
- 12.11%
- Cash-on-cash
- 20.77%
- DSCR
- 1.92
- GRM
- 5.7
CMA / ARV
- ARV (median comp)
- $128,644
- List price
- $90,000
- Delta
- -30.04%
- Verdict
- UNDERPRICED
- Comps
- 18 within 1.0 mi
Show comp detail 1 sale within ~0.75 mi
| Address | Dist | Beds/Ba | Sqft | Sold | Price | $/sf | Match |
|---|---|---|---|---|---|---|---|
| 2111 Hebert St | 0.10mi | 3/2.0 | 2,002 (-10%) | 23mo | $132,800 | $66 | 60 |
Match score weights: distance 35% · size 25% · config 20% · recency 20%. Top-matched comps best support the ARV.
Projected returns pro-forma
2.56% appreciation · 3.0% rent growth · sell at horizon
- IRR
- 6.8%
- Equity multiple
- 1.38×
- Total profit
- $9,629
- Equity at exit
- $38,234
- IRR
- 10.0%
- Equity multiple
- 2.45×
- Total profit
- $36,463
- Equity at exit
- $57,242
Cash invested: $25,200 (down + closing). Projections, not guarantees.
Landlord ↔ Tenant lean methodology
- Overall (STATE)
- 90 Strongly Landlord-Friendly
- State Louisiana
- 90 Strongly Landlord-Friendly · R+12
- County
- — inherits STATE
- City
- — inherits STATE
ZIP-level market 70538
- Home prices YoY
- 3.2%
- Active inventory
- 93
- Price-to-rent
- 5.7×
Monthly cashflow live
- Estimated rent
- $1,320 medium interval (Pro) →
- Mortgage (P&I)
- −$472
- Tax from tax record
- −$97 /mo · $1,162/yr
- Insurance
- −$38
- Flood insurance flood zone
- −$427 /mo · $5,118/yr
- HOA
- −$0
- Vacancy / Maint / Mgmt
- −$277
- Net cashflow
- $10
Break-even live
Sensitivity live
| Price | -10% $61 | -5% $35 | +0% $10 | +5% $-16 | +10% $-41 |
|---|---|---|---|---|---|
| Rent | -10% $-95 | -5% $-42 | +0% $10 | +5% $62 | +10% $114 |
| Rate | -1.0pp $55 | -0.5pp $33 | base $10 | +0.5pp $-14 | +1.0pp $-37 |
UW: 25.0% down · 7.5% · 30yr · 1.5% tax · 5.0% vac · 8.0% maint · 8.0% mgmt
Financing live
Cash to close
- Down payment
- $22,500
- Closing costs
- $2,700
- Reserves months
- —
- Total cash needed
- —
Loan-product check · same deal, 3 products live
Conventional
25% down · 7.5% · 30yr
- Down + closing
- —
- Monthly P&I
- —
- Monthly cashflow
- —
- DSCR
- —
- Eligible?
- —
Personal DTI + credit; lowest rate.
DSCR
20% down · 8.5% · 30yr
- Down + closing
- —
- Monthly P&I
- —
- Monthly cashflow
- —
- DSCR
- —
- Eligible?
- —
No personal income docs; deal must DSCR.
Hard money
10% down · 12.0% · 12mo
- Down + closing
- —
- Monthly P&I
- —
- Monthly cashflow
- —
- DSCR
- —
- Eligible?
- —
Short-term bridge; refi at stabilization.
Listing history 18 events
-
2026-06-21days on market $90,000 Active 122 DOM
-
2026-06-21days on market $90,000 Active 121 DOM
-
2026-06-18days on market $90,000 Active 119 DOM
-
2026-06-17days on market $90,000 Active 118 DOM
-
2026-06-16days on market $90,000 Active 117 DOM
-
2026-06-15days on market $90,000 Active 116 DOM
-
2026-06-13days on market $90,000 Active 114 DOM
-
2026-06-12days on market $90,000 Active 113 DOM
-
2026-06-09days on market $90,000 Active 110 DOM
-
2026-06-08days on market $90,000 Active 109 DOM
-
2026-06-07days on market $90,000 Active 108 DOM
-
2026-06-07days on market $90,000 Active 107 DOM
-
2026-06-04days on market $90,000 Active 104 DOM
-
2026-06-02days on market $90,000 Active 103 DOM
-
2026-06-01days on market $90,000 Active 102 DOM
-
2026-05-31days on market $90,000 Active 101 DOM
-
2026-05-31days on market $90,000 Active 100 DOM
-
2026-02-18$90,000 Active 485-char remark
Show marketing remark (485 chars)
Opportunity awaits! This 3 bedroom, 2 bathroom home offers generous square footage and tons of potential for the right buyer. With a spacious layout and solid footprint, this property would make an excellent rental investment or a great option for someone looking to fully renovate and customize before moving in.Located outside city limits and less than one mile from Bayou Bend, you'll enjoy added flexibility with a convenient location. Bring your vision and make this one your own!
ⓘ Source: listings_history table (triggers on properties + properties_extension) + one-shot
backfill from property_details.listing_events for pre-trigger history.
Tax reassessment forecast LA · Resets to sale price
- Current annual tax
- $1,162 · $97/mo
- Projected year-2 tax
- $1,162 · $97/mo
- Expected delta
- $0/yr ($0/mo · 0.0%)
ⓘ Screening estimate from a state-policy table — verify with the county assessor before closing.
Climate risk First Street
- Flood 5/10 Major FEMA zone AE · 23% chance over 30 yrs
- Wildfire 1/10 Low
- Heat 9/10 Extreme 7 d/yr ≥105°F today · 23 d/yr by 30 yrs out
- Wind 9/10 Extreme 99% chance of damaging wind over 30 yrs
- Air quality 1/10 Low 0 unhealthy d/yr today · 0 by 30 yrs out
Nearby sold comps map
Loading sold comps map…
Walkable amenities ~0.75 mi
Loading nearby amenities…
Taxation est. · year 1
- Rental income
- $15,836
- − Mortgage interest
- −$5,041
- − Property taxes
- −$1,162
- − Insurance
- −$5,568
- − Repairs & maintenance
- −$1,267
- − Management
- −$1,267
- − Depreciation
- −$2,618
- Taxable loss
- −$1,088
- Est. tax savings @ 24.0%
- +$261
- After-tax cash flow
- $377/yr
For passive investors: Depreciation is non-cash, so a rental often shows a tax loss while cash-flowing — sheltering income. Rental losses are passive: they offset passive income freely, and up to $25,000/yr can offset ordinary (W-2) income if you actively participate and your MAGI is under $100k (phasing out to $0 by $150k); unused losses carry forward. On sale, claimed depreciation is recaptured at up to 25%, and gains may owe capital-gains tax (a 1031 exchange can defer both). Figures are a year-1 estimate at your 24.0% rate — not tax advice; consult a CPA.
Schools (NCES district)
- District
- St. Mary Parish
- NCES district ID
- 2201620
- Math proficiency
- 28% ▼ -40.00%
- Reading proficiency
- 39% ▼ -33.00%
- Median HH income
- $39,843
- Composite
- 28.1/100
- National rank
- #6828
- State rank
- #37 of 98 in LA
Livability — Franklin
- Score
- 67/100
- State rank
- #107
- US rank
- #10368
Category grades
Schools grade is shown separately in the Schools card above.
Census & demographics
- Population (ZIP)
- 12,561
Population outlook (St. Mary County) Hauer SSP2
- Today (2025)
- 49,510 people
- By 2030
- 47,570 · -3.9%
- By 2040
- 43,880 · -11.4%
- By 2050
- 40,655 · -17.9%
- By 2075
- 37,190 · -24.9%
- By 2100
- 38,101 · -23.0%
Race, ethnicity, and origin ACS 2023
- Neighborhood character
- Diverse neighborhood (Simpson 0.60)
- Race & ethnicity
- White 48% Black 41% Two or more races 7% Hispanic / Latino 5% Native American 2%
- Hispanic origin (detail)
- Mexican 2%
- Common ancestry
- Lithuanian 8% Italian 1%
- Foreign-born
- 1% · Canada, Vietnam
- Languages at home
- 95% English-only · Spanish 4% French/Haitian/Cajun 1% Vietnamese 1%
Political lean MEDSL · St. Mary
- 2024 margin
- Solid R (+31.9) · D 33.5% · R 65.4% · Other 1.0%
- 2008→2024 swing
- -15.1pp toward R · 2008: -16.8pp · 2024: -31.9pp
- All cycles
- 2024: R+31.9 2020: R+29.1 2016: R+27.6 2012: R+18.8 2008: R+16.8
Not yet ingested
- Civics
- —
Market trends
- HPI YoY
- ▲ 2.56%
- Current HPI
- 82.9321
- Rent YoY
- —
- Metro
- —
- State GDP YoY
- ▲ 3.29%
- F500 in state
- 10
Industry mix (Fortune 500 HQ in LA)
| Industry | F500 HQs | Revenue |
|---|---|---|
| Telecommunications | 2 | $23B |
|
||
| Utilities | 1 | $12B |
|
||
| Wholesale / Distribution | 1 | $5B |
|
||
| Advertising | 1 | $2B |
|
||
Price history
1 event — show timeline
- 2026-02-18 Listed $90,000 AcadianaMLS
Property tax history
+1.3%/yrLatest (2025): $1,162 · +0.0% YoY. Source: county tax records.
Cash-flow waterfall
monthlySold comps — $/sqft
last 12 mo · ≤1 miLoading sold comps…