6034 University Ave · Kochville, MI
Flood risk 4/10 · Minor
- FEMA flood zone
- X (shaded)
- Chance of flooding over 30 yrs
- 0.22%
- Est. flood insurance / yr
- $473 – $860
Fire risk 1/10 · Minimal
- Est. fire insurance / yr
- $784 – $1,456
Heat risk 2/10 · Minimal
- Hot days now (above 98°F)
- 7 days/yr
- Hot days in 30 yrs
- 14 days/yr
Wind risk 1/10 · Minimal
- Chance of severe wind over 30 yrs
- —
Air-quality risk 2/10 · Minimal
- Unhealthy air days now
- 1 days/yr
- Unhealthy air days in 30 yrs
- 1 days/yr
Risk factors via First Street. Map © Google.
Why this score? — see what drove the B- grade
The composite is a weighted blend of 9 inputs, each scored 0–100. Each bar is that input's sub-score; the figure is the points it added to the 100-point composite (weight × sub-score).
- Cash flow +30.0/30.0
- 1% rule +10.0/10.0
- DSCR +10.0/10.0
- ARV discount +7.5/15.0
- Condition / age +4.0/5.0
- Rent growth +2.5/5.0
- Livability +2.5/5.0
- Schools +2.0/10.0
- Appreciation +0.0/10.0
$76,999
🖨 Deal sheet (PDF) 📄 Offer letter ✓ Due diligence
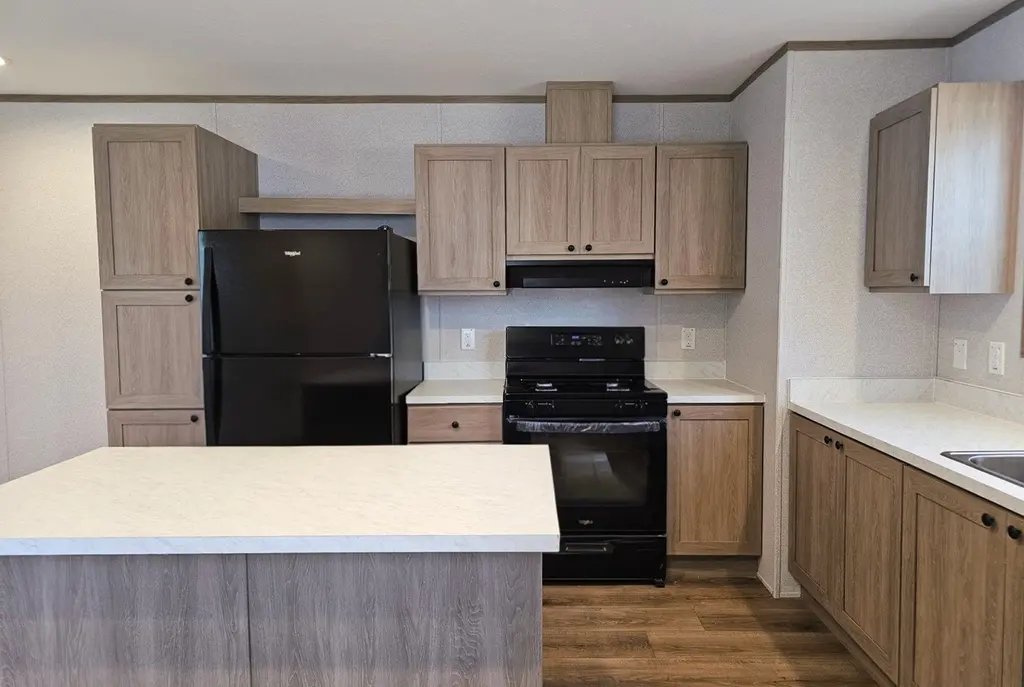
Listing remarks
Introducing this pristine home with 3 bedrooms and 2 bathrooms that harmoniously combines comfort, affordability, and contemporary living. You'll appreciate the spacious open floor plan, brand-new appliances, and the added benefit of access to community amenities. Don't let this opportunity slip away to claim this enchanting and affordable residence as your own. Contact us to arrange a viewing today! * All photos and renderings shown are for illustration purposes only. Actual home may vary.
Key facts
- Picnic area
- Clubhouse
- Regular events
Tags
Property features AI
Finance
- Financial info: Asking price $76,999
Exterior
- Home design: Single-family property; Listed as active
- Exterior features: Living area approximately 1,056
Interior
- Bedrooms: 3 bedrooms
- Bathrooms: 2 full bathrooms
- Interior features: Spec home (Saginaw Valley plan)
Neighborhood map
What this means for you Summary
Snapshot
- This is a 3-bed/2.0-bath manufactured listed at $77k. Condition is rated good.
Deal economics
- At list price, monthly cash flow is $399 ($5k/yr) — positive.
- The deal already cash-flows at list — no discount required.
- Meets the 1% rule at list price ($1k rent vs $77k).
- Recommended offer: $76k (1.5% below list) — sets the bar for market timing.
Location & tenants
- Location reads: area grade B — affects rentability + tenant quality, not the cash-flow math above.
- Saginaw School District (urban): math 20% / reading 29% proficiency, ranked #444 of 540 in MI (top 82%) — low school quality limits family demand, transient renter base, plan for 1-2y turnover; 76% free/reduced lunch — lower-income household profile, screen leases tightly.
- Zoned schools: Thompson Middle School (math 6% / reading 13%, grade F, #479 of 493 statewide, top 97%, 397 students, 93% FRL) — zoned schools average 93% FRL vs 76% district-wide (17 pts higher); higher-poverty schools than district average — tighter screening recommended.
- Zoned-school proficiency averages 10% at this address vs 24% district-wide (-15 pts) — the specific schools serving this property underperform the Saginaw School District average; the district grade overstates school quality for this exact location.
- Market conditions: 71 active listings in the ZIP; 1 comparable units currently listed for rent nearby; 154 units permitted in Saginaw County in 2024 (0 in 5+ unit buildings).
Forward outlook
- Local home prices are declining (-3.0%/yr); year-one equity from $532 of loan paydown is wiped out by about $2k of value loss. Plan a longer hold.
- Saginaw County population projected at -25% by 2050 — secular population decline; favor cash flow + early exit over multi-decade hold.
- At projected returns (-3.0% appreciation + 3.0% rent growth), your $22k cash investment doubles in ~6 years — after that, you're playing with house money.
Negotiation context
- It's been on market 21 days — a 2% lower offer ($76k) is reasonable based on typical stale-listing flexibility.
Questions for the listing agent
- Is there a deadline driving the sale (1031 exchange, divorce, estate, relocation)? That informs how much negotiation room exists.
- What's the average days-on-market for RENTAL listings here right now (not sales)? A rising rental-DOM trend means longer vacancies and softer asking-rent achievability than the comps imply.
- What's the recent tenant-quality profile in this submarket — average credit score on applications, eviction rate, late-payment / NSF rate, and stable-employment percentage? A property-management company in the area should have these aggregated.
- How much new for-sale + rental construction is in the pipeline within 1–3 miles? Heavy new supply typically softens prices + rents 12–24 months out; constrained supply supports both.
Investment metrics
- 1% rule
- 1.53% ✓
- Cap rate
- 12.52%
- Cash-on-cash
- 22.22%
- DSCR
- 1.99
- GRM
- 5.4
CMA / ARV
No comps found within radius.
Projected returns pro-forma
-3.0% appreciation · 3.0% rent growth · sell at horizon
- IRR
- 15.0%
- Equity multiple
- 1.60×
- Total profit
- $12,971
- Equity at exit
- $11,481
- IRR
- 23.7%
- Equity multiple
- 3.05×
- Total profit
- $44,114
- Equity at exit
- $6,657
Cash invested: $21,560 (down + closing). Projections, not guarantees.
Landlord ↔ Tenant lean methodology
- Overall (STATE)
- 62 Landlord-Friendly
- State Michigan
- 62 Landlord-Friendly · EVEN
- County
- — inherits STATE
- City
- — inherits STATE
ZIP-level market 48604
- Home prices YoY
- -24.6%
- Active inventory
- 71
- Price-to-rent
- 5.4×
Monthly cashflow live
- Estimated rent
- $1,179 medium interval (Pro) →
- Mortgage (P&I)
- −$404
- Tax est. 1.5%
- −$96 /mo · $1,155/yr
- Insurance
- −$32
- HOA
- −$0
- Vacancy / Maint / Mgmt
- −$248
- Net cashflow
- $399
Break-even live
Sensitivity live
| Price | -10% $452 | -5% $426 | +0% $399 | +5% $373 | +10% $346 |
|---|---|---|---|---|---|
| Rent | -10% $306 | -5% $353 | +0% $399 | +5% $446 | +10% $492 |
| Rate | -1.0pp $438 | -0.5pp $419 | base $399 | +0.5pp $379 | +1.0pp $359 |
UW: 25.0% down · 7.5% · 30yr · 1.5% tax · 5.0% vac · 8.0% maint · 8.0% mgmt
Financing live
Cash to close
- Down payment
- $19,250
- Closing costs
- $2,310
- Reserves months
- —
- Total cash needed
- —
Loan-product check · same deal, 3 products live
Conventional
25% down · 7.5% · 30yr
- Down + closing
- —
- Monthly P&I
- —
- Monthly cashflow
- —
- DSCR
- —
- Eligible?
- —
Personal DTI + credit; lowest rate.
DSCR
20% down · 8.5% · 30yr
- Down + closing
- —
- Monthly P&I
- —
- Monthly cashflow
- —
- DSCR
- —
- Eligible?
- —
No personal income docs; deal must DSCR.
Hard money
10% down · 12.0% · 12mo
- Down + closing
- —
- Monthly P&I
- —
- Monthly cashflow
- —
- DSCR
- —
- Eligible?
- —
Short-term bridge; refi at stabilization.
Rent comps 1 comps
| Address | Beds | Baths | Sqft | Rent | $/sqft | DOM | Units | Dist |
|---|---|---|---|---|---|---|---|---|
| 1870 Kochville Rd Saginaw, MI | 2.0–3.0 | 2.0 | 1024 | $1,179 | $1.15 | 45d | 1 | 0.06mi |
Listing history 4 events
-
2026-06-02days on market $76,999 Active 21 DOM
-
2026-06-01days on market $76,999 Active 20 DOM
-
2026-05-31days on market $76,999 Active 19 DOM
-
2026-05-30days on market $76,999 Active 18 DOM
ⓘ Source: listings_history table (triggers on properties + properties_extension) + one-shot
backfill from property_details.listing_events for pre-trigger history.
Climate risk First Street
- Flood 4/10 Moderate FEMA zone X (shaded) · 22% chance over 30 yrs
- Wildfire 1/10 Low
- Heat 2/10 Low 7 d/yr ≥98°F today · 14 d/yr by 30 yrs out
- Wind 1/10 Low
- Air quality 2/10 Low 1 unhealthy d/yr today · 1 by 30 yrs out
Nearby sold comps map
Loading sold comps map…
Walkable amenities ~0.75 mi
Loading nearby amenities…
Taxation est. · year 1
- Rental income
- $14,148
- − Mortgage interest
- −$4,313
- − Property taxes
- −$1,155
- − Insurance
- −$385
- − Repairs & maintenance
- −$1,132
- − Management
- −$1,132
- − Depreciation
- −$2,240
- Taxable income
- $3,791
- Est. tax owed @ 24.0%
- −$910
- After-tax cash flow
- $3,882/yr
For passive investors: Depreciation is non-cash, so a rental often shows a tax loss while cash-flowing — sheltering income. Rental losses are passive: they offset passive income freely, and up to $25,000/yr can offset ordinary (W-2) income if you actively participate and your MAGI is under $100k (phasing out to $0 by $150k); unused losses carry forward. On sale, claimed depreciation is recaptured at up to 25%, and gains may owe capital-gains tax (a 1031 exchange can defer both). Figures are a year-1 estimate at your 24.0% rate — not tax advice; consult a CPA.
Condition & rehab AI · 7 photos
This well-maintained, move-in-ready manufactured home features updated appliances, new flooring, and neutral paint, making it an attractive option for both buyers and renters.
Value-add opportunities
- Both Painting the exterior and adding landscaping — Enhances curb appeal and adds value.
- Resale Upgrading the appliances — Modern appliances attract more buyers.
- Both Adding a smart home system — Improves convenience and energy efficiency, attracting buyers and renters alike.
Renovation cost estimate screening
Value-add ROI direction
- Both Painting the exterior and adding landscaping — Enhances curb appeal and adds value. ↑
- Resale Upgrading the appliances — Modern appliances attract more buyers. ↑
- Both Adding a smart home system — Improves convenience and energy efficiency, attracting buyers and renters alike. ↑
ⓘ Cost ranges are severity-bucket heuristics (US national rule-of-thumb). Get contractor quotes + a written scope before underwriting a rehab budget.
Schools (NCES district)
- District
- Saginaw School District
- NCES district ID
- 2630390
- Math proficiency
- 20% ▼ -5.00%
- Reading proficiency
- 29% ▼ -3.00%
- Median HH income
- $28,940
- Composite
- 19.6/100
- National rank
- #8755
- State rank
- #444 of 540 in MI
Livability — Kochville
No livability data for this city. (Only ~50 U.S. cities are tracked.)
Census & demographics
- Population (ZIP)
- 11,284
Population outlook (Saginaw County) Hauer SSP2
- Today (2025)
- 180,568 people
- By 2030
- 172,302 · -4.6%
- By 2040
- 153,919 · -14.8%
- By 2050
- 135,519 · -24.9%
- By 2075
- 97,199 · -46.2%
- By 2100
- 65,037 · -64.0%
Race, ethnicity, and origin ACS 2023
- Neighborhood character
- Predominantly White (78%)
- Race & ethnicity
- White 78% Black 9% Hispanic / Latino 8% Two or more races 5% Asian 1%
- Hispanic origin (detail)
- Mexican 7%
- Common ancestry
- Romanian 10% Lithuanian 6% Italian 2%
- Foreign-born
- 2% · Canada
- Languages at home
- 95% English-only · Spanish 3% Other Indo-European 1% Arabic 1%
Political lean MEDSL · Saginaw
- 2024 margin
- Toss-up / Even · D 47.7% · R 51.0% · Other 1.4%
- 2008→2024 swing
- -20.6pp toward R · 2008: 17.3pp · 2024: -3.3pp
- All cycles
- 2024: R+3.3 2020: D+0.3 2016: R+1.1 2012: D+11.9 2008: D+17.3
Not yet ingested
- Civics
- —
Market trends
- HPI YoY
- ▼ -68.55%
- Current HPI
- 210.5278
- Rent YoY
- —
- Metro
- —
- State GDP YoY
- ▲ 1.37%
- F500 in state
- 28
Industry mix (Fortune 500 HQ in MI)
| Industry | F500 HQs | Revenue |
|---|---|---|
| Automotive Parts | 3 | $48B |
|
||
| Automotive | 2 | $372B |
|
||
| Chemicals | 1 | $45B |
|
||
| Automotive Retail | 1 | $29B |
|
||
| Healthcare / Medical Devices | 1 | $23B |
|
||
| Automotive Technology | 1 | $20B |
|
||
Cash-flow waterfall
monthlySold comps — $/sqft
last 12 mo · ≤1 miLoading sold comps…