 Multi-family
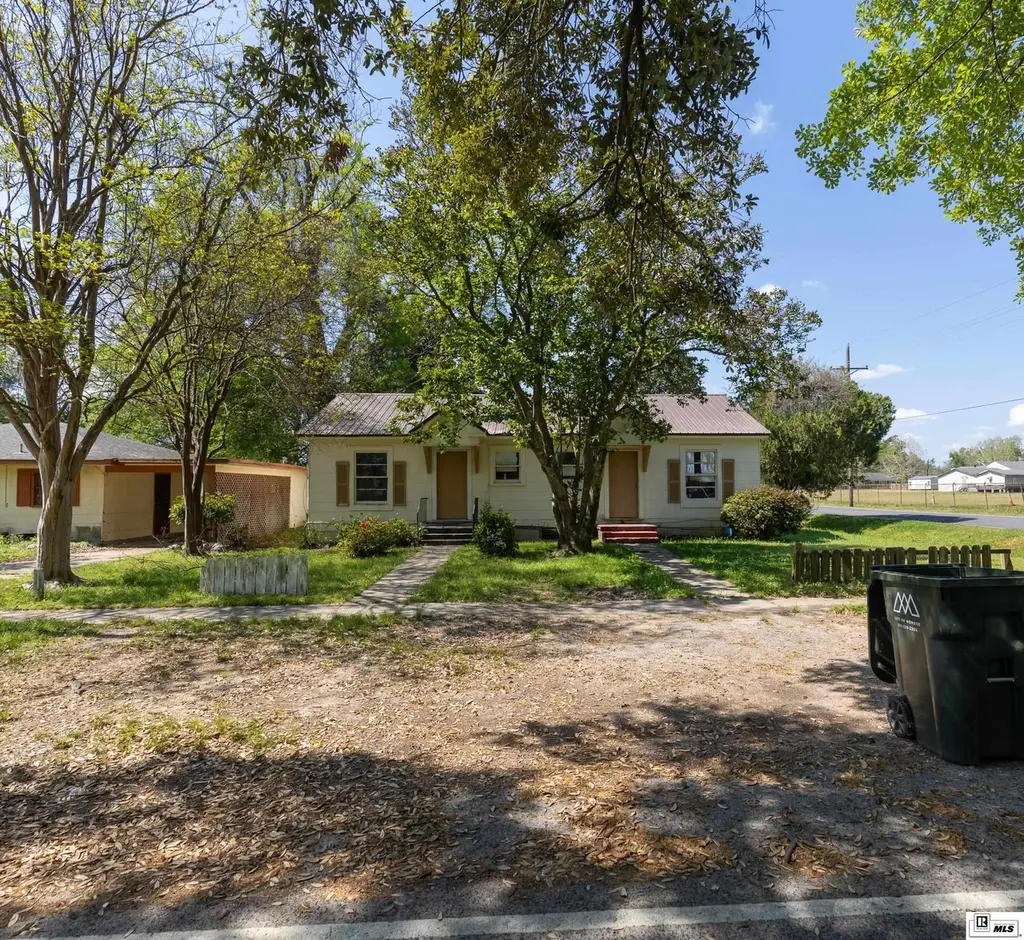
1000 S First St · Monroe, LA
Flood risk No data
- FEMA flood zone
- —
- Chance of flooding over 30 yrs
- —
- Est. flood insurance / yr
- —
Fire risk No data
- Est. fire insurance / yr
- —
Heat risk No data
- Hot days now (above threshold)
- —
- Hot days in 30 yrs
- —
Wind risk No data
- Chance of severe wind over 30 yrs
- —
Air-quality risk No data
- Unhealthy air days now
- —
- Unhealthy air days in 30 yrs
- —
Risk factors via First Street. Map © Google.
Why this score? — see what drove the B- grade
The composite is a weighted blend of 9 inputs, each scored 0–100. Each bar is that input's sub-score; the figure is the points it added to the 100-point composite (weight × sub-score).
- Cash flow +30.0/30.0
- 1% rule +10.0/10.0
- DSCR +10.0/10.0
- ARV discount +7.5/15.0
- Livability +3.3/5.0
- Rent growth +2.5/5.0
- Schools +2.1/10.0
- Condition / age +1.0/5.0
- Appreciation +0.0/10.0
$75,000
🖨 Deal sheet 📄 Offer letter ✓ Due diligence
Multi-family units
County records classify this as Multi-Family (2-4 Unit). Listing-text estimate: 1 unit. estimate disagrees with records
Listing remarks
Great investment opportunity! This residential income property offers strong rental potential and consistent cash flow. Well-maintained and ideally suited for both seasoned investors and those looking to expand their portfolio. Property is being sold as part of a package deal—please inquire for full details on included properties.
Key facts
- 8,276 sq ft lot
- Built 1947
- Listed 34 days
Property features AI
Exterior
- Parking: Gravel parking; Paved road access
- Utilities: Public water; Public sewer
- Home design: Residential income property; Duplex
- Construction: Asbestos siding or exterior material
- Exterior features: Metal roof; No patio or porch
Interior
- Kitchen: Electric water heater
- Heating & cooling: Central air conditioning; Other heating
- Interior features: Other interior features
- Laundry & utility: In-unit laundry
Neighborhood map
What this means for you Summary
Snapshot
- This is a multifamily listed at $75k. Condition is rated poor.
Deal economics
- At list price, monthly cash flow is $491 ($6k/yr) — positive.
- The deal already cash-flows at list — no discount required.
- Meets the 1% rule at list price ($1k rent vs $75k).
- Recommended offer: $73k (3.0% below list) — sets the bar for market timing.
- Cap rate 14.2% vs local median 5.7% in Monroe — top-decile yield for the area; either an underpriced asset or a hidden risk that comps aren't pricing in. Stress-test before assuming the spread holds.
Location & tenants
- Location reads 66/100 on livability (#128 in LA) — a middle-class / working-renter tenant base. Strengths: cost of living A+, health & safety A+; Watch: crime F, amenities F, commute F.
- City Of Monroe School District (urban): math 21% / reading 31% proficiency, ranked #60 of 98 in LA (top 61%) — low school quality limits family demand, transient renter base, plan for 1-2y turnover; 82% free/reduced lunch — lower-income household profile, screen leases tightly.
- Zoned schools: Martin Luther King Junior High School (math 13% / reading 20%, grade F, #177 of 218 statewide, top 82%, 353 students, 86% FRL) — zoned schools at 86% FRL track the district average.
- Market conditions: 69 active listings in the ZIP; 7 comparable units currently listed for rent nearby; rentals at typical pace (median 21d on market — plan ~3-4 weeks tenant-placement turnaround); 345 units permitted in Ouachita Parish in 2024 (0 in 5+ unit buildings).
Forward outlook
- Local home prices are declining (-3.0%/yr); year-one equity from $519 of loan paydown is wiped out by about $2k of value loss. Plan a longer hold.
- At projected returns (-3.0% appreciation + 3.0% rent growth), your $21k cash investment doubles in ~5 years — after that, you're playing with house money.
Negotiation context
- It's been on market 34 days — a 3% lower offer ($73k) is reasonable based on typical stale-listing flexibility.
Risks & watch-outs
- Watch-outs: built in 1947 — expect roof / HVAC / electrical / plumbing capex.
Questions for the listing agent
- It's been on market 34 days. Have you received any prior offers? Is the seller open to a 3% concession, seller financing, or rate buy-down credit?
- Have any recent inspections been done? Can we get a copy of the seller's disclosures and any deferred-maintenance estimates?
- Built in 1947 — when were the roof, HVAC, electrical panel, plumbing, and water heater last replaced?
- Is there a deadline driving the sale (1031 exchange, divorce, estate, relocation)? That informs how much negotiation room exists.
- Crime grade is F in this area — have there been break-ins, vandalism, or insurance claims at this property in the last 3 years? What carrier currently insures it and at what premium?
- What's the average days-on-market for RENTAL listings here right now (not sales)? A rising rental-DOM trend means longer vacancies and softer asking-rent achievability than the comps imply.
- What's the recent tenant-quality profile in this submarket — average credit score on applications, eviction rate, late-payment / NSF rate, and stable-employment percentage? A property-management company in the area should have these aggregated.
- How much new apartment / multifamily construction is in the pipeline within 1–3 miles? Heavy new supply (>2% of stock underway) typically softens rents 12–24 months out; light construction supports rent growth.
Investment metrics
- 1% rule
- 1.70% ✓
- Cap rate
- 14.15%
- Cash-on-cash
- 28.07%
- DSCR
- 2.25
- GRM
- 4.9
CMA / ARV
No comps found within radius.
Projected returns pro-forma
-3.0% appreciation · 3.0% rent growth · sell at horizon
- IRR
- 22.3%
- Equity multiple
- 1.91×
- Total profit
- $19,158
- Equity at exit
- $11,183
- IRR
- 30.3%
- Equity multiple
- 3.72×
- Total profit
- $57,054
- Equity at exit
- $6,485
Cash invested: $21,000 (down + closing). Projections, not guarantees.
Landlord ↔ Tenant lean methodology
- Overall (STATE)
- 90 Strongly Landlord-Friendly
- State Louisiana
- 90 Strongly Landlord-Friendly · R+12
- County
- — inherits STATE
- City
- — inherits STATE
ZIP-level market 71202
- Active inventory
- 69
- Price-to-rent
- 9.8×
Monthly cashflow live
- Estimated rent
- $1,278 high interval (Pro) →
- Mortgage (P&I)
- −$393
- Tax est. 1.5%
- −$94 /mo · $1,125/yr
- Insurance
- −$31
- HOA
- −$0
- Vacancy / Maint / Mgmt
- −$268
- Net cashflow
- $491
Break-even live
2-unit breakdown (identical units grouped — click to expand)
| Units | Beds | Baths | Est. rent |
|---|---|---|---|
| 2× units | 2 | 1.5 | $1,278 |
| #1 | 2 | 1.5 | $639 |
| #2 | 2 | 1.5 | $639 |
| Total (2 units) | $1,278 | ||
UW: 25.0% down · 7.5% · 30yr · 1.5% tax · 5.0% vac · 8.0% maint · 8.0% mgmt
Financing live
Cash to close
- Down payment
- $18,750
- Closing costs
- $2,250
- Reserves months
- —
- Total cash needed
- —
Loan-product check · same deal, 3 products live
Conventional
25% down · 7.5% · 30yr
- Down + closing
- —
- Monthly P&I
- —
- Monthly cashflow
- —
- DSCR
- —
- Eligible?
- —
Personal DTI + credit; lowest rate.
DSCR
20% down · 8.5% · 30yr
- Down + closing
- —
- Monthly P&I
- —
- Monthly cashflow
- —
- DSCR
- —
- Eligible?
- —
No personal income docs; deal must DSCR.
Hard money
10% down · 12.0% · 12mo
- Down + closing
- —
- Monthly P&I
- —
- Monthly cashflow
- —
- DSCR
- —
- Eligible?
- —
Short-term bridge; refi at stabilization.
Rent comps 7 comps
| Address | Beds | Baths | Sqft | Rent | $/sqft | DOM | Units | Dist |
|---|---|---|---|---|---|---|---|---|
| 1006 S 2nd St Monroe, LA | 3.0 | 1.0 | 1200 | $625 | $0.52 | 21d | 1 | 0.07mi |
| 1010 S 3rd St Monroe, LA | 2.0 | 1.0 | — | $500 | — | 21d | 1 | 0.14mi |
| 107 Riverbend Dr West Monroe, LA | 2.0 | 1.0 | 896 | $800 | $0.89 | 21d | 1 | 0.67mi |
| 411 Filhiol Ave West Monroe, LA | 2.0 | 1.0 | 782 | $875 | $1.12 | 21d | 1 | 1.07mi |
| 2807 Georgia St Monroe, LA | 3.0 | 1.0 | — | $725 | — | 21d | 1 | 1.11mi |
| 212 Ludwig Ave West Monroe, LA | 3.0 | 2.0 | 2600 | $1,350 | $0.52 | 21d | 1 | 1.15mi |
| 110 Pine St Unit 12 West Monroe, LA | 2.0 | 2.0 | 1000 | $2,400 | $2.40 | 43d | 1 | 1.46mi |
Listing history 2 events
-
2026-05-06status Pending
-
2026-04-02$75,000 Active
ⓘ Source: listings_history table (triggers on properties + properties_extension) + one-shot
backfill from property_details.listing_events for pre-trigger history.
Nearby sold comps map
Loading sold comps map…
Walkable amenities ~0.75 mi
Loading nearby amenities…
Taxation est. · year 1
- Rental income
- $15,336
- − Mortgage interest
- −$4,201
- − Property taxes
- −$1,125
- − Insurance
- −$375
- − Repairs & maintenance
- −$1,227
- − Management
- −$1,227
- − Depreciation
- −$2,182
- Taxable income
- $4,999
- Est. tax owed @ 24.0%
- −$1,200
- After-tax cash flow
- $4,696/yr
For passive investors: Depreciation is non-cash, so a rental often shows a tax loss while cash-flowing — sheltering income. Rental losses are passive: they offset passive income freely, and up to $25,000/yr can offset ordinary (W-2) income if you actively participate and your MAGI is under $100k (phasing out to $0 by $150k); unused losses carry forward. On sale, claimed depreciation is recaptured at up to 25%, and gains may owe capital-gains tax (a 1031 exchange can defer both). Figures are a year-1 estimate at your 24.0% rate — not tax advice; consult a CPA.
Condition & rehab AI · 3 photos
This multi-family property requires extensive repairs and maintenance, including roof replacement and landscaping improvements, to become move-in ready and increase its value.
Repairs flagged
- Major roof — Significant damage and missing shingles are visible.
- Major exterior walls — Overgrown vegetation and debris indicate neglect.
- Major fencing — The fencing appears to be in poor condition.
Value-add opportunities
- Both Landscaping and debris removal — Improving the landscaping and removing debris will enhance the property's curb appeal and make it more attractive for both resale and rental.
- Both Roof repair — Repairing the roof is crucial for the property's structural integrity and will significantly increase its value.
Renovation cost estimate screening
| Repair item | Severity | Est. cost |
|---|---|---|
| roof · Significant damage and missing shingles are visible. | Major | $15,000–50,000 |
| exterior walls · Overgrown vegetation and debris indicate neglect. | Major | $15,000–50,000 |
| fencing · The fencing appears to be in poor condition. | Major | $15,000–50,000 |
| Total estimated repair cost · 3 items | $45,000–150,000 |
Value-add ROI direction
- Both Landscaping and debris removal — Improving the landscaping and removing debris will enhance the property's curb appeal and make it more attractive for both resale and rental. ↑
- Both Roof repair — Repairing the roof is crucial for the property's structural integrity and will significantly increase its value. ↑
ⓘ Cost ranges are severity-bucket heuristics (US national rule-of-thumb). Get contractor quotes + a written scope before underwriting a rehab budget.
Schools (NCES district)
- District
- City Of Monroe School District
- NCES district ID
- 2201080
- Math proficiency
- 21% ▼ -36.00%
- Reading proficiency
- 31% ▼ -34.00%
- Median HH income
- $28,751
- Composite
- 20.82/100
- National rank
- #8505
- State rank
- #60 of 98 in LA
Livability — Monroe
- Score
- 66/100
- State rank
- #128
- US rank
- #11948
Category grades
Schools grade is shown separately in the Schools card above.
Census & demographics
- Census place
- Monroe, LA
- City population
- 60,136
- Population (ZIP)
- 26,791
Population outlook (Ouachita County) Hauer SSP2
- Today (2025)
- 163,370 people
- By 2030
- 165,520 · +1.3%
- By 2040
- 167,652 · +2.6%
- By 2050
- 166,699 · +2.0%
- By 2075
- 156,348 · -4.3%
- By 2100
- 134,102 · -17.9%
Race, ethnicity, and origin ACS 2023
- Neighborhood character
- Predominantly Black (84%)
- Race & ethnicity
- Black 84% White 11% Hispanic / Latino 2% Two or more races 2%
- Common ancestry
- Lithuanian 1%
- Foreign-born
- 1% · Canada
- Languages at home
- 97% English-only · Spanish 2%
Political lean MEDSL · Ouachita
- 2024 margin
- Strong R (+27.9) · D 35.5% · R 63.3% · Other 1.2%
- 2008→2024 swing
- -2.7pp toward R · 2008: -25.2pp · 2024: -27.9pp
- All cycles
- 2024: R+27.9 2020: R+23.6 2016: R+25.4 2012: R+20.9 2008: R+25.2
Not yet ingested
- Civics
- —
Market trends
- HPI YoY
- ▼ -66.58%
- Current HPI
- 82.9973
- Rent YoY
- —
- Metro
- —
- State GDP YoY
- ▲ 3.29%
- F500 in state
- 10
Industry mix (Fortune 500 HQ in LA)
| Industry | F500 HQs | Revenue |
|---|---|---|
| Telecommunications | 2 | $23B |
|
||
| Utilities | 1 | $12B |
|
||
| Wholesale / Distribution | 1 | $5B |
|
||
| Advertising | 1 | $2B |
|
||
Price history
2 events — show timeline
- 2026-05-06 Pending — NELABOR
- 2026-04-02 Listed $75,000 NELABOR
Cash-flow waterfall
monthlySold comps — $/sqft
last 12 mo · ≤1 miLoading sold comps…