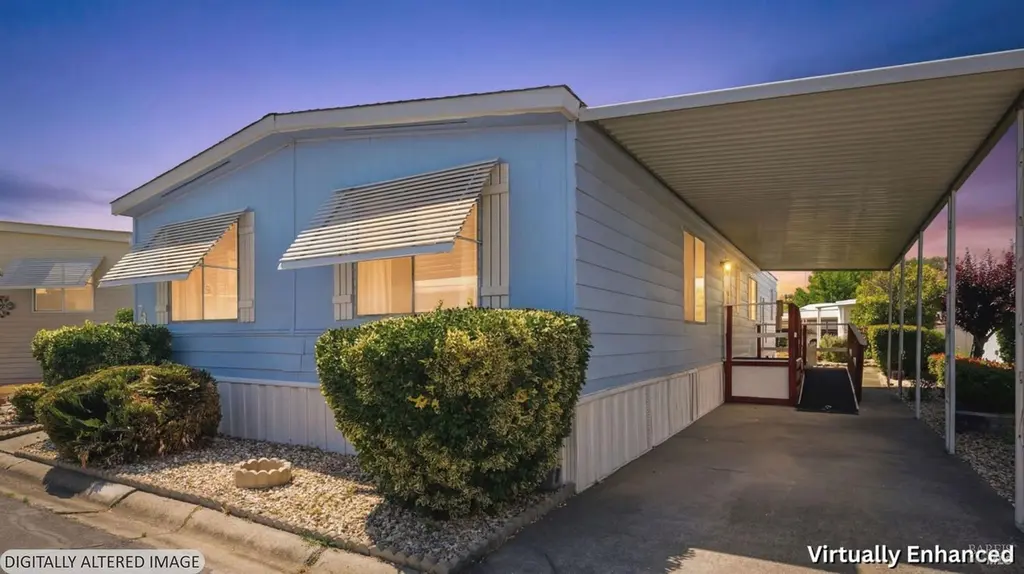
70 Lemon Tree Cir #78 · Vacaville, CA
Flood risk 1/10 · Minimal
- FEMA flood zone
- X (unshaded)
- Chance of flooding over 30 yrs
- 0.0%
- Est. flood insurance / yr
- $507 – $1,088
Fire risk 4/10 · Minor
- Est. fire insurance / yr
- $659 – $1,223
Heat risk 6/10 · Moderate
- Hot days now (above 101°F)
- 7 days/yr
- Hot days in 30 yrs
- 15 days/yr
Wind risk 1/10 · Minimal
- Chance of severe wind over 30 yrs
- —
Air-quality risk 10/10 · Severe
- Unhealthy air days now
- 24 days/yr
- Unhealthy air days in 30 yrs
- 24 days/yr
Risk factors via First Street. Map © Google.
Why this score? — see what drove the B+ grade
The composite is a weighted blend of 9 inputs, each scored 0–100. Each bar is that input's sub-score; the figure is the points it added to the 100-point composite (weight × sub-score).
- Cash flow +30.0/30.0
- ARV discount +15.0/15.0
- 1% rule +10.0/10.0
- DSCR +10.0/10.0
- Schools +4.2/10.0
- Livability +3.9/5.0
- Condition / age +2.8/5.0
- Rent growth +2.4/5.0
- Appreciation +0.0/10.0
$130,000
🖨 Deal sheet 📄 Offer letter ✓ Due diligence
Listing remarks
Welcome to Lemon Tree Mobile Home Park, a highly desirable 55+ senior community in Vacaville! This spacious 1,392 sq. ft. home features 2 bedrooms and 2 full bathrooms, offering a fantastic opportunity to bring your personal touches and updates to make it your own. As a resident of this welcoming community, you will enjoy wonderful on-site amenities including a sparkling swimming pool, BBQ area, and a friendly clubhouse. The location is truly unbeatable, situated just off Orange Drive with incredibly convenient access to premier shopping and dining at the Vacaville Premium Outlets, daily necessities at nearby Target and Walmart, and top-tier healthcare at the local Kaiser Permanente Hospita
Key facts
- Convenient access
- Bbq area
- Premier shopping
Tags
Property features AI
Finance
- Other: Located in Lemon Tree Mobile Home Park
- Financial info: Land lease (space rent) applies
- HOA & community: No homeowners association; Senior community
Exterior
- Parking: Covered parking; 2 total parking spaces; Guest parking available
- Utilities: Public sewer; Cable available; Internet available; 220 volts in laundry
- Home design: Manufactured in park (double wide); Faces southeast
- Construction: Composition roof; Aluminum skirting; Manufactured by Fleetwood
- Exterior features: Covered patio; Porch; Carpeted patio/porch area; Carport awning; Porch awning; Close to clubhouse; Located on a cul-de-sac
Interior
- Kitchen: Built-in gas oven; Gas cooktop; Range hood; Self-cleaning oven; Dishwasher; Microwave; Ice maker; Freestanding refrigerator; Breakfast area and island
- Bedrooms: 2 bedrooms
- Flooring: Carpet; Laminate
- Bathrooms: 2 full bathrooms with tub/shower over tub and shower stall(s)
- Heating & cooling: Central heating; Central air conditioning; Ceiling fans
- Interior features: Accessible approach with ramp; Great room; Dining and living room combined; Breakfast area, island and pantry in the kitchen; Utility room
- Laundry & utility: Washer and dryer included; Inside laundry area; Gas hook-up for laundry; 220-volt outlet in laundry
Neighborhood map
What this means for you Summary
Snapshot
- This is a 2-bed/2.0-bath manufactured listed at $130k. Condition is rated average.
Deal economics
- At list price, monthly cash flow is $1k ($14k/yr) — positive.
- The deal already cash-flows at list — no discount required.
- Meets the 1% rule at list price ($3k rent vs $130k).
- Recommended offer: $128k (1.5% below list) — sets the bar for market timing.
- Cap rate 17.0% vs local median 3.0% in Vacaville — top-decile yield for the area; either an underpriced asset or a hidden risk that comps aren't pricing in. Stress-test before assuming the spread holds.
Location & tenants
- Location reads 77/100 on livability (#88 in CA, #3,156 nationally) — a middle-class / working-renter tenant base. Strengths: amenities A+, employment A+, housing A+; Watch: schools C-, cost of living F.
- Vacaville Unified (suburban): math 37% / reading 52% proficiency, ranked #522 of 1,400 in CA (top 37%) — families likely to look elsewhere, expect single-tenant / working-renter base with shorter leases.
- Market conditions: Rents soft (-0.6%/yr); 263 active listings in the ZIP; 13 comparable units currently listed for rent nearby; rentals at typical pace (median 23d on market — plan ~3-4 weeks tenant-placement turnaround); 46% of comp listings sitting > 30 days — soft ceiling on asking rent; solid renter incomes; 1,472 units permitted in Solano County in 2024 (131 in 5+ unit buildings).
Forward outlook
- Local home prices are declining (-3.0%/yr); year-one equity from $899 of loan paydown is wiped out by about $4k of value loss. Plan a longer hold.
- Solano County population projected at +15% by 2050 — modest demand growth; plan on rents tracking national, not racing it.
- At projected returns (-3.0% appreciation + 0.0% rent growth), your $36k cash investment doubles in ~4 years — after that, you're playing with house money.
Negotiation context
- It's been on market 27 days — a 2% lower offer ($128k) is reasonable based on typical stale-listing flexibility.
Risks & watch-outs
- Climate carrying-cost: extreme-heat days projected 7→15/yr by 2055 (HVAC capex compounding) — expect insurance premiums to compound above CPI over the hold.
Questions for the listing agent
- Built in 1977 — when were the roof, HVAC, electrical panel, plumbing, and water heater last replaced?
- Is there a deadline driving the sale (1031 exchange, divorce, estate, relocation)? That informs how much negotiation room exists.
- What's the average days-on-market for RENTAL listings here right now (not sales)? A rising rental-DOM trend means longer vacancies and softer asking-rent achievability than the comps imply.
- What's the recent tenant-quality profile in this submarket — average credit score on applications, eviction rate, late-payment / NSF rate, and stable-employment percentage? A property-management company in the area should have these aggregated.
- How much new for-sale + rental construction is in the pipeline within 1–3 miles? Heavy new supply typically softens prices + rents 12–24 months out; constrained supply supports both.
Investment metrics
- 1% rule
- 2.01% ✓
- Cap rate
- 17.04%
- Cash-on-cash
- 38.40%
- DSCR
- 2.71
- GRM
- 4.1
CMA / ARV
- ARV (on-the-fly)
- $206,016
- Comps found
- 12
Show comp detail 12 sales within ~0.75 mi
| Address | Dist | Beds/Ba | Sqft | Sold | Price | $/sf | Match |
|---|---|---|---|---|---|---|---|
| 76 Lemon Tree Cir | 0.03mi | 2/2.0 | 1,440 (+3%) | 3mo | $130,000 | $90 | 91 |
| 199 Lemon Tree Cir | 0.05mi | 2/2.0 | 1,344 (-3%) | 4mo | $158,000 | $118 | 89 |
| 71 Lemon Tree Cir | 0.05mi | 2/2.0 | 1,344 (-3%) | 4mo | $140,000 | $104 | 88 |
| 182 Lemon Tree Cir | 0.11mi | 2/2.0 | 1,440 (+3%) | 6mo | $110,000 | $76 | 84 |
| 174 Lemon Tree Cir | 0.13mi | 2/2.0 | 1,344 (-3%) | 8mo | $199,000 | $148 | 81 |
| 173 Lemon Tree Cir | 0.16mi | 2/2.0 | 1,440 (+3%) | 9mo | $180,000 | $125 | 80 |
| 22 Lemon Tree Cir | 0.04mi | 2/2.0 | 1,440 (+3%) | 16mo | $239,000 | $166 | 79 |
| 137 Lemon Tree Cir | 0.17mi | 2/2.0 | 1,248 (-10%) | 4mo | $189,000 | $151 | 71 |
| 32 Lemon Tree Cir | 0.06mi | 2/2.0 | 1,188 (-15%) | 4mo | $185,000 | $156 | 69 |
| 176 Lemon Tree Cir | 0.11mi | 2/2.0 | 1,575 (+13%) | 7mo | $186,500 | $118 | 67 |
| 117 Lemon Tree Cir | 0.13mi | 3/2.0 (+1) | 1,300 (-7%) | 14mo | $219,000 | $168 | 66 |
| 187 Lemon Tree Cir | 0.06mi | 3/2.0 (+1) | 1,536 (+10%) | 13mo | $232,000 | $151 | 64 |
Match score weights: distance 35% · size 25% · config 20% · recency 20%. Top-matched comps best support the ARV.
Projected returns pro-forma
-3.0% appreciation · 0.0% rent growth · sell at horizon
- IRR
- 31.1%
- Equity multiple
- 2.25×
- Total profit
- $45,506
- Equity at exit
- $19,383
- IRR
- 36.5%
- Equity multiple
- 3.90×
- Total profit
- $105,734
- Equity at exit
- $11,240
Cash invested: $36,400 (down + closing). Projections, not guarantees.
Landlord ↔ Tenant lean methodology
- Overall (STATE)
- 18 Strongly Tenant-Friendly
- State California
- 18 Strongly Tenant-Friendly · D+13
- County
- — inherits STATE
- City
- — inherits STATE
ZIP-level market 95687
- Rents YoY
- -0.6%
- Active inventory
- 263
- Price-to-rent
- 4.1×
Monthly cashflow live
- Estimated rent
- $2,612 high interval (Pro) →
- Mortgage (P&I)
- −$682
- Tax est. 1.5%
- −$162 /mo · $1,950/yr
- Insurance
- −$54
- HOA
- −$0
- Vacancy / Maint / Mgmt
- −$548
- Net cashflow
- $1,165
Break-even live
UW: 25.0% down · 7.5% · 30yr · 1.5% tax · 5.0% vac · 8.0% maint · 8.0% mgmt
Financing live
Cash to close
- Down payment
- $32,500
- Closing costs
- $3,900
- Reserves months
- —
- Total cash needed
- —
Loan-product check · same deal, 3 products live
Conventional
25% down · 7.5% · 30yr
- Down + closing
- —
- Monthly P&I
- —
- Monthly cashflow
- —
- DSCR
- —
- Eligible?
- —
Personal DTI + credit; lowest rate.
DSCR
20% down · 8.5% · 30yr
- Down + closing
- —
- Monthly P&I
- —
- Monthly cashflow
- —
- DSCR
- —
- Eligible?
- —
No personal income docs; deal must DSCR.
Hard money
10% down · 12.0% · 12mo
- Down + closing
- —
- Monthly P&I
- —
- Monthly cashflow
- —
- DSCR
- —
- Eligible?
- —
Short-term bridge; refi at stabilization.
Rent comps 13 comps
| Address | Beds | Baths | Sqft | Rent | $/sqft | DOM | Units | Dist |
|---|---|---|---|---|---|---|---|---|
| 107 Lassen Cir Vacaville, CA | 2.0 | 2.0 | 1043 | $2,150 | $2.06 | 23d | 1 | 0.34mi |
| 188 Glacier Cir Vacaville, CA | 3.0 | 2.0 | 1372 | $2,750 | $2.00 | 13d | 1 | 0.47mi |
| 132 Bryce Way Vacaville, CA | 2.0 | 2.0 | 1292 | $2,350 | $1.82 | 44d | 1 | 0.55mi |
| 3500 Harbison Dr Vacaville, CA | 1.0–2.0 | 1.0–2.0 | 1038 | $2,768 | $2.67 | 13d | 11 | 0.97mi |
| 100 Summerfield Dr Vacaville, CA | 1.0–2.0 | 1.0–2.0 | 900 | $2,535 | $2.82 | 13d | 6 | 1.10mi |
| 784 Arabian Cir Vacaville, CA | 3.0 | 2.0 | 1804 | $3,300 | $1.83 | 43d | 1 | 1.16mi |
| 1187 Notre Dame Cir Vacaville, CA | 3.0 | 2.5 | 1807 | $3,100 | $1.72 | 43d | 1 | 1.22mi |
| 1200 Allison Dr Vacaville, CA | 3.0 | 1.0–2.0 | 964 | $2,866 | $2.97 | 13d | 15 | 1.27mi |
| 555 Elmira Rd Vacaville, CA | 1.0–2.0 | 1.0–2.0 | 822 | $2,325 | $2.83 | 13d | 1 | 1.30mi |
| 1000 Allison Dr Vacaville, CA | 1.0–2.0 | 1.0–2.0 | 990 | $3,100 | $3.13 | 13d | 15 | 1.40mi |
| 1407 Callen St Unit C Vacaville, CA | 2.0 | 1.5 | 950 | $2,000 | $2.11 | 43d | 1 | 1.46mi |
| 245 Christine Dr Vacaville, CA | 3.0 | 2.0 | 1533 | $3,400 | $2.22 | 43d | 1 | 1.47mi |
| 208 Richard Pl Vacaville, CA | 3.0 | 2.0 | 1512 | $3,250 | $2.15 | 43d | 1 | 1.50mi |
Listing history 17 events
-
2026-06-18days on market $130,000 Active 27 DOM
-
2026-06-17days on market $130,000 Active 26 DOM
-
2026-06-16days on market $130,000 Active 25 DOM
-
2026-06-15days on market $130,000 Active 24 DOM
-
2026-06-14days on market $130,000 Active 22 DOM
-
2026-06-13days on market $130,000 Active 21 DOM
-
2026-06-10days on market $130,000 Active 19 DOM
-
2026-06-09days on market $130,000 Active 18 DOM
-
2026-06-08days on market $130,000 Active 17 DOM
-
2026-06-07days on market $130,000 Active 16 DOM
-
2026-06-05days on market $130,000 Active 13 DOM
-
2026-06-03days on market $130,000 Active 12 DOM
-
2026-06-02days on market $130,000 Active 11 DOM
-
2026-06-01days on market $130,000 Active 10 DOM
-
2026-05-31days on market $130,000 Active 9 DOM
-
2026-05-30days on market $130,000 Active 8 DOM
-
2026-05-22$130,000 Active
ⓘ Source: listings_history table (triggers on properties + properties_extension) + one-shot
backfill from property_details.listing_events for pre-trigger history.
Climate risk First Street
- Flood 1/10 Low FEMA zone X (unshaded) · 0% chance over 30 yrs
- Wildfire 4/10 Moderate
- Heat 6/10 Major 7 d/yr ≥101°F today · 15 d/yr by 30 yrs out
- Wind 1/10 Low
- Air quality 10/10 Extreme 24 unhealthy d/yr today · 24 by 30 yrs out
Nearby sold comps map
Loading sold comps map…
Walkable amenities ~0.75 mi
Loading nearby amenities…
Taxation est. · year 1
- Rental income
- $31,340
- − Mortgage interest
- −$7,282
- − Property taxes
- −$1,950
- − Insurance
- −$650
- − Repairs & maintenance
- −$2,507
- − Management
- −$2,507
- − Depreciation
- −$3,782
- Taxable income
- $12,661
- Est. tax owed @ 24.0%
- −$3,039
- After-tax cash flow
- $10,939/yr
For passive investors: Depreciation is non-cash, so a rental often shows a tax loss while cash-flowing — sheltering income. Rental losses are passive: they offset passive income freely, and up to $25,000/yr can offset ordinary (W-2) income if you actively participate and your MAGI is under $100k (phasing out to $0 by $150k); unused losses carry forward. On sale, claimed depreciation is recaptured at up to 25%, and gains may owe capital-gains tax (a 1031 exchange can defer both). Figures are a year-1 estimate at your 24.0% rate — not tax advice; consult a CPA.
Condition & rehab AI · 3 photos
This mobile home in Lemon Tree Mobile Home Park is in average condition with some minor repairs needed. It offers a good opportunity for cosmetic updates and improvements to increase its value.
Repairs flagged
- Minor interior walls/paint — Some minor wear is visible on the interior walls and paint.
- Minor interior walls/paint — Some minor wear is visible on the interior walls and paint.
Value-add opportunities
- Both paint interior walls and trim — Fresh paint can enhance the home's appearance and appeal to potential buyers or renters.
- Both replace awnings — New awnings can improve the home's curb appeal and provide shade, enhancing both resale and rental value.
- Both update kitchen and bathrooms — Modernizing the kitchen and bathrooms can significantly increase the home's value and attract more buyers or renters.
- Both landscaping and curb appeal — A well-maintained and attractive exterior can boost both resale and rental value.
- Both HVAC system — A functional and energy-efficient HVAC system can improve comfort and reduce utility costs, enhancing both resale and rental value.
- Both roof inspection — Ensuring the roof is in good condition can prevent costly repairs and improve the home's overall value.
- Both foundation inspection — A stable foundation is crucial for the home's structural integrity and can impact both resale and rental value.
- Both landscaping and curb appeal — A well-maintained and attractive exterior can boost both resale and rental value.
Renovation cost estimate screening
| Repair item | Severity | Est. cost |
|---|---|---|
| interior walls/paint · Some minor wear is visible on the interior walls and paint. | Minor | $500–3,000 |
| interior walls/paint · Some minor wear is visible on the interior walls and paint. | Minor | $500–3,000 |
| Total estimated repair cost · 2 items | $1,000–6,000 |
Value-add ROI direction
- Both paint interior walls and trim — Fresh paint can enhance the home's appearance and appeal to potential buyers or renters. ↑
- Both replace awnings — New awnings can improve the home's curb appeal and provide shade, enhancing both resale and rental value. ↑
- Both update kitchen and bathrooms — Modernizing the kitchen and bathrooms can significantly increase the home's value and attract more buyers or renters. ↑
- Both landscaping and curb appeal — A well-maintained and attractive exterior can boost both resale and rental value. ↑
- Both HVAC system — A functional and energy-efficient HVAC system can improve comfort and reduce utility costs, enhancing both resale and rental value. ↑
- Both roof inspection — Ensuring the roof is in good condition can prevent costly repairs and improve the home's overall value. ↑
- Both foundation inspection — A stable foundation is crucial for the home's structural integrity and can impact both resale and rental value. ↑
- Both landscaping and curb appeal — A well-maintained and attractive exterior can boost both resale and rental value. ↑
ⓘ Cost ranges are severity-bucket heuristics (US national rule-of-thumb). Get contractor quotes + a written scope before underwriting a rehab budget.
Schools (NCES district)
- District
- Vacaville Unified
- NCES district ID
- 0640590
- Math proficiency
- 37% ▼ -1.00%
- Reading proficiency
- 52% ▲ 2.00%
- Median HH income
- $71,383
- Composite
- 42.48/100
- National rank
- #6877
- State rank
- #522 of 1400 in CA
Livability — Vacaville
- Score
- 77/100
- State rank
- #88
- US rank
- #3156
Category grades
Schools grade is shown separately in the Schools card above.
Census & demographics
- Census place
- Vacaville, CA
- County
- Solano County · 433,239 people
- City population
- 109,591
- Metro
- Vallejo, CA
- Population (ZIP)
- 69,390
- Household income
- $109,566
- Rent vs Own
- Severe rent burden
- 1761.0
Population outlook (Solano County) Hauer SSP2
- Today (2025)
- 478,685 people
- By 2030
- 497,974 · +4.0%
- By 2040
- 528,515 · +10.4%
- By 2050
- 549,115 · +14.7%
- By 2075
- 587,229 · +22.7%
- By 2100
- 571,378 · +19.4%
Race, ethnicity, and origin ACS 2023
- Neighborhood character
- Highly diverse neighborhood (Simpson 0.71)
- Race & ethnicity
- White 44% Hispanic / Latino 26% Two or more races 13% Black 10% Asian 10% Native American 1%
- Hispanic origin (detail)
- Mexican 18% Puerto Rican 2%
- Common ancestry
- Italian 13% Lithuanian 2% Portuguese 1%
- Foreign-born
- 12% · Canada, China
- Languages at home
- 80% English-only · Spanish 12% Tagalog/Filipino 3% Other Indo-European 2%
Political lean MEDSL · Solano
- 2024 margin
- Strong D (+23.0) · D 60.0% · R 37.1% · Other 2.9%
- 2008→2024 swing
- -5.6pp toward R · 2008: 28.6pp · 2024: 23.0pp
- All cycles
- 2024: D+23.0 2020: D+30.3 2016: D+30.5 2012: D+28.1 2008: D+28.6
Not yet ingested
- Civics
- —
Market trends
- HPI YoY
- ▼ -299.59%
- Current HPI
- 268.0777
- Rent YoY
- ▼ -0.55%
- Metro
- Vallejo, CA
- State GDP YoY
- ▲ 3.21%
- F500 in state
- 116
Industry mix (Fortune 500 HQ in CA)
| Industry | F500 HQs | Revenue |
|---|---|---|
| Technology | 27 | $1,492B |
|
||
| Financial Services | 3 | $174B |
|
||
| Retail | 3 | $44B |
|
||
| Insurance | 3 | $26B |
|
||
| Media / Entertainment | 2 | $115B |
|
||
| Pharmaceuticals / Biotech | 2 | $62B |
|
||
Price history
1 event — show timeline
- 2026-05-22 Listed $130,000 BAREIS
Cash-flow waterfall
monthlySold comps — $/sqft
last 12 mo · ≤1 miLoading sold comps…