 Duplex
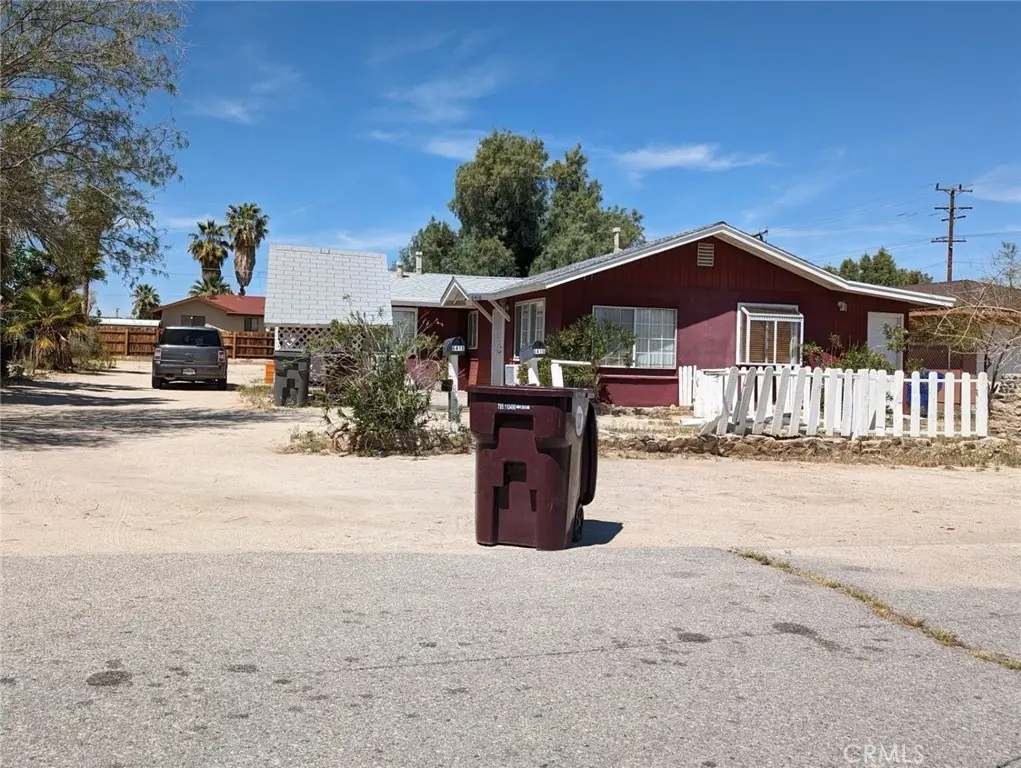
6416 East Court Way · Twentynine Palms, CA
Flood risk 1/10 · Minimal
- FEMA flood zone
- X
- Chance of flooding over 30 yrs
- 0.0%
- Est. flood insurance / yr
- $507 – $1,088
Fire risk 3/10 · Minor
- Est. fire insurance / yr
- $659 – $1,223
Heat risk 8/10 · Major
- Hot days now (above 106°F)
- 8 days/yr
- Hot days in 30 yrs
- 22 days/yr
Wind risk 1/10 · Minimal
- Chance of severe wind over 30 yrs
- —
Air-quality risk 5/10 · Moderate
- Unhealthy air days now
- 8 days/yr
- Unhealthy air days in 30 yrs
- 11 days/yr
Risk factors via First Street. Map © Google.
Why this score? — see what drove the C- grade
The composite is a weighted blend of 9 inputs, each scored 0–100. Each bar is that input's sub-score; the figure is the points it added to the 100-point composite (weight × sub-score).
- Cash flow +19.8/30.0
- ARV discount +7.7/15.0
- DSCR +6.3/10.0
- 1% rule +5.5/10.0
- Rent growth +3.6/5.0
- Livability +3.0/5.0
- Condition / age +2.5/5.0
- Schools +2.2/10.0
- Appreciation +0.0/10.0
$250,000
🖨 Deal sheet (PDF) 📄 Offer letter ✓ Due diligence
Multi-family units
County records classify this as Multi-Family (2-4 Unit). Listing-text estimate: 2 units. confirmed
Listing remarks MLS
* * * At this price is a short sale that has to be negotiated with the existing lender * * * Two units 2 bed 1 bath each, wall heater in each unit. "NEW A/C AND BOILER IN EACH UNIT"
Key facts
- New boiler
- New a/c
- 0.26 acre lot
Tags
Neighborhood map
What this means for you Summary
Snapshot
- This is a 2 × 2-bed/1.0-bath units multifamily listed at $250k.
Deal economics
- At list price, monthly cash flow is $296 ($4k/yr) — positive. Per door: $148/mo.
- The deal already cash-flows at list — no discount required.
- Meets the 1% rule at list price ($3k rent vs $250k).
- Recommended offer: $220k (12.0% below list) — sets the bar for market timing.
- Cap rate 7.7% vs local median 4.1% in Twentynine Palms — top-decile yield for the area; either an underpriced asset or a hidden risk that comps aren't pricing in. Stress-test before assuming the spread holds.
Location & tenants
- Location reads 59/100 on livability (#622 in CA) — a working-class tenant base; expect higher turnover. Strengths: commute A+, housing A+; Watch: amenities F, employment D-, health & safety F.
- Morongo Unified (town): math 15% / reading 38% proficiency, ranked #395 of 517 in CA (top 76%) — low school quality limits family demand, transient renter base, plan for 1-2y turnover.
- Zoned schools: Palm Vista Elementary (math 24% / reading 24%, grade F, #973 of 1,571 statewide, top 73%, 383 students, 80% FRL); Twentynine Palms Junior High (math 17% / reading 39%, grade F, #236 of 498 statewide, top 48%, 413 students, 63% FRL); Twentynine Palms High (math 32% / reading 62%, grade D-, #389 of 1,170 statewide, top 35%, 729 students, 66% FRL).
- Market conditions: Rents rising fast (+4.5%/yr); 751 active listings in the ZIP; 7 comparable units currently listed for rent nearby; rentals at typical pace (median 26d on market — plan ~3-4 weeks tenant-placement turnaround); 5,458 units permitted in San Bernardino County in 2024 (1,500 in 5+ unit buildings).
- At $2,626/mo this rent would consume 52% of the median local household income ($61k/yr) (locally 1057% of renters already pay >50% of income on rent) — very limited rent-growth headroom before tenants either downsize or default.
Forward outlook
- Local home prices are declining (-3.0%/yr); year-one equity from $2k of loan paydown is wiped out by about $8k of value loss. Plan a longer hold.
- San Bernardino County population projected at +15% by 2050 — modest demand growth; plan on rents tracking national, not racing it.
Negotiation context
- It's been on market 304 days — a 12% lower offer ($220k) is reasonable based on typical stale-listing flexibility.
- 11 sale attempts since 26y ago; this cycle's ask has dropped $70k (22%) from the opening price — seller is motivated, your offer sets the floor, not the list.
Risks & watch-outs
- Watch-outs: built in 1954 — expect roof / HVAC / electrical / plumbing capex.
- Climate carrying-cost: extreme-heat days projected 8→22/yr by 2055 (HVAC capex compounding) — expect insurance premiums to compound above CPI over the hold.
Questions for the listing agent
- It's been on market 304 days. Have you received any prior offers? Is the seller open to a 12% concession, seller financing, or rate buy-down credit?
- Can we see the unit-by-unit rent roll, current vacancy, and any below-market leases? What's the average tenancy length?
- What capital expenditures (roof, boiler, parking lot, exteriors) have been made in the last 5 years, and what's planned in the next 2?
- Built in 1954 — when were the roof, HVAC, electrical panel, plumbing, and water heater last replaced?
- Why hasn't it sold? Are there any deal-killer items the seller is aware of (foundation, flood, title, zoning, code violations)?
- Is there a deadline driving the sale (1031 exchange, divorce, estate, relocation)? That informs how much negotiation room exists.
- Schools are D-rated, which usually means shorter tenancies and higher turnover. Who's the typical renter profile here, and what's been the actual vacancy rate?
- What's the average days-on-market for RENTAL listings here right now (not sales)? A rising rental-DOM trend means longer vacancies and softer asking-rent achievability than the comps imply.
- What's the recent tenant-quality profile in this submarket — average credit score on applications, eviction rate, late-payment / NSF rate, and stable-employment percentage? A property-management company in the area should have these aggregated.
- How much new apartment / multifamily construction is in the pipeline within 1–3 miles? Heavy new supply (>2% of stock underway) typically softens rents 12–24 months out; light construction supports rent growth.
Investment metrics
- 1% rule
- 1.05% ✓
- Cap rate
- 7.71%
- Cash-on-cash
- 5.07%
- DSCR
- 1.23
- GRM
- 7.9
CMA / ARV
- ARV (median comp)
- $251,048
- List price
- $250,000
- Delta
- -0.42%
- Verdict
- FAIR
- Comps
- 14 within 1.0 mi
Show comp detail 2 sales within ~0.75 mi
| Address | Dist | Beds/Ba | Sqft | Sold | Price | $/sf | Match |
|---|---|---|---|---|---|---|---|
| 6455 Tamarisk | 0.48mi | 4/2.0 | 1,325 (+10%) | 4mo | $300,000 | $226 | 57 |
| 74031 Gorgonio Dr | 0.20mi | 4/2.0 | 1,050 (-12%) | 17mo | $180,000 | $171 | 56 |
Match score weights: distance 35% · size 25% · config 20% · recency 20%. Top-matched comps best support the ARV.
Projected returns pro-forma
-3.0% appreciation · 4.45% rent growth · sell at horizon
- IRR
- -6.7%
- Equity multiple
- 0.75×
- Total profit
- $-17,715
- Equity at exit
- $37,276
- IRR
- 4.7%
- Equity multiple
- 1.36×
- Total profit
- $25,546
- Equity at exit
- $21,615
Cash invested: $70,000 (down + closing). Projections, not guarantees.
Landlord ↔ Tenant lean methodology
- Overall (STATE)
- 18 Strongly Tenant-Friendly
- State California
- 18 Strongly Tenant-Friendly · D+13
- County
- — inherits STATE
- City
- — inherits STATE
ZIP-level market 92277
- Home prices YoY
- -3.1%
- Rents YoY
- 4.5%
- Active inventory
- 751
- Price-to-rent
- 15.9×
Monthly cashflow live
- Estimated rent
- $2,626 high interval (Pro) →
- Mortgage (P&I)
- −$1,311
- Tax from tax record
- −$364 /mo · $4,363/yr
- Insurance
- −$104
- HOA
- −$0
- Vacancy / Maint / Mgmt
- −$551
- Net cashflow
- $296
Break-even live
Sensitivity live
| Price | -10% $437 | -5% $367 | +0% $296 | +5% $225 | +10% $154 |
|---|---|---|---|---|---|
| Rent | -10% $88 | -5% $192 | +0% $296 | +5% $400 | +10% $503 |
| Rate | -1.0pp $422 | -0.5pp $359 | base $296 | +0.5pp $231 | +1.0pp $165 |
2-unit breakdown (identical units grouped — click to expand)
| Units | Beds | Baths | Est. rent |
|---|---|---|---|
| 2× units | 2 | 1 | $2,626 |
| #1 | 2 | 1 | $1,313 |
| #2 | 2 | 1 | $1,313 |
| Total (2 units) | $2,626 | ||
UW: 25.0% down · 7.5% · 30yr · 1.5% tax · 5.0% vac · 8.0% maint · 8.0% mgmt
Financing live
Cash to close
- Down payment
- $62,500
- Closing costs
- $7,500
- Reserves months
- —
- Total cash needed
- —
Loan-product check · same deal, 3 products live
Conventional
25% down · 7.5% · 30yr
- Down + closing
- —
- Monthly P&I
- —
- Monthly cashflow
- —
- DSCR
- —
- Eligible?
- —
Personal DTI + credit; lowest rate.
DSCR
20% down · 8.5% · 30yr
- Down + closing
- —
- Monthly P&I
- —
- Monthly cashflow
- —
- DSCR
- —
- Eligible?
- —
No personal income docs; deal must DSCR.
Hard money
10% down · 12.0% · 12mo
- Down + closing
- —
- Monthly P&I
- —
- Monthly cashflow
- —
- DSCR
- —
- Eligible?
- —
Short-term bridge; refi at stabilization.
Rent comps 7 comps
| Address | Beds | Baths | Sqft | Rent | $/sqft | DOM | Units | Dist |
|---|---|---|---|---|---|---|---|---|
| 6447 Athol Ave Twentynine Palms, CA | 3.0 | 2.0 | 1100 | $1,500 | $1.36 | 0d | 1 | 0.15mi |
| 6448 Palm View Ave Twentynine Palms, CA | 3.0 | 2.0 | 1100 | $1,795 | $1.63 | 45d | 1 | 0.18mi |
| 6061 Bagley Ave Twentynine Palms, CA | 3.0 | 2.0 | 1260 | $1,375 | $1.09 | 6d | 2 | 0.58mi |
| 6061 Bagley Ave #27 Twentynine Palms, CA | 3.0 | 2.0 | 1260 | $1,400 | $1.11 | 26d | 1 | 0.58mi |
| 5900 Desert Knoll Ave Twentynine Palms, CA | 2.0–3.0 | 1.5–2.5 | 907 | $1,650 | $1.82 | 0d | 1 | 0.75mi |
| 73477 Desert Trail Dr Twentynine Palms, CA | 3.0 | 2.0 | 1388 | $2,200 | $1.59 | 26d | 1 | 0.95mi |
| 74698 Serrano Dr Twentynine Palms, CA | 3.0 | 2.0 | 1041 | $1,700 | $1.63 | 26d | 1 | 1.41mi |
Listing history 46 events
-
2026-06-21days on market $250,000 Active 304 DOM
-
2026-06-18days on market $250,000 Active 301 DOM
-
2026-06-17days on market $250,000 Active 300 DOM
-
2026-06-16days on market $250,000 Active 299 DOM
-
2026-06-15days on market $250,000 Active 298 DOM
-
2026-06-13days on market $250,000 Active 296 DOM
-
2026-06-13days on market $250,000 Active 295 DOM
-
2026-06-09days on market $250,000 Active 292 DOM
-
2026-06-08days on market $250,000 Active 291 DOM
-
2026-06-07days on market $250,000 Active 290 DOM
-
2026-06-04days on market $250,000 Active 287 DOM
-
2026-06-03days on market $250,000 Active 286 DOM
-
2026-06-02days on market $250,000 Active 285 DOM
-
2026-06-01days on market $250,000 Active 284 DOM
-
2026-05-31days on market $250,000 Active 283 DOM
-
2026-05-09price $250,000 197-char remark
Show marketing remark (197 chars)
* * * At this price is a short sale that has to be negotiated with the existing lender * * * Two units 2 bed 1 bath each, wall heater in each unit. "NEW A/C AND BOILER IN EACH UNIT"
-
2026-02-07status Active 197-char remark
Show marketing remark (197 chars)
* * * At this price is a short sale that has to be negotiated with the existing lender * * * Two units 2 bed 1 bath each, wall heater in each unit. "NEW A/C AND BOILER IN EACH UNIT"
-
2026-02-07price $324,000 197-char remark
Show marketing remark (197 chars)
* * * At this price is a short sale that has to be negotiated with the existing lender * * * Two units 2 bed 1 bath each, wall heater in each unit. "NEW A/C AND BOILER IN EACH UNIT"
-
2025-09-24price $280,000 197-char remark
Show marketing remark (197 chars)
* * * At this price is a short sale that has to be negotiated with the existing lender * * * Two units 2 bed 1 bath each, wall heater in each unit. "NEW A/C AND BOILER IN EACH UNIT"
-
2025-08-04$320,000 Active 197-char remark
Show marketing remark (197 chars)
* * * At this price is a short sale that has to be negotiated with the existing lender * * * Two units 2 bed 1 bath each, wall heater in each unit. "NEW A/C AND BOILER IN EACH UNIT"
-
2025-07-12historical
-
2024-09-16$350,000 Active
-
2024-09-15historical $1,000
-
2024-09-11$1,000
-
2024-06-27historical
-
2024-06-11historical Active Under Contract
-
2024-04-30status Pending Sale
-
2024-04-17$425,000 Active
-
2023-07-22historical
-
2023-05-11soldstatus $305,000 Closed Sale
-
2023-05-11soldstatus $305,000
-
2023-04-17status Pending Sale
-
2023-03-29$290,000 Active
-
2018-04-16soldstatus $124,000 Closed Sale
-
2018-04-16soldstatus $124,000
-
2018-04-16soldstatus $124,000
-
2018-03-03historical Active Under Contract
-
2017-12-05status Active
-
2017-11-15historical Active Under Contract
-
2017-08-27$129,900 Active
-
2017-08-26$129,900
-
2005-01-07soldstatus $90,000
-
2001-01-01historical
-
2000-11-30historical
-
2000-07-24$55,000
-
2000-07-24$55,000
ⓘ Source: listings_history table (triggers on properties + properties_extension) + one-shot
backfill from property_details.listing_events for pre-trigger history.
Tax reassessment forecast CA · Resets to sale price
- Current annual tax
- $4,363 · $364/mo
- Projected year-2 tax
- $4,363 · $364/mo
- Expected delta
- $0/yr ($0/mo · 0.0%)
ⓘ Screening estimate from a state-policy table — verify with the county assessor before closing.
Climate risk First Street
- Flood 1/10 Low FEMA zone X · 0% chance over 30 yrs
- Wildfire 3/10 Moderate
- Heat 8/10 Severe 8 d/yr ≥106°F today · 22 d/yr by 30 yrs out
- Wind 1/10 Low
- Air quality 5/10 Major 8 unhealthy d/yr today · 11 by 30 yrs out
Nearby sold comps map
Loading sold comps map…
Walkable amenities ~0.75 mi
Loading nearby amenities…
Taxation est. · year 1
- Rental income
- $31,512
- − Mortgage interest
- −$14,004
- − Property taxes
- −$4,363
- − Insurance
- −$1,250
- − Repairs & maintenance
- −$2,521
- − Management
- −$2,521
- − Depreciation
- −$7,273
- Taxable loss
- −$419
- Est. tax savings @ 24.0%
- +$101
- After-tax cash flow
- $3,650/yr
For passive investors: Depreciation is non-cash, so a rental often shows a tax loss while cash-flowing — sheltering income. Rental losses are passive: they offset passive income freely, and up to $25,000/yr can offset ordinary (W-2) income if you actively participate and your MAGI is under $100k (phasing out to $0 by $150k); unused losses carry forward. On sale, claimed depreciation is recaptured at up to 25%, and gains may owe capital-gains tax (a 1031 exchange can defer both). Figures are a year-1 estimate at your 24.0% rate — not tax advice; consult a CPA.
Schools (NCES district)
- District
- Morongo Unified
- NCES district ID
- 0625860
- Math proficiency
- 15% ▼ -12.00%
- Reading proficiency
- 38% ▼ -3.00%
- Median HH income
- $39,399
- Composite
- 22.19/100
- National rank
- #8156
- State rank
- #395 of 517 in CA
Livability — Twentynine Palms
- Score
- 59/100
- State rank
- #622
- US rank
- #19731
Category grades
Schools grade is shown separately in the Schools card above.
Census & demographics
- Census place
- Twentynine Palms, CA
- County
- San Bernardino County · 2,030,291 people
- City population
- 26,277
- Metro
- Riverside-San Bernardino-Ontario, CA
- Population (ZIP)
- 26,277
- Household income
- $60,901
- Rent vs Own
- Severe rent burden
- 1057.0
Population outlook (San Bernardino County) Hauer SSP2
- Today (2025)
- 2,300,329 people
- By 2030
- 2,378,907 · +3.4%
- By 2040
- 2,523,137 · +9.7%
- By 2050
- 2,642,388 · +14.9%
- By 2075
- 2,880,769 · +25.2%
- By 2100
- 2,909,436 · +26.5%
Race, ethnicity, and origin ACS 2023
- Neighborhood character
- Diverse neighborhood (Simpson 0.70)
- Race & ethnicity
- White 49% Two or more races 24% Hispanic / Latino 24% Black 9% Asian 4% Pacific Islander 1% Native American 1%
- Hispanic origin (detail)
- Mexican 20%
- Common ancestry
- Italian 5% Lithuanian 3% Slovak 3%
- Foreign-born
- 9% · Canada, China, South Korea
- Languages at home
- 81% English-only · Spanish 12% Other Asian/Pacific 2% Tagalog/Filipino 1%
Political lean MEDSL · San Bernardino
- 2024 margin
- Toss-up / Even · D 47.5% · R 49.7% · Other 2.8%
- 2008→2024 swing
- -8.5pp toward R · 2008: 6.3pp · 2024: -2.1pp
- All cycles
- 2024: R+2.1 2020: D+10.7 2016: D+9.8 2012: D+5.4 2008: D+6.3
Not yet ingested
- Civics
- —
Market trends
- HPI YoY
- ▼ -12.15%
- Current HPI
- 380.5083
- Rent YoY
- ▲ 4.45%
- Metro
- Riverside-San Bernardino-Ontario, CA
- State GDP YoY
- ▲ 3.21%
- F500 in state
- 116
Industry mix (Fortune 500 HQ in CA)
| Industry | F500 HQs | Revenue |
|---|---|---|
| Technology | 27 | $1,492B |
|
||
| Financial Services | 3 | $174B |
|
||
| Retail | 3 | $44B |
|
||
| Insurance | 3 | $26B |
|
||
| Media / Entertainment | 2 | $115B |
|
||
| Pharmaceuticals / Biotech | 2 | $62B |
|
||
Price history
+354.5% since first listed31 events — show timeline
- 2026-05-09 Price Changed $250,000 CRMLS
- 2026-02-07 Relisted — CRMLS
- 2026-02-07 Price Changed $324,000 CRMLS
- 2025-09-24 Price Changed $280,000 CRMLS
- 2025-08-04 Listed $320,000 CRMLS
- 2025-07-12 Listing Removed — CRMLS
- 2024-09-16 Listed $350,000 CRMLS
- 2024-09-15 Rental Removed $1,000 APPFOLIO
- 2024-09-11 Listed for Rent $1,000 APPFOLIO
- 2024-06-27 Listing Removed — CRMLS
- 2024-06-11 Contingent — CRMLS
- 2024-04-30 Pending — CRMLS
- 2024-04-17 Listed $425,000 CRMLS
- 2023-07-22 Rental Removed — APPFOLIO
- 2023-05-11 Sold (Public Records) $305,000 Public Records
- 2023-05-11 Sold (MLS) $305,000 CRMLS
- 2023-04-17 Pending — CRMLS
- 2023-03-29 Listed $290,000 CRMLS
- 2018-04-16 Sold (Public Records) $124,000 Public Records
- 2018-04-16 Sold (MLS) $124,000 SDMLS
- 2018-04-16 Sold (MLS) $124,000 CRMLS
- 2018-03-03 Contingent — CRMLS
- 2017-12-05 Relisted — CRMLS
- 2017-11-15 Contingent — CRMLS
- 2017-08-27 Listed $129,900 CRMLS
- 2017-08-26 Listed $129,900 SDMLS
- 2005-01-07 Sold (Public Records) $90,000 Public Records
- 2001-01-01 Listing Removed — GPSMLS
- 2000-11-30 Listing Removed — CRMLS
- 2000-07-24 Listed $55,000 CRMLS
- 2000-07-24 Listed $55,000 GPSMLS
Property tax history
+6.1%/yrLatest (2025): $4,363 · +5.9% YoY. Source: county tax records.
Cash-flow waterfall
monthlySold comps — $/sqft
last 12 mo · ≤1 miLoading sold comps…