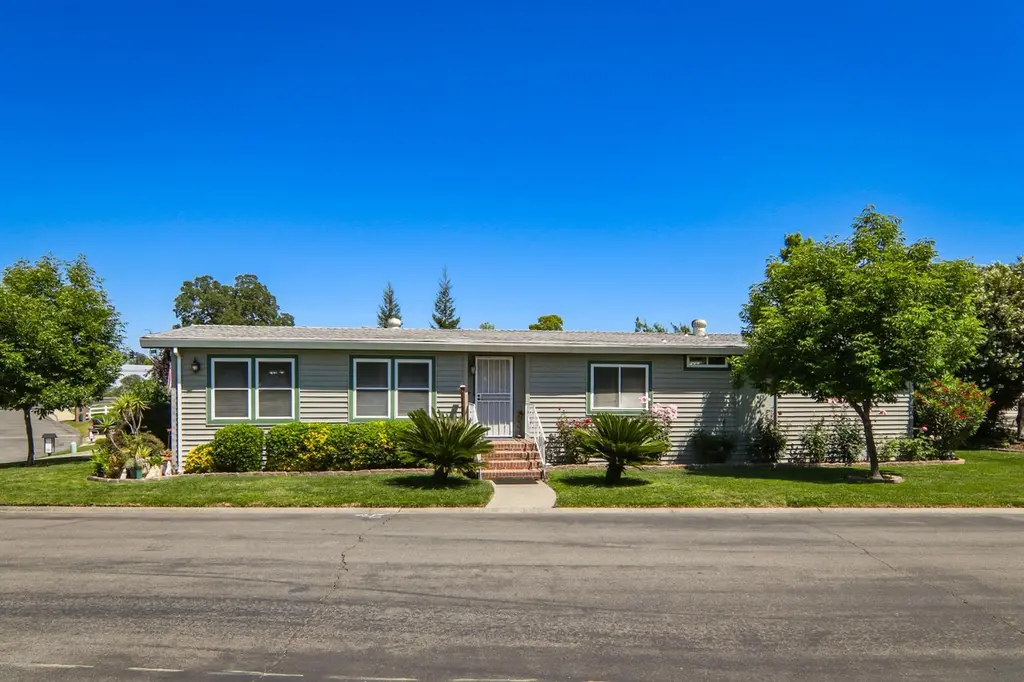
321 Kaseberg Dr · Roseville, CA
Flood risk 1/10 · Minimal
- FEMA flood zone
- X (unshaded)
- Chance of flooding over 30 yrs
- 0.0%
- Est. flood insurance / yr
- $507 – $1,088
Fire risk 5/10 · Moderate
- Est. fire insurance / yr
- $659 – $1,223
Heat risk 7/10 · Major
- Hot days now (above 104°F)
- 7 days/yr
- Hot days in 30 yrs
- 16 days/yr
Wind risk 1/10 · Minimal
- Chance of severe wind over 30 yrs
- —
Air-quality risk 10/10 · Severe
- Unhealthy air days now
- 33 days/yr
- Unhealthy air days in 30 yrs
- 37 days/yr
Risk factors via First Street. Map © Google.
Why this score? — see what drove the C grade
The composite is a weighted blend of 9 inputs, each scored 0–100. Each bar is that input's sub-score; the figure is the points it added to the 100-point composite (weight × sub-score).
- Cash flow +21.7/30.0
- ARV discount +8.9/15.0
- DSCR +6.9/10.0
- 1% rule +5.7/10.0
- Schools +5.1/10.0
- Livability +3.9/5.0
- Rent growth +2.9/5.0
- Condition / age +2.5/5.0
- Appreciation +0.0/10.0
$199,500
🖨 Deal sheet (PDF) 📄 Offer letter ✓ Due diligence
Listing remarks
Welcome to this beautifully maintained 2,000 sq ft modular home located on a large corner lot in the highly desirable 55+ community of Diamond K Estates. Offering 2(3) spacious bedrooms with a 3rd bedroom option or a versatile office, and 2 custom full bathrooms, this home combines comfort, functionality, and style in a prime Roseville location. Step inside to discover a bright and open floor plan featuring beautiful laminate flooring in the entry, kitchen and throughout the sitting room and guest bath, with carpet in the main living room, dining room and bedrooms for added warmth and comfort. The custom kitchen is designed for both everyday living and entertaining, complete with pantry cab
Key facts
- Large corner lot
- Pantry cabinets
- Pull out shelves
Tags
Property features AI
Finance
- Other: Senior community
- Financial info: Land lease amount applies
- HOA & community: No homeowners association; Land lease community (land lease applies)
Exterior
- Parking: Garage door opener; Guest parking available
- Utilities: Cable available; Natural gas connected; Public water; Public sewer; Electric: other
- Home design: Manufactured in park; Triple wide; Entry located on main level; Built in 1979; Facing direction not specified
- Construction: Composition roof; Vinyl skirting; Manufacturer: 9248 Golden West; Make: CYLYPSO
- Exterior features: Auto sprinkler front and rear; Backyard; Corner lot; Front yard
Interior
- Kitchen: Free standing gas range; Hood over range; Dishwasher; Disposal; Microwave
- Bedrooms: 2 bedrooms (possible 3)
- Flooring: Carpet; Laminate
- Bathrooms: 2 full bathrooms; Tile surfaces and shower stall(s)
- Heating & cooling: Central heating; Central cooling
- Interior features: Covered patio; Pantry cabinet; Great room; Office, dining room, living room, laundry, and master bedroom included; Pets allowed
- Laundry & utility: Laundry located inside; Other laundry features
Neighborhood map
What this means for you Summary
Snapshot
- This is a 2-bed/2.0-bath manufactured listed at $200k.
Deal economics
- At list price, monthly cash flow is $306 ($4k/yr) — positive.
- The deal already cash-flows at list — no discount required.
- Meets the 1% rule at list price ($2k rent vs $200k).
- Recommended offer: $194k (3.0% below list) — sets the bar for market timing.
- Cap rate 8.1% vs local median 2.8% in Roseville — top-decile yield for the area; either an underpriced asset or a hidden risk that comps aren't pricing in. Stress-test before assuming the spread holds.
Location & tenants
- Location reads 77/100 on livability (#90 in CA, #3,239 nationally) — a middle-class / working-renter tenant base. Strengths: commute A+, employment A+, housing A+; Watch: cost of living F.
- Roseville Joint Union High (urban): math 42% / reading 71% proficiency, ranked #86 of 517 in CA (top 17%) — acceptable for families but not a draw, mixed tenant base, ~2y average lease.
- Zoned schools: Bradford Woodbridge Fundamental Elementary (288 students, 87% FRL); Robert C. Cooley Middle (800 students, 43% FRL); Roseville High (math 38% / reading 68%, grade C-, #285 of 1,170 statewide, top 25%, 1,617 students, 28% FRL).
- Market conditions: Rents rising (+1.8%/yr); 171 active listings in the ZIP; 11 comparable units currently listed for rent nearby; rentals leasing fast (median 0d on market — plan ~1-2 weeks tenant-placement turnaround); solid renter incomes; 3,535 units permitted in Placer County in 2024 (689 in 5+ unit buildings).
Forward outlook
- Local home prices are declining (-3.0%/yr); year-one equity from $1k of loan paydown is wiped out by about $6k of value loss. Plan a longer hold.
- Placer County population projected at +20% by 2050 — long-run rental-demand tailwind backs the buy-and-hold thesis.
Negotiation context
- It's been on market 46 days — a 3% lower offer ($194k) is reasonable based on typical stale-listing flexibility.
Risks & watch-outs
- Climate carrying-cost: moderate wildfire risk; extreme-heat days projected 7→16/yr by 2055 (HVAC capex compounding) — expect insurance premiums to compound above CPI over the hold.
Questions for the listing agent
- It's been on market 46 days. Have you received any prior offers? Is the seller open to a 3% concession, seller financing, or rate buy-down credit?
- Built in 1979 — when were the roof, HVAC, electrical panel, plumbing, and water heater last replaced?
- Is there a deadline driving the sale (1031 exchange, divorce, estate, relocation)? That informs how much negotiation room exists.
- Schools are B-rated — typically a magnet for longer-tenancy family renters. What's the average tenant stay here, and is there a school-zone premium baked into asking?
- What's the average days-on-market for RENTAL listings here right now (not sales)? A rising rental-DOM trend means longer vacancies and softer asking-rent achievability than the comps imply.
- What's the recent tenant-quality profile in this submarket — average credit score on applications, eviction rate, late-payment / NSF rate, and stable-employment percentage? A property-management company in the area should have these aggregated.
- How much new for-sale + rental construction is in the pipeline within 1–3 miles? Heavy new supply typically softens prices + rents 12–24 months out; constrained supply supports both.
Investment metrics
- 1% rule
- 1.07% ✓
- Cap rate
- 8.14%
- Cash-on-cash
- 6.58%
- DSCR
- 1.29
- GRM
- 7.8
CMA / ARV
- ARV (on-the-fly)
- $206,000
- Comps found
- 7
Show comp detail 7 sales within ~0.75 mi
| Address | Dist | Beds/Ba | Sqft | Sold | Price | $/sf | Match |
|---|---|---|---|---|---|---|---|
| 116 Kaseberg Dr | 0.17mi | 2/2.0 | 2,160 (+8%) | 1mo | $175,000 | $81 | 78 |
| 27 Hancock Dr | 0.17mi | 2/2.0 | 1,790 (-10%) | 0mo | $189,000 | $106 | 74 |
| 144 Kaseberg Dr | 0.20mi | 2/2.0 | 1,788 (-11%) | 8mo | $153,000 | $86 | 66 |
| 290 Lafayette | 0.13mi | 2/2.0 | 1,708 (-15%) | 5mo | $175,900 | $103 | 65 |
| 140 Kaseberg Dr | 0.24mi | 2/2.0 | 2,108 (+5%) | 21mo | $235,000 | $111 | 63 |
| 255 Kirkwood Dr | 0.36mi | 3/2.5 (+1) | 1,760 (-12%) | 2mo | $134,500 | $76 | 54 |
| 128 Kaseberg Dr | 0.29mi | 3/2.5 (+1) | 1,840 (-8%) | 17mo | $215,500 | $117 | 52 |
Match score weights: distance 35% · size 25% · config 20% · recency 20%. Top-matched comps best support the ARV.
Projected returns pro-forma
-3.0% appreciation · 1.75% rent growth · sell at horizon
- IRR
- -7.6%
- Equity multiple
- 0.72×
- Total profit
- $-15,435
- Equity at exit
- $29,746
- IRR
- 0.3%
- Equity multiple
- 1.02×
- Total profit
- $1,209
- Equity at exit
- $17,249
Cash invested: $55,860 (down + closing). Projections, not guarantees.
Landlord ↔ Tenant lean methodology
- Overall (STATE)
- 18 Strongly Tenant-Friendly
- State California
- 18 Strongly Tenant-Friendly · D+13
- County
- — inherits STATE
- City
- — inherits STATE
ZIP-level market 95678
- Rents YoY
- 1.8%
- Active inventory
- 171
- Price-to-rent
- 7.8×
Monthly cashflow live
- Estimated rent
- $2,133 high interval (Pro) →
- Mortgage (P&I)
- −$1,046
- Tax est. 1.5%
- −$249 /mo · $2,992/yr
- Insurance
- −$83
- HOA
- −$0
- Lot rent leased land?
- −$0
- Vacancy / Maint / Mgmt
- −$448
- Net cashflow
- $306
Break-even live
Sensitivity live
| Price | -10% $444 | -5% $375 | +0% $306 | +5% $237 | +10% $168 |
|---|---|---|---|---|---|
| Rent | -10% $138 | -5% $222 | +0% $306 | +5% $391 | +10% $475 |
| Rate | -1.0pp $407 | -0.5pp $357 | base $306 | +0.5pp $255 | +1.0pp $202 |
UW: 25.0% down · 7.5% · 30yr · 1.5% tax · 5.0% vac · 8.0% maint · 8.0% mgmt
Financing live
Cash to close
- Down payment
- $49,875
- Closing costs
- $5,985
- Reserves months
- —
- Total cash needed
- —
Loan-product check · same deal, 3 products live
Conventional
25% down · 7.5% · 30yr
- Down + closing
- —
- Monthly P&I
- —
- Monthly cashflow
- —
- DSCR
- —
- Eligible?
- —
Personal DTI + credit; lowest rate.
DSCR
20% down · 8.5% · 30yr
- Down + closing
- —
- Monthly P&I
- —
- Monthly cashflow
- —
- DSCR
- —
- Eligible?
- —
No personal income docs; deal must DSCR.
Hard money
10% down · 12.0% · 12mo
- Down + closing
- —
- Monthly P&I
- —
- Monthly cashflow
- —
- DSCR
- —
- Eligible?
- —
Short-term bridge; refi at stabilization.
Rent comps 11 comps
| Address | Beds | Baths | Sqft | Rent | $/sqft | DOM | Units | Dist |
|---|---|---|---|---|---|---|---|---|
| 1317 Rice Ln Roseville, CA | 3.0 | 2.0 | 1442 | $2,395 | $1.66 | 0d | 1 | 0.47mi |
| 304 Diamond Oaks Rd Roseville, CA | 3.0 | 2.0 | 2116 | $3,200 | $1.51 | 13d | 1 | 0.52mi |
| 1243 S Bluff Dr Roseville, CA | 3.0 | 2.0 | 1433 | $2,795 | $1.95 | 24d | 1 | 0.58mi |
| 317 Aspen Ct Roseville, CA | 3.0 | 2.0 | 1744 | $3,200 | $1.83 | 0d | 1 | 0.63mi |
| 409 Washington Blvd Roseville, CA | 3.0 | 2.0 | 2000 | $1,995 | $1.00 | 0d | 1 | 0.97mi |
| 189 Hickory St Roseville, CA | 3.0 | 2.5 | 1525 | $2,995 | $1.96 | 0d | 1 | 1.26mi |
| 412 Avila Dr Roseville, CA | 3.0 | 3.0 | 1839 | $2,900 | $1.58 | 0d | 1 | 1.33mi |
| 201 Sapphire Ct Roseville, CA | 3.0 | 3.0 | 1488 | $2,750 | $1.85 | 21d | 1 | 1.33mi |
| 120 Ivy St Roseville, CA | 3.0 | 2.5 | 1525 | $2,595 | $1.70 | 0d | 1 | 1.35mi |
| 129 Vernon St Apt 403 Roseville, CA | 2.0 | 2.0 | 2112 | $4,500 | $2.13 | 10d | 1 | 1.36mi |
| 1218 Chablis Cir Roseville, CA | 3.0 | 2.0 | 1438 | $2,495 | $1.74 | 0d | 1 | 1.42mi |
Listing history 16 events
-
2026-06-22days on market $199,500 Active 46 DOM
-
2026-06-21days on market $199,500 Active 45 DOM
-
2026-06-18days on market $199,500 Active 42 DOM
-
2026-06-17days on market $199,500 Active 41 DOM
-
2026-06-16days on market $199,500 Active 40 DOM
-
2026-06-15days on market $199,500 Active 39 DOM
-
2026-06-13days on market $199,500 Active 37 DOM
-
2026-06-13pricedays on market $199,500 Active 36 DOM
-
2026-06-09days on market $225,000 Active 33 DOM
-
2026-06-08days on market $225,000 Active 32 DOM
-
2026-06-07days on market $225,000 Active 31 DOM
-
2026-06-05days on market $225,000 Active 28 DOM
-
2026-06-03days on market $225,000 Active 27 DOM
-
2026-06-02days on market $225,000 Active 26 DOM
-
2026-06-01days on market $225,000 Active 25 DOM
-
2026-05-31days on market $225,000 Active 24 DOM
ⓘ Source: listings_history table (triggers on properties + properties_extension) + one-shot
backfill from property_details.listing_events for pre-trigger history.
Climate risk First Street
- Flood 1/10 Low FEMA zone X (unshaded) · 0% chance over 30 yrs
- Wildfire 5/10 Major
- Heat 7/10 Severe 7 d/yr ≥104°F today · 16 d/yr by 30 yrs out
- Wind 1/10 Low
- Air quality 10/10 Extreme 33 unhealthy d/yr today · 37 by 30 yrs out
Nearby sold comps map
Loading sold comps map…
Walkable amenities ~0.75 mi
Loading nearby amenities…
Taxation est. · year 1
- Rental income
- $25,595
- − Mortgage interest
- −$11,175
- − Property taxes
- −$2,992
- − Insurance
- −$998
- − Repairs & maintenance
- −$2,048
- − Management
- −$2,048
- − Depreciation
- −$5,804
- Taxable income
- $531
- Est. tax owed @ 24.0%
- −$128
- After-tax cash flow
- $3,548/yr
For passive investors: Depreciation is non-cash, so a rental often shows a tax loss while cash-flowing — sheltering income. Rental losses are passive: they offset passive income freely, and up to $25,000/yr can offset ordinary (W-2) income if you actively participate and your MAGI is under $100k (phasing out to $0 by $150k); unused losses carry forward. On sale, claimed depreciation is recaptured at up to 25%, and gains may owe capital-gains tax (a 1031 exchange can defer both). Figures are a year-1 estimate at your 24.0% rate — not tax advice; consult a CPA.
Schools (NCES district)
- District
- Roseville Joint Union High
- NCES district ID
- 0633630
- Math proficiency
- 42% ▼ -6.00%
- Reading proficiency
- 71% ▼ -3.00%
- Median HH income
- $81,930
- Composite
- 51.11/100
- National rank
- #1763
- State rank
- #86 of 517 in CA
Livability — Roseville
- Score
- 77/100
- State rank
- #90
- US rank
- #3239
Category grades
Schools grade is shown separately in the Schools card above.
Census & demographics
- Census place
- Roseville, CA
- County
- Placer County · 390,510 people
- City population
- 161,837
- Metro
- Sacramento-Roseville-Folsom, CA
- Population (ZIP)
- 45,346
- Household income
- $100,554
- Rent vs Own
- Severe rent burden
- 2544.0
Population outlook (Placer County) Hauer SSP2
- Today (2025)
- 422,709 people
- By 2030
- 444,249 · +5.1%
- By 2040
- 480,192 · +13.6%
- By 2050
- 506,390 · +19.8%
- By 2075
- 550,219 · +30.2%
- By 2100
- 547,760 · +29.6%
Race, ethnicity, and origin ACS 2023
- Neighborhood character
- Diverse neighborhood (Simpson 0.58)
- Race & ethnicity
- White 60% Hispanic / Latino 23% Two or more races 17% Asian 8% Black 2%
- Hispanic origin (detail)
- Mexican 16% Puerto Rican 1%
- Common ancestry
- Russian 3% Slovak 2% Italian 2%
- Foreign-born
- 14% · Canada, China, South Korea
- Languages at home
- 79% English-only · Spanish 10% Other Indo-European 4% Russian/Polish/Slavic 2%
Political lean MEDSL · Placer
- 2024 margin
- Lean R (+8.5) · D 44.3% · R 52.8% · Other 2.9%
- 2008→2024 swing
- +2.8pp toward D · 2008: -11.3pp · 2024: -8.5pp
- All cycles
- 2024: R+8.5 2020: R+6.7 2016: R+11.3 2012: R+20.1 2008: R+11.3
Not yet ingested
- Civics
- —
Market trends
- HPI YoY
- ▼ -418.46%
- Current HPI
- 272.0182
- Rent YoY
- ▲ 1.75%
- Metro
- Sacramento-Roseville-Folsom, CA
- State GDP YoY
- ▲ 3.21%
- F500 in state
- 116
Industry mix (Fortune 500 HQ in CA)
| Industry | F500 HQs | Revenue |
|---|---|---|
| Technology | 27 | $1,492B |
|
||
| Financial Services | 3 | $174B |
|
||
| Retail | 3 | $44B |
|
||
| Insurance | 3 | $26B |
|
||
| Media / Entertainment | 2 | $115B |
|
||
| Pharmaceuticals / Biotech | 2 | $62B |
|
||
Cash-flow waterfall
monthlySold comps — $/sqft
last 12 mo · ≤1 miLoading sold comps…