 Triplex
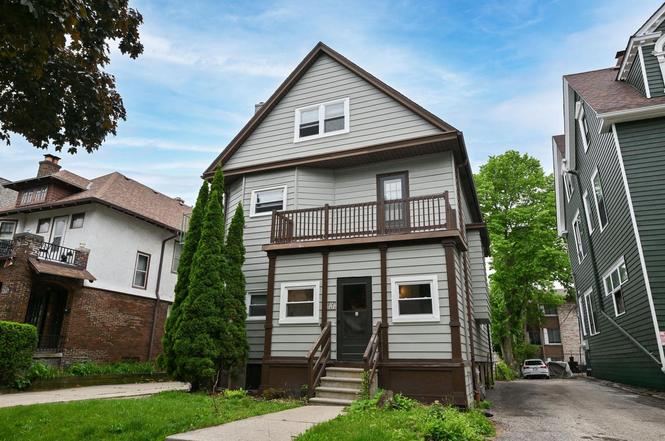
2621 N Maryland Ave · Milwaukee, WI
Flood risk 1/10 · Minimal
- FEMA flood zone
- X (unshaded)
- Chance of flooding over 30 yrs
- 0.0%
- Est. flood insurance / yr
- $473 – $860
Fire risk 1/10 · Minimal
- Est. fire insurance / yr
- $636 – $1,182
Heat risk 2/10 · Minimal
- Hot days now (above 96°F)
- 7 days/yr
- Hot days in 30 yrs
- 13 days/yr
Wind risk 2/10 · Minimal
- Chance of severe wind over 30 yrs
- —
Air-quality risk 3/10 · Minor
- Unhealthy air days now
- 3 days/yr
- Unhealthy air days in 30 yrs
- 4 days/yr
Risk factors via First Street. Map © Google.
Why this score? — see what drove the F grade
The composite is a weighted blend of 9 inputs, each scored 0–100. Each bar is that input's sub-score; the figure is the points it added to the 100-point composite (weight × sub-score).
- Cash flow +14.3/30.0
- DSCR +4.4/10.0
- Livability +4.0/5.0
- 1% rule +3.6/10.0
- Rent growth +3.1/5.0
- Condition / age +2.5/5.0
- Schools +1.2/10.0
- ARV discount +0.0/15.0
- Appreciation +0.0/10.0
$600,000
🖨 Deal sheet 📄 Offer letter ✓ Due diligence
Multi-family units
County records classify this as Multi-Family (2-4 Unit). Listing-text estimate: 3 units. confirmed
Listing remarks
Completely turn key, LEGAL 3 family on Milwaukee's East Side. The unit mix includes: First Floor: 3BR / 1.5BA---Second Floor: 4BR / 1BA---Third Floor: 2BR / 1BA. All apartments have been recently updated and refreshed, and all windows were replaced within the last two years. This property is easy to manage for a first or second-time investor, or it could serve as an ideal opportunity for student housing. Additionally, the property includes a two-car detached garage and two slab parking spots for extra income, with space in the backyard to add further parking.
Key facts
- Replaced windows
- Recently updated
- Slab parking spots
Tags
Property features AI
Finance
- Other: Lot size approximately 0.13 acres; Zoning: RT3
Exterior
- Parking: Outdoor space parking; Indoor parking available; Outside parking
- Utilities: Municipal water; Municipal sewer
- Home design: Multi-family property; Apartment building / duplex+; 3–4 stories
- Construction: Aluminum construction
- Exterior features: Aluminum/steel exterior
Interior
- Kitchen: Includes 3 stoves; Includes 3 refrigerators; Includes 1 dishwasher
- Heating & cooling: Forced air heating; Natural gas fuel
- Interior features: Brick full basement; Building contains 3 units
- Laundry & utility: One seller-owned washer; One seller-owned dryer
Neighborhood map
What this means for you Summary
Snapshot
- This is a 2×3.0bd/1.5ba + 1×2.0bd/1.0ba units multifamily listed at $600k.
Deal economics
- At list price, monthly cash flow is $111 ($1k/yr) — positive. Per door: $37/mo.
- The deal already cash-flows at list — no discount required.
- To meet the 1% rule (rent ≥ 1% of price), the offer needs to be $514k (14.3% below list).
- Recommended offer: $514k (14.3% below list) — sets the bar for 1% rule.
- Cap rate 6.5% vs local median 5.1% in Milwaukee — meaningfully above typical; check what's discounted (condition, days-on-market, listing class) to confirm the premium yield is real.
Location & tenants
- Location reads 81/100 on livability (#55 in WI, #1,534 nationally) — a professional / high-income tenant draw. Strengths: amenities A+, commute A+, cost of living A+; Watch: employment D+, schools F, crime F.
- Milwaukee School District (urban): math 10% / reading 18% proficiency, ranked #337 of 342 in WI (top 98%) — low school quality limits family demand, transient renter base, plan for 1-2y turnover; 77% free/reduced lunch — lower-income household profile, screen leases tightly.
- Market conditions: Rents rising (+2.5%/yr); 67 active listings in the ZIP; solid renter incomes; 1,017 units permitted in Milwaukee County in 2024 (803 in 5+ unit buildings).
- At $5,141/mo this rent would consume 82% of the median local household income ($75k/yr) (locally 2472% of renters already pay >50% of income on rent) — very limited rent-growth headroom before tenants either downsize or default.
Forward outlook
- Local home prices are declining (-3.0%/yr); year-one equity from $4k of loan paydown is wiped out by about $18k of value loss. Plan a longer hold.
- Milwaukee County population projected at +4% by 2050 — modest demand growth; plan on rents tracking national, not racing it.
Negotiation context
- Only 3 days on market — expect competitive offers; lowballing is unlikely to land.
- Current owner paid $360k; list at $600k implies a 67% gain — meaningful room to come down on a strong offer.
Risks & watch-outs
- Watch-outs: built in 1895 — expect roof / HVAC / electrical / plumbing capex.
Questions for the listing agent
- Can we see the unit-by-unit rent roll, current vacancy, and any below-market leases? What's the average tenancy length?
- What capital expenditures (roof, boiler, parking lot, exteriors) have been made in the last 5 years, and what's planned in the next 2?
- Built in 1895 — when were the roof, HVAC, electrical panel, plumbing, and water heater last replaced?
- Is there a deadline driving the sale (1031 exchange, divorce, estate, relocation)? That informs how much negotiation room exists.
- Schools are F-rated, which usually means shorter tenancies and higher turnover. Who's the typical renter profile here, and what's been the actual vacancy rate?
- Crime grade is F in this area — have there been break-ins, vandalism, or insurance claims at this property in the last 3 years? What carrier currently insures it and at what premium?
- The area grade is low — what's the realistic commute time and amenity access for the typical tenant pool here? Any planned neighborhood developments (good or bad) we should know about?
- What's the average days-on-market for RENTAL listings here right now (not sales)? A rising rental-DOM trend means longer vacancies and softer asking-rent achievability than the comps imply.
- What's the recent tenant-quality profile in this submarket — average credit score on applications, eviction rate, late-payment / NSF rate, and stable-employment percentage? A property-management company in the area should have these aggregated.
- How much new apartment / multifamily construction is in the pipeline within 1–3 miles? Heavy new supply (>2% of stock underway) typically softens rents 12–24 months out; light construction supports rent growth.
Investment metrics
- 1% rule
- 0.86% ✗
- Cap rate
- 6.51%
- Cash-on-cash
- 0.79%
- DSCR
- 1.04
- GRM
- 9.7
CMA / ARV
- ARV (on-the-fly)
- $491,400
- Comps found
- 12
Show comp detail 12 sales within ~0.75 mi
| Address | Dist | Beds/Ba | Sqft | Sold | Price | $/sf | Match |
|---|---|---|---|---|---|---|---|
| 2744 N Stowell Ave #2746 | 0.25mi | 7/3.0 | 3,542 (+1%) | 2mo | $515,000 | $145 | 83 |
| 2638 N Farwell Ave #2640 | 0.10mi | 7/2.0 | 3,672 (+5%) | 18mo | $427,000 | $116 | 67 |
| 2928 N Farwell Ave #2930 | 0.36mi | 6/3.0 (-1) | 3,645 (+4%) | 6mo | $480,000 | $132 | 65 |
| 2734 N Murray Ave | 0.14mi | 8/2.0 (+1) | 3,092 (-12%) | 3mo | $425,000 | $137 | 60 |
| 2000 E Newberry Blvd #2002 | 0.23mi | 6/2.0 (-1) | 3,798 (+8%) | 11mo | $516,000 | $136 | 55 |
| 2825 N Murray Ave #2827 | 0.27mi | 6/2.0 (-1) | 3,775 (+8%) | 14mo | $501,000 | $133 | 52 |
| 2036 E Kenilworth Pl Unit 2205 N Summit Ave | 0.57mi | 6/3.0 (-1) | 3,752 (+7%) | 6mo | $525,000 | $140 | 50 |
| 1812 E Newberry Blvd #1814 | 0.29mi | 6/2.0 (-1) | 3,045 (-13%) | 4mo | $480,000 | $158 | 50 |
| 2856 N Frederick Ave #2858 | 0.29mi | 8/2.0 (+1) | 3,092 (-12%) | 11mo | $500,000 | $162 | 46 |
| 2863 N Prospect Ave #2865 | 0.32mi | 8/3.0 (+1) | 3,802 (+8%) | 23mo | $490,000 | $129 | 45 |
| 3132 N Bartlett Ave #3134 | 0.67mi | 7/2.5 | 3,195 (-9%) | 16mo | $450,000 | $141 | 37 |
| 3006 N Murray Ave #3008 | 0.45mi | 6/2.0 (-1) | 3,030 (-14%) | 23mo | $472,800 | $156 | 26 |
Match score weights: distance 35% · size 25% · config 20% · recency 20%. Top-matched comps best support the ARV.
Projected returns pro-forma
-3.0% appreciation · 2.55% rent growth · sell at horizon
- IRR
- -15.5%
- Equity multiple
- 0.45×
- Total profit
- $-92,536
- Equity at exit
- $89,462
- IRR
- -7.8%
- Equity multiple
- 0.52×
- Total profit
- $-81,097
- Equity at exit
- $51,877
Cash invested: $168,000 (down + closing). Projections, not guarantees.
Landlord ↔ Tenant lean methodology
- Overall (STATE)
- 73 Landlord-Friendly
- State Wisconsin
- 73 Landlord-Friendly · R+2
- County
- — inherits STATE
- City
- — inherits STATE
ZIP-level market 53211
- Rents YoY
- 2.5%
- Active inventory
- 67
- Price-to-rent
- 28.4×
Monthly cashflow live
- Estimated rent
- $5,141 high interval (Pro) →
- Mortgage (P&I)
- −$3,146
- Tax from tax record
- −$554 /mo · $6,651/yr
- Insurance
- −$250
- HOA
- −$0
- Vacancy / Maint / Mgmt
- −$1,080
- Net cashflow
- $111
Break-even live
3-unit breakdown (identical units grouped — click to expand)
| Units | Beds | Baths | Est. rent |
|---|---|---|---|
| 2× units | 3.0 | 1.5 | $3,526 |
| #1 | 3.0 | 1.5 | $1,763 |
| #2 | 3.0 | 1.5 | $1,763 |
| 1× unit | 2.0 | 1 | $1,614 |
| Total (3 units) | $5,141 | ||
UW: 25.0% down · 7.5% · 30yr · 1.5% tax · 5.0% vac · 8.0% maint · 8.0% mgmt
Financing live
Cash to close
- Down payment
- $150,000
- Closing costs
- $18,000
- Reserves months
- —
- Total cash needed
- —
Loan-product check · same deal, 3 products live
Conventional
25% down · 7.5% · 30yr
- Down + closing
- —
- Monthly P&I
- —
- Monthly cashflow
- —
- DSCR
- —
- Eligible?
- —
Personal DTI + credit; lowest rate.
DSCR
20% down · 8.5% · 30yr
- Down + closing
- —
- Monthly P&I
- —
- Monthly cashflow
- —
- DSCR
- —
- Eligible?
- —
No personal income docs; deal must DSCR.
Hard money
10% down · 12.0% · 12mo
- Down + closing
- —
- Monthly P&I
- —
- Monthly cashflow
- —
- DSCR
- —
- Eligible?
- —
Short-term bridge; refi at stabilization.
Listing history 4 events
-
2026-06-18days on market $600,000 Active 3 DOM
-
2026-06-17days on market $600,000 Active 2 DOM
-
2026-06-15remarks 565-char remark
-
2026-06-15$600,000 Active 1 DOM
ⓘ Source: listings_history table (triggers on properties + properties_extension) + one-shot
backfill from property_details.listing_events for pre-trigger history.
Tax reassessment forecast WI · Partial reset (capped growth)
- Current annual tax
- $6,651 · $554/mo
- Projected year-2 tax
- $8,875 · $740/mo
- Expected delta
- +$2,225/yr (+$185/mo · 33.4%)
ⓘ Screening estimate from a state-policy table — verify with the county assessor before closing.
Climate risk First Street
- Flood 1/10 Low FEMA zone X (unshaded) · 0% chance over 30 yrs
- Wildfire 1/10 Low
- Heat 2/10 Low 7 d/yr ≥96°F today · 13 d/yr by 30 yrs out
- Wind 2/10 Low
- Air quality 3/10 Moderate 3 unhealthy d/yr today · 4 by 30 yrs out
Nearby sold comps map
Loading sold comps map…
Walkable amenities ~0.75 mi
Loading nearby amenities…
Taxation est. · year 1
- Rental income
- $61,692
- − Mortgage interest
- −$33,609
- − Property taxes
- −$6,651
- − Insurance
- −$3,000
- − Repairs & maintenance
- −$4,935
- − Management
- −$4,935
- − Depreciation
- −$17,455
- Taxable loss
- −$8,893
- Est. tax savings @ 24.0%
- +$2,134
- After-tax cash flow
- $3,463/yr
For passive investors: Depreciation is non-cash, so a rental often shows a tax loss while cash-flowing — sheltering income. Rental losses are passive: they offset passive income freely, and up to $25,000/yr can offset ordinary (W-2) income if you actively participate and your MAGI is under $100k (phasing out to $0 by $150k); unused losses carry forward. On sale, claimed depreciation is recaptured at up to 25%, and gains may owe capital-gains tax (a 1031 exchange can defer both). Figures are a year-1 estimate at your 24.0% rate — not tax advice; consult a CPA.
Schools (NCES district)
- District
- Milwaukee School District
- NCES district ID
- 5509600
- Math proficiency
- 10% ▼ -5.00%
- Reading proficiency
- 18% ▬ 0.00%
- Median HH income
- $36,339
- Composite
- 11.61/100
- National rank
- #9696
- State rank
- #337 of 342 in WI
Livability — Milwaukee
- Score
- 81/100
- State rank
- #55
- US rank
- #1534
Category grades
Schools grade is shown separately in the Schools card above.
Census & demographics
- Census place
- Milwaukee, WI
- County
- Milwaukee County · 926,379 people
- City population
- 573,768
- Metro
- Milwaukee-Waukesha, WI
- Population (ZIP)
- 34,234
- Household income
- $75,256
- Rent vs Own
- Severe rent burden
- 2472.0
Population outlook (Milwaukee County) Hauer SSP2
- Today (2025)
- 995,758 people
- By 2030
- 1,009,124 · +1.3%
- By 2040
- 1,028,128 · +3.3%
- By 2050
- 1,040,066 · +4.4%
- By 2075
- 1,057,849 · +6.2%
- By 2100
- 1,039,774 · +4.4%
Race, ethnicity, and origin ACS 2023
- Neighborhood character
- Predominantly White (81%)
- Race & ethnicity
- White 81% Two or more races 7% Asian 5% Hispanic / Latino 5% Black 4%
- Common ancestry
- Romanian 9% Portuguese 4% Lithuanian 3%
- Foreign-born
- 8% · Canada, China, South Korea
- Languages at home
- 88% English-only · Spanish 3% Other Indo-European 3% Russian/Polish/Slavic 1%
Political lean MEDSL · Milwaukee
- 2024 margin
- Solid D (+38.5) · D 68.3% · R 29.8% · Other 1.8%
- 2008→2024 swing
- +2.7pp toward D · 2008: 35.9pp · 2024: 38.5pp
- All cycles
- 2024: D+38.5 2020: D+39.9 2016: D+37.5 2012: D+34.6 2008: D+35.9
Not yet ingested
- Civics
- —
Market trends
- HPI YoY
- ▼ -333.49%
- Current HPI
- 234.8421
- Rent YoY
- ▲ 2.55%
- Metro
- Milwaukee-Waukesha, WI
- State GDP YoY
- ▲ 2.10%
- F500 in state
- 20
Industry mix (Fortune 500 HQ in WI)
| Industry | F500 HQs | Revenue |
|---|---|---|
| Industrial Machinery | 4 | $23B |
|
||
| Industrial Technology | 2 | $36B |
|
||
| Insurance | 1 | $36B |
|
||
| Professional Services | 1 | $19B |
|
||
| Utilities | 1 | $9B |
|
||
| Consumer Goods | 1 | $3B |
|
||
Price history
+378.1% since first listed3 events — show timeline
- 2026-06-15 Listed $600,000 METROMLS
- 2024-06-27 Sold (Public Records) $360,000 Public Records
- 1995-06-01 Sold (Public Records) $125,500 Public Records
Property tax history
-2.9%/yrLatest (2024): $6,651 · +7.8% YoY. Source: county tax records.
Cash-flow waterfall
monthlySold comps — $/sqft
last 12 mo · ≤1 miLoading sold comps…