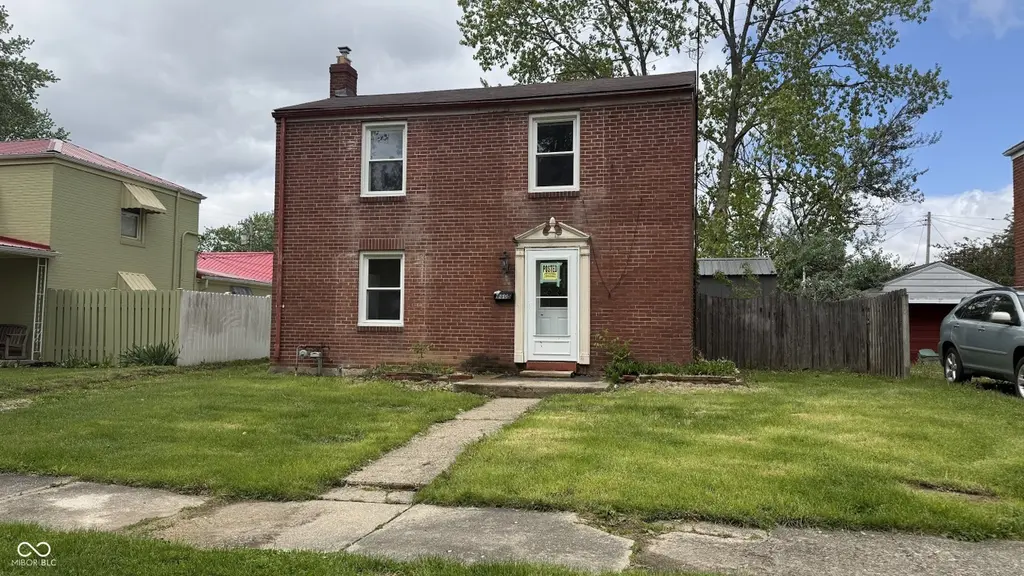
1605 Hill St · Anderson, IN
Flood risk 1/10 · Minimal
- FEMA flood zone
- X (unshaded)
- Chance of flooding over 30 yrs
- 0.0%
- Est. flood insurance / yr
- $473 – $860
Fire risk 1/10 · Minimal
- Est. fire insurance / yr
- $717 – $1,331
Heat risk 3/10 · Minor
- Hot days now (above 100°F)
- 7 days/yr
- Hot days in 30 yrs
- 18 days/yr
Wind risk 2/10 · Minimal
- Chance of severe wind over 30 yrs
- 0.0%
Air-quality risk 3/10 · Minor
- Unhealthy air days now
- 2 days/yr
- Unhealthy air days in 30 yrs
- 3 days/yr
Risk factors via First Street. Map © Google.
Why this score? — see what drove the B grade
The composite is a weighted blend of 9 inputs, each scored 0–100. Each bar is that input's sub-score; the figure is the points it added to the 100-point composite (weight × sub-score).
- Cash flow +30.0/30.0
- ARV discount +15.0/15.0
- DSCR +10.0/10.0
- 1% rule +9.8/10.0
- Rent growth +3.0/5.0
- Livability +3.0/5.0
- Condition / age +2.5/5.0
- Schools +1.6/10.0
- Appreciation +0.0/10.0
$75,900
🖨 Deal sheet 📄 Offer letter ✓ Due diligence
Listing remarks MLS
Excellent investment opportunity with this home to make it yours however you wish. This amazing opportunity is sold AS-IS.
Key facts
- 7,000 sq ft lot
- Built 1945
- Listed 45 days
Property features AI
Exterior
- Parking: No designated parking listed
- Utilities: Public water; Municipal sewer; Municipal solid waste service
- Home design: Single-family residence; Two levels
- Construction: Brick construction; Block foundation
- Exterior features: Less than 1/4 acre lot (approximately 0.16 acre)
Interior
- Kitchen: No listed built-in appliances (gas water heater noted separately)
- Bedrooms: Two upstairs bedrooms
- Bathrooms: One full bathroom (upper level)
- Heating & cooling: Forced air heating (natural gas); Window air conditioning units
- Interior features: Attic access; Unfinished basement
- Laundry & utility: Gas water heater
Neighborhood map
What this means for you Summary
Snapshot
- This is a 2-bed/1.0-bath single-family listed at $76k.
Deal economics
- At list price, monthly cash flow is $329 ($4k/yr) — positive.
- The deal already cash-flows at list — no discount required.
- Meets the 1% rule at list price ($1k rent vs $76k).
- Recommended offer: $74k (3.0% below list) — sets the bar for market timing.
- Cap rate 11.5% vs local median 6.5% in Anderson — top-decile yield for the area; either an underpriced asset or a hidden risk that comps aren't pricing in. Stress-test before assuming the spread holds.
Location & tenants
- Location reads 60/100 on livability (#521 in IN) — a middle-class / working-renter tenant base. Strengths: cost of living A+, housing A+; Watch: crime D-, amenities F, commute F.
- Anderson Community School Corporation (urban): math 15% / reading 23% proficiency, ranked #280 of 301 in IN (top 93%) — low school quality limits family demand, transient renter base, plan for 1-2y turnover; 70% free/reduced lunch — lower-income household profile, screen leases tightly.
- Zoned schools: Anderson High School (math 21% / reading 51%, grade F, #261 of 369 statewide, top 71%, 1,790 students, 76% FRL).
- Zoned-school proficiency averages 36% at this address vs 19% district-wide (+17 pts) — the actual schools serving this property are materially stronger than the Anderson Community School Corporation average implies; a family-tenant draw the district grade alone would hide.
- Market conditions: Rents rising (+1.8%/yr); 159 active listings in the ZIP; 31 comparable units currently listed for rent nearby; rentals at typical pace (median 24d on market — plan ~3-4 weeks tenant-placement turnaround); 48% of comp listings sitting > 30 days — soft ceiling on asking rent; 184 units permitted in Madison County in 2024 (0 in 5+ unit buildings).
Forward outlook
- Local home prices are declining (-3.0%/yr); year-one equity from $525 of loan paydown is wiped out by about $2k of value loss. Plan a longer hold.
- Madison County population projected at -14% by 2050 — secular population decline; favor cash flow + early exit over multi-decade hold.
- At projected returns (-3.0% appreciation + 1.8% rent growth), your $21k cash investment doubles in ~8 years — after that, you're playing with house money.
Negotiation context
- It's been on market 45 days — a 3% lower offer ($74k) is reasonable based on typical stale-listing flexibility.
- 5 sale attempts since 24y ago; this cycle's ask has dropped $4k (5%) from the opening price — seller is motivated, your offer sets the floor, not the list.
- Current owner paid $48k; list at $76k implies a 60% gain — meaningful room to come down on a strong offer.
Risks & watch-outs
- Watch-outs: built in 1945 — expect roof / HVAC / electrical / plumbing capex.
Questions for the listing agent
- It's been on market 45 days. Have you received any prior offers? Is the seller open to a 3% concession, seller financing, or rate buy-down credit?
- Built in 1945 — when were the roof, HVAC, electrical panel, plumbing, and water heater last replaced?
- Is there a deadline driving the sale (1031 exchange, divorce, estate, relocation)? That informs how much negotiation room exists.
- Schools are F-rated, which usually means shorter tenancies and higher turnover. Who's the typical renter profile here, and what's been the actual vacancy rate?
- Crime grade is D in this area — have there been break-ins, vandalism, or insurance claims at this property in the last 3 years? What carrier currently insures it and at what premium?
- What's the average days-on-market for RENTAL listings here right now (not sales)? A rising rental-DOM trend means longer vacancies and softer asking-rent achievability than the comps imply.
- What's the recent tenant-quality profile in this submarket — average credit score on applications, eviction rate, late-payment / NSF rate, and stable-employment percentage? A property-management company in the area should have these aggregated.
- How much new for-sale + rental construction is in the pipeline within 1–3 miles? Heavy new supply typically softens prices + rents 12–24 months out; constrained supply supports both.
Investment metrics
- 1% rule
- 1.48% ✓
- Cap rate
- 11.50%
- Cash-on-cash
- 18.59%
- DSCR
- 1.83
- GRM
- 5.6
CMA / ARV
- ARV (median comp)
- $112,041
- List price
- $75,900
- Delta
- -32.26%
- Verdict
- UNDERPRICED
- Comps
- 20 within 1.0 mi
Show comp detail 12 sales within ~0.75 mi
| Address | Dist | Beds/Ba | Sqft | Sold | Price | $/sf | Match |
|---|---|---|---|---|---|---|---|
| 1611 Poplar St | 0.14mi | 2/1.0 | 896 (-8%) | 5mo | $103,000 | $115 | 76 |
| 2108 Silver St | 0.49mi | 2/1.0 | 918 (-6%) | 8mo | $98,400 | $107 | 61 |
| 2018 Poplar St | 0.37mi | 3/1.0 (+1) | 1,036 (+7%) | 8mo | $100,000 | $97 | 60 |
| 2102 Crystal St | 0.42mi | 3/1.0 (+1) | 1,046 (+8%) | 4mo | $125,000 | $120 | 60 |
| 305 W Vinyard St | 0.44mi | 3/1.0 (+1) | 925 (-5%) | 12mo | $119,900 | $130 | 56 |
| 2031 Poplar St | 0.40mi | 2/1.0 | 1,024 (+5%) | 20mo | $75,000 | $73 | 56 |
| 530 Hawthorne Ave | 0.59mi | 3/1.0 (+1) | 1,008 (+4%) | 8mo | $129,000 | $128 | 54 |
| 416 Country Club Ln | 0.57mi | 2/1.0 | 850 (-13%) | 5mo | $127,500 | $150 | 49 |
| 2417 Crystal St | 0.74mi | 2/2.0 | 925 (-5%) | 12mo | $130,000 | $141 | 44 |
| 1027 Silver Ct | 0.49mi | 3/1.0 (+1) | 875 (-10%) | 16mo | $40,000 | $46 | 42 |
| 718 Hawthorne Ave | 0.67mi | 3/1.0 (+1) | 1,073 (+10%) | 6mo | $175,000 | $163 | 41 |
| 1827 Lowell Ave | 0.74mi | 3/1.0 (+1) | 1,066 (+10%) | 14mo | $145,000 | $136 | 32 |
Match score weights: distance 35% · size 25% · config 20% · recency 20%. Top-matched comps best support the ARV.
Projected returns pro-forma
-3.0% appreciation · 1.82% rent growth · sell at horizon
- IRR
- 9.0%
- Equity multiple
- 1.35×
- Total profit
- $7,386
- Equity at exit
- $11,317
- IRR
- 17.1%
- Equity multiple
- 2.33×
- Total profit
- $28,293
- Equity at exit
- $6,562
Cash invested: $21,252 (down + closing). Projections, not guarantees.
Landlord ↔ Tenant lean methodology
- Overall (STATE)
- 90 Strongly Landlord-Friendly
- State Indiana
- 90 Strongly Landlord-Friendly · R+11
- County
- — inherits STATE
- City
- — inherits STATE
ZIP-level market 46012
- Home prices YoY
- -18.6%
- Rents YoY
- 1.8%
- Active inventory
- 159
- Price-to-rent
- 5.6×
Monthly cashflow live
- Estimated rent
- $1,126 high interval (Pro) →
- Mortgage (P&I)
- −$398
- Tax from tax record
- −$131 /mo · $1,569/yr
- Insurance
- −$32
- HOA
- −$0
- Vacancy / Maint / Mgmt
- −$236
- Net cashflow
- $329
Break-even live
UW: 25.0% down · 7.5% · 30yr · 1.5% tax · 5.0% vac · 8.0% maint · 8.0% mgmt
Financing live
Cash to close
- Down payment
- $18,975
- Closing costs
- $2,277
- Reserves months
- —
- Total cash needed
- —
Loan-product check · same deal, 3 products live
Conventional
25% down · 7.5% · 30yr
- Down + closing
- —
- Monthly P&I
- —
- Monthly cashflow
- —
- DSCR
- —
- Eligible?
- —
Personal DTI + credit; lowest rate.
DSCR
20% down · 8.5% · 30yr
- Down + closing
- —
- Monthly P&I
- —
- Monthly cashflow
- —
- DSCR
- —
- Eligible?
- —
No personal income docs; deal must DSCR.
Hard money
10% down · 12.0% · 12mo
- Down + closing
- —
- Monthly P&I
- —
- Monthly cashflow
- —
- DSCR
- —
- Eligible?
- —
Short-term bridge; refi at stabilization.
Rent comps 31 comps
| Address | Beds | Baths | Sqft | Rent | $/sqft | DOM | Units | Dist |
|---|---|---|---|---|---|---|---|---|
| 1321 Lafayette Ct Anderson, IN | 3.0 | 1.5 | 962 | $1,350 | $1.40 | 10d | 1 | 0.40mi |
| 233 W School St Unit 233 Anderson, IN | 1.0 | 1.0 | 600 | $600 | $1.00 | 1d | 1 | 0.84mi |
| 235 W School St Unit 235 Anderson, IN | 3.0 | 1.0 | 925 | $1,200 | $1.30 | 43d | 1 | 0.84mi |
| 1705 Lake Shore Dr Unit 1705A Anderson, IN | 2.0 | 2.0 | 912 | $1,277 | $1.40 | 43d | 1 | 0.84mi |
| 1705 Lake Shore Dr Unit 1705E Anderson, IN | 1.0 | 1.0 | 758 | $984 | $1.30 | 23d | 1 | 0.84mi |
| 1705 Lake Shore Dr Unit 1705G Anderson, IN | 2.0 | 2.0 | 912 | $1,229 | $1.35 | 17d | 1 | 0.84mi |
| 1716 N Cross Lakes Cir Unit 1716KN Anderson, IN | 2.0 | 2.0 | 912 | $1,274 | $1.40 | 23d | 1 | 0.87mi |
| 1808 N Cross Lakes Cir Unit 1808HN Anderson, IN | 2.0 | 2.0 | 944 | $1,177 | $1.25 | 3d | 1 | 0.90mi |
| 1800 Cross Lakes Blvd Anderson, IN | 1.0–2.0 | 1.0–2.0 | 847 | $1,344 | $1.59 | 1d | 22 | 0.91mi |
| 1704 S Cross Lakes Cir Unit 1704DS Anderson, IN | 1.0 | 1.0 | 750 | $1,080 | $1.44 | 10d | 1 | 0.92mi |
| 1704 S Cross Lakes Cir Unit 1704FS Anderson, IN | 1.0 | 1.0 | 750 | $1,130 | $1.51 | 43d | 1 | 0.92mi |
| 1812 N Cross Lakes Cir Unit 1812AN Anderson, IN | 2.0 | 2.0 | 912 | $1,229 | $1.35 | 43d | 1 | 0.93mi |
| 1807 Lake Shore Dr Unit 1807K Anderson, IN | 2.0 | 2.0 | 912 | $1,344 | $1.47 | 43d | 1 | 0.93mi |
| 1815 N Cross Lakes Cir Unit 1815HN Anderson, IN | 1.0 | 1.0 | 750 | $1,130 | $1.51 | 23d | 1 | 0.93mi |
| 1708 S Cross Lakes Cir Unit 1708ES Anderson, IN | 2.0 | 2.0 | 944 | $1,115 | $1.18 | 43d | 1 | 0.93mi |
| 1805 S Cross Lakes Cir Unit 1805LS Anderson, IN | 2.0 | 2.0 | 912 | $1,294 | $1.42 | 12d | 1 | 0.95mi |
| 1804 S Cross Lakes Cir Unit 1804DS Anderson, IN | 2.0 | 2.0 | 944 | $1,144 | $1.21 | 43d | 1 | 0.97mi |
| 1812 S Cross Lakes Cir Unit 1812ES Anderson, IN | 2.0 | 2.0 | 944 | $1,115 | $1.18 | 14d | 1 | 1.01mi |
| 1908 N Cross Lakes Cir Unit 1908DN Anderson, IN | 1.0 | 1.0 | 758 | $1,020 | $1.35 | 43d | 1 | 1.01mi |
| 1912 N Cross Lakes Cir Unit 1912HN Anderson, IN | 2.0 | 2.0 | 944 | $1,174 | $1.24 | 12d | 1 | 1.02mi |
| 1916 N Cross Lakes Cir Unit 1916EN Anderson, IN | 1.0 | 1.0 | 758 | $973 | $1.28 | 43d | 1 | 1.05mi |
| 1916 N Cross Lakes Cir Unit 1916DN Anderson, IN | 1.0 | 1.0 | 758 | $1,039 | $1.37 | 14d | 1 | 1.05mi |
| 1904 S Cross Lakes Cir Unit 1904KS Anderson, IN | 2.0 | 2.0 | 912 | $1,183 | $1.30 | 43d | 1 | 1.06mi |
| 1904 S Cross Lakes Cir Unit 1904CS Anderson, IN | 1.0 | 1.0 | 750 | $1,073 | $1.43 | 43d | 1 | 1.06mi |
| 1904 S Cross Lakes Cir Unit 1904LS Anderson, IN | 2.0 | 2.0 | 912 | $1,309 | $1.44 | 43d | 1 | 1.06mi |
| 915 High St Unit 915 1/2 Anderson, IN | 1.0 | 1.0 | 600 | $650 | $1.08 | 43d | 1 | 1.22mi |
| 506 W 2nd St Anderson, IN | 3.0 | 1.0 | 964 | $1,095 | $1.14 | 23d | 1 | 1.34mi |
| 519 W 2nd St Anderson, IN | 1.0 | 1.0 | 650 | $800 | $1.23 | 43d | 1 | 1.37mi |
| 602 Meridian St Unit 608 A Anderson, IN | 1.0 | 1.0 | 650 | $750 | $1.15 | 23d | 1 | 1.49mi |
| 602 Meridian St Apt C Anderson, IN | 2.0 | 1.0 | 800 | $900 | $1.12 | 43d | 1 | 1.49mi |
| 919 E 6th St Apt 2 Anderson, IN | 1.0 | 1.0 | 700 | $625 | $0.89 | 23d | 1 | 1.50mi |
Listing history 21 events
-
2026-06-18days on market $75,900 Active 45 DOM
-
2026-06-17days on market $75,900 Active 44 DOM
-
2026-06-16days on market $75,900 Active 43 DOM
-
2026-06-15days on market $75,900 Active 42 DOM
-
2026-06-13pricedays on market $75,900 Active 40 DOM
-
2026-06-09days on market $79,900 Active 36 DOM
-
2026-06-08days on market $79,900 Active 35 DOM
-
2026-06-07days on market $79,900 Active 34 DOM
-
2026-06-05days on market $79,900 Active 31 DOM
-
2026-06-03days on market $79,900 Active 30 DOM
-
2026-06-02days on market $79,900 Active 29 DOM
-
2026-06-01days on market $79,900 Active 28 DOM
-
2026-05-31days on market $79,900 Active 27 DOM
-
2026-05-04$79,900 Active 122-char remark
-
2021-12-10soldstatus $47,500 Closed 160-char remark
Show marketing remark (160 chars)
This 2 bedroom 1 bath home is in need of tlc. It has great potential with a large lot and convenient, lightly traveled street. The home is a 2 story brick home.
-
2021-11-14status Pending 160-char remark
Show marketing remark (160 chars)
This 2 bedroom 1 bath home is in need of tlc. It has great potential with a large lot and convenient, lightly traveled street. The home is a 2 story brick home.
-
2021-11-12$49,900 Active 160-char remark
Show marketing remark (160 chars)
This 2 bedroom 1 bath home is in need of tlc. It has great potential with a large lot and convenient, lightly traveled street. The home is a 2 story brick home.
-
2004-02-27historical
-
2003-03-02$59,900
-
2002-12-23historical
-
2002-05-02$59,900
ⓘ Source: listings_history table (triggers on properties + properties_extension) + one-shot
backfill from property_details.listing_events for pre-trigger history.
Tax reassessment forecast IN · Partial reset (capped growth)
- Current annual tax
- $1,569 · $131/mo
- Projected year-2 tax
- $1,569 · $131/mo
- Expected delta
- $0/yr ($0/mo · 0.0%)
ⓘ Screening estimate from a state-policy table — verify with the county assessor before closing.
Climate risk First Street
- Flood 1/10 Low FEMA zone X (unshaded) · 0% chance over 30 yrs
- Wildfire 1/10 Low
- Heat 3/10 Moderate 7 d/yr ≥100°F today · 18 d/yr by 30 yrs out
- Wind 2/10 Low 0% chance of damaging wind over 30 yrs
- Air quality 3/10 Moderate 2 unhealthy d/yr today · 3 by 30 yrs out
Nearby sold comps map
Loading sold comps map…
Walkable amenities ~0.75 mi
Loading nearby amenities…
Taxation est. · year 1
- Rental income
- $13,513
- − Mortgage interest
- −$4,252
- − Property taxes
- −$1,569
- − Insurance
- −$380
- − Repairs & maintenance
- −$1,081
- − Management
- −$1,081
- − Depreciation
- −$2,208
- Taxable income
- $2,943
- Est. tax owed @ 24.0%
- −$706
- After-tax cash flow
- $3,244/yr
For passive investors: Depreciation is non-cash, so a rental often shows a tax loss while cash-flowing — sheltering income. Rental losses are passive: they offset passive income freely, and up to $25,000/yr can offset ordinary (W-2) income if you actively participate and your MAGI is under $100k (phasing out to $0 by $150k); unused losses carry forward. On sale, claimed depreciation is recaptured at up to 25%, and gains may owe capital-gains tax (a 1031 exchange can defer both). Figures are a year-1 estimate at your 24.0% rate — not tax advice; consult a CPA.
Schools (NCES district)
- District
- Anderson Community School Corporation
- NCES district ID
- 1800150
- Math proficiency
- 15% ▼ -14.00%
- Reading proficiency
- 23% ▼ -7.00%
- Median HH income
- $38,208
- Composite
- 15.93/100
- National rank
- #9250
- State rank
- #280 of 301 in IN
Livability — Anderson
- Score
- 60/100
- State rank
- #521
- US rank
- #18709
Category grades
Schools grade is shown separately in the Schools card above.
Census & demographics
- Census place
- Anderson, IN
- County
- Madison County · 69,445 people
- City population
- 57,762
- Metro
- Indianapolis-Carmel-Anderson, IN
- Population (ZIP)
- 20,855
- Household income
- $58,041
- Rent vs Own
- Severe rent burden
- 987.0
Population outlook (Madison County) Hauer SSP2
- Today (2025)
- 125,800 people
- By 2030
- 122,640 · -2.5%
- By 2040
- 115,420 · -8.3%
- By 2050
- 108,148 · -14.0%
- By 2075
- 91,838 · -27.0%
- By 2100
- 75,670 · -39.8%
Race, ethnicity, and origin ACS 2023
- Neighborhood character
- Predominantly White (85%)
- Race & ethnicity
- White 85% Hispanic / Latino 5% Two or more races 4% Black 4%
- Hispanic origin (detail)
- Mexican 4%
- Common ancestry
- Slovak 3% Serbian 2% Italian 1%
- Foreign-born
- 2% · Canada, Vietnam
- Languages at home
- 96% English-only · Spanish 3%
Political lean MEDSL · Madison
- 2024 margin
- Strong R (+26.9) · D 35.6% · R 62.5% · Other 1.9%
- 2008→2024 swing
- -33.5pp toward R · 2008: 6.5pp · 2024: -26.9pp
- All cycles
- 2024: R+26.9 2020: R+22.6 2016: R+25.7 2012: R+4.5 2008: D+6.5
Not yet ingested
- Civics
- —
Market trends
- HPI YoY
- ▼ -61.16%
- Current HPI
- 266.9819
- Rent YoY
- ▲ 1.82%
- Metro
- Indianapolis-Carmel-Anderson, IN
- State GDP YoY
- ▲ 2.90%
- F500 in state
- 18
Industry mix (Fortune 500 HQ in IN)
| Industry | F500 HQs | Revenue |
|---|---|---|
| Industrial Machinery | 2 | $37B |
|
||
| Healthcare | 1 | $177B |
|
||
| Pharmaceuticals | 1 | $45B |
|
||
| Metals / Steel | 1 | $18B |
|
||
| Agriculture | 1 | $17B |
|
||
| Packaging | 1 | $12B |
|
||
Price history
+26.7% since first listed11 events — show timeline
- 2026-06-11 Price Changed $75,900 IRMLS
- 2026-06-11 Price Changed $75,900 MIBOR as Distributed by MLS Grid
- 2026-05-21 Listed $79,900 IRMLS
- 2026-05-04 Listed $79,900 MIBOR as Distributed by MLS Grid
- 2021-12-10 Sold (MLS) $47,500 MIBOR as Distributed by MLS Grid
- 2021-11-14 Pending — MIBOR as Distributed by MLS Grid
- 2021-11-12 Listed $49,900 MIBOR as Distributed by MLS Grid
- 2004-02-27 Listing Removed — MIBOR as Distributed by MLS Grid
- 2003-03-02 Listed $59,900 MIBOR as Distributed by MLS Grid
- 2002-12-23 Listing Removed — MIBOR as Distributed by MLS Grid
- 2002-05-02 Listed $59,900 MIBOR as Distributed by MLS Grid
Property tax history
+4.4%/yrLatest (2024): $1,569 · +8.7% YoY. Source: county tax records.
Cash-flow waterfall
monthlySold comps — $/sqft
last 12 mo · ≤1 miLoading sold comps…