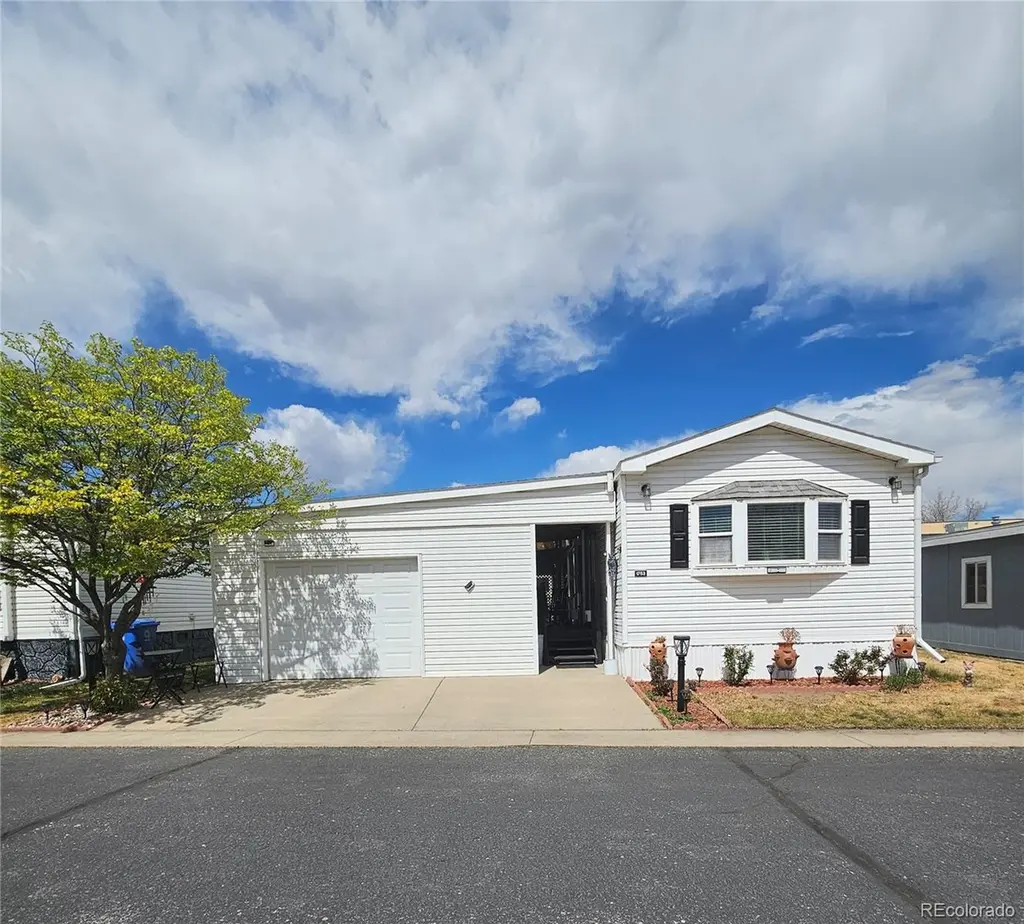
1753 Garnet St · Loveland, CO
Flood risk 1/10 · Minimal
- FEMA flood zone
- X (unshaded)
- Chance of flooding over 30 yrs
- 0.0%
- Est. flood insurance / yr
- $507 – $1,088
Fire risk 5/10 · Moderate
- Est. fire insurance / yr
- $939 – $1,743
Heat risk 3/10 · Minor
- Hot days now (above 92°F)
- 7 days/yr
- Hot days in 30 yrs
- 18 days/yr
Wind risk 1/10 · Minimal
- Chance of severe wind over 30 yrs
- —
Air-quality risk 4/10 · Minor
- Unhealthy air days now
- 6 days/yr
- Unhealthy air days in 30 yrs
- 8 days/yr
Risk factors via First Street. Map © Google.
Why this score? — see what drove the C+ grade
The composite is a weighted blend of 9 inputs, each scored 0–100. Each bar is that input's sub-score; the figure is the points it added to the 100-point composite (weight × sub-score).
- Cash flow +30.0/30.0
- 1% rule +10.0/10.0
- DSCR +10.0/10.0
- Livability +3.7/5.0
- Rent growth +3.4/5.0
- Schools +3.4/10.0
- Condition / age +2.2/5.0
- ARV discount +0.0/15.0
- Appreciation +0.0/10.0
$99,000
🖨 Deal sheet 📄 Offer letter ✓ Due diligence
Listing remarks MLS
Great sunny open floor plan, 3 bedroom, 2 bath, 2001 model, supersized shop and 2 carport. Central air conditioning, 5-piece bath, large eat-in kitchen. Prefer October closing.
Key facts
- 1,216 sq ft lot
- 2 garage spots
- Built 2001
Property features AI
Finance
- Other: Lot number 56
- HOA & community: Located in a senior community; Land lease: $1,417 monthly (lease expires May 14, 2026)
Exterior
- Parking: Attached 2-car garage
- Utilities: Electricity available; Public sewer
- Home design: Manufactured in park; Manufactured home; Agent-owned
- Construction: Frame construction
- Exterior features: Metal roof; Located in Mountain View Mobile Home Park; Land lease in place (monthly)
Interior
- Bedrooms: Three bedrooms, all on the main level
- Bathrooms: Two full bathrooms, both on the main level
- Heating & cooling: Hot water heating; Central air conditioning
- Interior features: Accessible approach with ramp; Primary suite
Neighborhood map
What this means for you Summary
Snapshot
- This is a 3-bed/2.0-bath manufactured listed at $99k. Condition is rated fair.
Deal economics
- At list price, monthly cash flow is $632 ($8k/yr) — positive.
- The deal already cash-flows at list — no discount required.
- Meets the 1% rule at list price ($2k rent vs $99k).
- Recommended offer: $93k (6.0% below list) — sets the bar for market timing.
- Cap rate 14.0% vs local median 2.9% in Loveland — top-decile yield for the area; either an underpriced asset or a hidden risk that comps aren't pricing in. Stress-test before assuming the spread holds.
Location & tenants
- Location reads 73/100 on livability (#52 in CO) — a middle-class / working-renter tenant base. Strengths: housing A+, health & safety A+, amenities A; Watch: crime C-, commute F, cost of living F.
- Thompson School District R-2J (suburban): math 28% / reading 48% proficiency, ranked #28 of 86 in CO (top 33%) — families likely to look elsewhere, expect single-tenant / working-renter base with shorter leases.
- Zoned schools: Ivy Stockwell Elementary School (math 47% / reading 57%, grade C-, #174 of 966 statewide, top 20%, 402 students, 21% FRL); Bill Reed Middle School (math 22% / reading 32%, grade F, #154 of 270 statewide, top 59%, 511 students, 45% FRL); Thompson Valley High School (math 37% / reading 62%, grade D, #115 of 381 statewide, top 34%, 1,039 students, 31% FRL) — zoned schools at 32% FRL track the district average.
- Market conditions: Rents rising (+3.6%/yr); 283 active listings in the ZIP; 21 comparable units currently listed for rent nearby; rentals at typical pace (median 24d on market — plan ~3-4 weeks tenant-placement turnaround); solid renter incomes; 1,786 units permitted in Larimer County in 2024 (402 in 5+ unit buildings).
Forward outlook
- Local home prices are declining (-3.0%/yr); year-one equity from $684 of loan paydown is wiped out by about $3k of value loss. Plan a longer hold.
- Larimer County population projected at +51% by 2050 — long-run rental-demand tailwind backs the buy-and-hold thesis.
- At projected returns (-3.0% appreciation + 3.6% rent growth), your $28k cash investment doubles in ~5 years — after that, you're playing with house money.
Negotiation context
- It's been on market 65 days — a 6% lower offer ($93k) is reasonable based on typical stale-listing flexibility.
- 2 sale attempts since 24y ago with the ask held roughly flat each time — persistent listings suggest the price (not the market) is what's stuck; bring a comps-based counter.
- Current owner paid $75k; 32% above their basis — modest negotiation headroom, anchor on the comps not their cost.
Risks & watch-outs
- Climate carrying-cost: moderate wildfire risk — expect insurance premiums to compound above CPI over the hold.
Questions for the listing agent
- It's been on market 65 days. Have you received any prior offers? Is the seller open to a 6% concession, seller financing, or rate buy-down credit?
- Have any recent inspections been done? Can we get a copy of the seller's disclosures and any deferred-maintenance estimates?
- Why hasn't it sold? Are there any deal-killer items the seller is aware of (foundation, flood, title, zoning, code violations)?
- Is there a deadline driving the sale (1031 exchange, divorce, estate, relocation)? That informs how much negotiation room exists.
- What's the average days-on-market for RENTAL listings here right now (not sales)? A rising rental-DOM trend means longer vacancies and softer asking-rent achievability than the comps imply.
- What's the recent tenant-quality profile in this submarket — average credit score on applications, eviction rate, late-payment / NSF rate, and stable-employment percentage? A property-management company in the area should have these aggregated.
- How much new for-sale + rental construction is in the pipeline within 1–3 miles? Heavy new supply typically softens prices + rents 12–24 months out; constrained supply supports both.
Investment metrics
- 1% rule
- 1.68% ✓
- Cap rate
- 13.96%
- Cash-on-cash
- 27.38%
- DSCR
- 2.22
- GRM
- 5.0
CMA / ARV
- ARV (on-the-fly)
- $66,880
- Comps found
- 12
Show comp detail 12 sales within ~0.75 mi
| Address | Dist | Beds/Ba | Sqft | Sold | Price | $/sf | Match |
|---|---|---|---|---|---|---|---|
| 1641 Garnet St #49 | 0.07mi | 3/2.0 | 1,216 (0%) | 6mo | $38,000 | $31 | 92 |
| 1829 Sandstone Ct #77 | 0.06mi | 3/2.0 | 1,296 (+7%) | 0mo | $71,900 | $55 | 86 |
| 1516 Sunset Pl #30 | 0.21mi | 3/2.0 | 1,216 (0%) | 9mo | $12,000 | $10 | 82 |
| 1166 Madison Ave #244 | 0.30mi | 3/2.0 | 1,232 (+1%) | 4mo | $55,000 | $45 | 81 |
| 1759 Jade Dr #146 | 0.08mi | 3/2.0 | 1,296 (+7%) | 8mo | $60,000 | $46 | 78 |
| 1757 Sandstone Dr #132 | 0.04mi | 3/2.0 | 1,344 (+10%) | 10mo | $95,000 | $71 | 73 |
| 1166 Madison Ave #136 | 0.30mi | 3/2.0 | 1,296 (+7%) | 4mo | $48,000 | $37 | 72 |
| 1375 Sunset Pl #10 | 0.21mi | 2/2.0 (-1) | 1,148 (-6%) | 8mo | $87,500 | $76 | 69 |
| 1166 Madison Ave #183 | 0.30mi | 2/2.0 (-1) | 1,248 (+3%) | 12mo | $75,000 | $60 | 66 |
| 1166 Madison Ave #246 | 0.30mi | 3/2.0 | 1,080 (-11%) | 2mo | $85,000 | $79 | 66 |
| 1500 Sylmar Pl #701 | 0.21mi | 3/2.0 | 1,064 (-12%) | 6mo | $34,000 | $32 | 64 |
| 1166 Madison Ave #203 | 0.30mi | 2/1.5 (-1) | 1,072 (-12%) | 7mo | $72,500 | $68 | 54 |
Match score weights: distance 35% · size 25% · config 20% · recency 20%. Top-matched comps best support the ARV.
Projected returns pro-forma
-3.0% appreciation · 3.57% rent growth · sell at horizon
- IRR
- 22.1%
- Equity multiple
- 1.91×
- Total profit
- $25,228
- Equity at exit
- $14,761
- IRR
- 30.5%
- Equity multiple
- 3.81×
- Total profit
- $77,932
- Equity at exit
- $8,560
Cash invested: $27,720 (down + closing). Projections, not guarantees.
Landlord ↔ Tenant lean methodology
- Overall (STATE)
- 38 Tenant-Leaning
- State Colorado
- 38 Tenant-Leaning · D+4
- County
- — inherits STATE
- City
- — inherits STATE
ZIP-level market 80537
- Rents YoY
- 3.6%
- Active inventory
- 283
- Price-to-rent
- 5.0×
Monthly cashflow live
- Estimated rent
- $1,667 high interval (Pro) →
- Mortgage (P&I)
- −$519
- Tax est. 1.5%
- −$124 /mo · $1,485/yr
- Insurance
- −$41
- HOA
- −$0
- Vacancy / Maint / Mgmt
- −$350
- Net cashflow
- $632
Break-even live
UW: 25.0% down · 7.5% · 30yr · 1.5% tax · 5.0% vac · 8.0% maint · 8.0% mgmt
Financing live
Cash to close
- Down payment
- $24,750
- Closing costs
- $2,970
- Reserves months
- —
- Total cash needed
- —
Loan-product check · same deal, 3 products live
Conventional
25% down · 7.5% · 30yr
- Down + closing
- —
- Monthly P&I
- —
- Monthly cashflow
- —
- DSCR
- —
- Eligible?
- —
Personal DTI + credit; lowest rate.
DSCR
20% down · 8.5% · 30yr
- Down + closing
- —
- Monthly P&I
- —
- Monthly cashflow
- —
- DSCR
- —
- Eligible?
- —
No personal income docs; deal must DSCR.
Hard money
10% down · 12.0% · 12mo
- Down + closing
- —
- Monthly P&I
- —
- Monthly cashflow
- —
- DSCR
- —
- Eligible?
- —
Short-term bridge; refi at stabilization.
Rent comps 21 comps
| Address | Beds | Baths | Sqft | Rent | $/sqft | DOM | Units | Dist |
|---|---|---|---|---|---|---|---|---|
| 1710 E 16th St Loveland, CO | 2.0 | 1.5 | 900 | $1,427 | $1.59 | 23d | 1 | 0.22mi |
| 1706 E 16th St Unit 1710 Loveland, CO | 2.0 | 1.5 | 900 | $1,250 | $1.39 | 23d | 1 | 0.23mi |
| 1707 E 16th St Unit 1717 Loveland, CO | 2.0 | 1.5 | 825 | $1,295 | $1.57 | 13d | 1 | 0.25mi |
| 1840 E 17th St Unit 1840 Loveland, CO | 3.0 | 1.0 | 1000 | $1,345 | $1.34 | 13d | 1 | 0.29mi |
| 1707 Cheyenne Ave Unit 8 Loveland, CO | 2.0 | 1.0 | 820 | $1,245 | $1.52 | 23d | 1 | 0.32mi |
| 1640 Cheyenne Ave Loveland, CO | 2.0 | 1.0 | 900 | $1,900 | $2.11 | 23d | 1 | 0.32mi |
| 1302 Nickel Dr Unit 1 Loveland, CO | 3.0 | 1.0 | 950 | $1,300 | $1.37 | 23d | 1 | 0.34mi |
| 734 Madison Ave Loveland, CO | 3.0 | 1.0 | 1200 | $1,800 | $1.50 | 13d | 1 | 0.57mi |
| 1494 E 5th St Loveland, CO | 2.0 | 1.0 | 800 | $1,525 | $1.91 | 23d | 1 | 0.69mi |
| 1292 E 6th St Loveland, CO | 1.0–3.0 | 1.0–1.5 | 845 | $1,991 | $2.36 | 13d | 1 | 0.73mi |
| 1143 E 5th St Loveland, CO | 2.0 | 1.0 | 760 | $1,250 | $1.64 | 23d | 1 | 0.81mi |
| 1145 E 5th St Loveland, CO | 2.0 | 1.0 | 760 | $1,250 | $1.64 | 23d | 1 | 0.81mi |
| 1054 E 5th St Loveland, CO | 3.0 | 1.0 | 1090 | $1,700 | $1.56 | 13d | 1 | 0.92mi |
| 2900 Mountain Lion Dr Loveland, CO | 3.0 | 1.0–2.0 | 936 | $2,360 | $2.52 | 13d | 17 | 0.97mi |
| 1325 N Jefferson Ave Loveland, CO | 2.0 | 1.0 | 850 | $1,545 | $1.82 | 23d | 1 | 1.06mi |
| 574 E 23rd St Loveland, CO | 2.0 | 1.0 | 956 | $1,250 | $1.31 | 23d | 5 | 1.15mi |
| 1116 Cleveland Ave Loveland, CO | 2.0 | 1.0 | 1338 | $1,345 | $1.01 | 23d | 1 | 1.18mi |
| 325 E 5th St Loveland, CO | 3.0 | 1.0–2.0 | 1188 | $2,335 | $1.97 | 13d | 1 | 1.26mi |
| 585 N Lincoln Ave Loveland, CO | 1.0–2.0 | 1.0–2.0 | 747 | $1,750 | $2.34 | 23d | 3 | 1.29mi |
| 247 W 10th St Loveland, CO | 2.0 | 2.0 | 865 | $2,500 | $2.89 | 21d | 1 | 1.42mi |
| 246 N Cleveland Ave Loveland, CO | 3.0 | 1.0–2.0 | 1022 | $3,102 | $3.03 | 13d | 11 | 1.43mi |
Listing history 18 events
-
2026-06-18days on market $99,000 Active 65 DOM
-
2026-06-17days on market $99,000 Active 64 DOM
-
2026-06-16days on market $99,000 Active 63 DOM
-
2026-06-15days on market $99,000 Active 62 DOM
-
2026-06-14days on market $99,000 Active 60 DOM
-
2026-06-13days on market $99,000 Active 59 DOM
-
2026-06-10days on market $99,000 Active 57 DOM
-
2026-06-09days on market $99,000 Active 56 DOM
-
2026-06-08days on market $99,000 Active 55 DOM
-
2026-06-07days on market $99,000 Active 54 DOM
-
2026-06-03days on market $99,000 Active 50 DOM
-
2026-06-02days on market $99,000 Active 49 DOM
-
2026-06-01days on market $99,000 Active 48 DOM
-
2026-05-31days on market $99,000 Active 47 DOM
-
2026-05-30days on market $99,000 Active 46 DOM
-
2026-04-14$99,000 Active
-
2002-08-30soldstatus $75,000 178-char remark
Show marketing remark (178 chars)
Great sunny open floor plan, 3 bedroom, 2 bath, 2001 model, supersized shop and 2 carport. Central air conditioning, 5-piece bath, large eat-in kitchen. Prefer October closing.
-
2002-07-14$75,900 178-char remark
Show marketing remark (178 chars)
Great sunny open floor plan, 3 bedroom, 2 bath, 2001 model, supersized shop and 2 carport. Central air conditioning, 5-piece bath, large eat-in kitchen. Prefer October closing.
ⓘ Source: listings_history table (triggers on properties + properties_extension) + one-shot
backfill from property_details.listing_events for pre-trigger history.
Climate risk First Street
- Flood 1/10 Low FEMA zone X (unshaded) · 0% chance over 30 yrs
- Wildfire 5/10 Major
- Heat 3/10 Moderate 7 d/yr ≥92°F today · 18 d/yr by 30 yrs out
- Wind 1/10 Low
- Air quality 4/10 Moderate 6 unhealthy d/yr today · 8 by 30 yrs out
Nearby sold comps map
Loading sold comps map…
Walkable amenities ~0.75 mi
Loading nearby amenities…
Taxation est. · year 1
- Rental income
- $20,000
- − Mortgage interest
- −$5,546
- − Property taxes
- −$1,485
- − Insurance
- −$495
- − Repairs & maintenance
- −$1,600
- − Management
- −$1,600
- − Depreciation
- −$2,880
- Taxable income
- $6,394
- Est. tax owed @ 24.0%
- −$1,535
- After-tax cash flow
- $6,055/yr
For passive investors: Depreciation is non-cash, so a rental often shows a tax loss while cash-flowing — sheltering income. Rental losses are passive: they offset passive income freely, and up to $25,000/yr can offset ordinary (W-2) income if you actively participate and your MAGI is under $100k (phasing out to $0 by $150k); unused losses carry forward. On sale, claimed depreciation is recaptured at up to 25%, and gains may owe capital-gains tax (a 1031 exchange can defer both). Figures are a year-1 estimate at your 24.0% rate — not tax advice; consult a CPA.
Condition & rehab AI · 12 photos
This manufactured home requires moderate repairs and updates to improve its condition and value. The kitchen and bathroom need significant updates, while the exterior and landscaping could benefit from some attention.
Repairs flagged
- Moderate kitchen cabinets — dated and in need of replacement
- Moderate bathroom fixtures — dated and in need of replacement
- Minor paint — peeling paint on interior walls
Value-add opportunities
- Resale update kitchen cabinets and appliances — modernizing the kitchen would attract more buyers
- Resale replace bathroom fixtures — modernizing the bathroom would attract more buyers
- Resale paint interior walls — fresh paint would improve the home's appearance
- Both landscape and maintain exterior — improved curb appeal would attract more buyers and renters
Renovation cost estimate screening
| Repair item | Severity | Est. cost |
|---|---|---|
| kitchen cabinets · dated and in need of replacement | Moderate | $3,000–15,000 |
| bathroom fixtures · dated and in need of replacement | Moderate | $3,000–15,000 |
| paint · peeling paint on interior walls | Minor | $500–3,000 |
| Total estimated repair cost · 3 items | $6,500–33,000 |
Value-add ROI direction
- Resale update kitchen cabinets and appliances — modernizing the kitchen would attract more buyers ↑
- Resale replace bathroom fixtures — modernizing the bathroom would attract more buyers ↑
- Resale paint interior walls — fresh paint would improve the home's appearance ↑
- Both landscape and maintain exterior — improved curb appeal would attract more buyers and renters ↑
ⓘ Cost ranges are severity-bucket heuristics (US national rule-of-thumb). Get contractor quotes + a written scope before underwriting a rehab budget.
Schools (NCES district)
- District
- Thompson School District R-2J
- NCES district ID
- 0805400
- Math proficiency
- 28% ▼ -7.00%
- Reading proficiency
- 48% ▬ 0.00%
- Median HH income
- $63,040
- Composite
- 34.01/100
- National rank
- #5313
- State rank
- #28 of 86 in CO
Livability — Loveland
- Score
- 73/100
- State rank
- #52
- US rank
- #5353
Category grades
Schools grade is shown separately in the Schools card above.
Census & demographics
- Census place
- Loveland, CO
- County
- Larimer County · 338,255 people
- City population
- 94,535
- Metro
- Fort Collins, CO
- Population (ZIP)
- 44,425
- Household income
- $86,325
- Rent vs Own
- Severe rent burden
- 1703.0
Population outlook (Larimer County) Hauer SSP2
- Today (2025)
- 415,361 people
- By 2030
- 457,762 · +10.2%
- By 2040
- 542,310 · +30.6%
- By 2050
- 627,048 · +51.0%
- By 2075
- 833,722 · +100.7%
- By 2100
- 952,590 · +129.3%
Race, ethnicity, and origin ACS 2023
- Neighborhood character
- Predominantly White (83%)
- Race & ethnicity
- White 83% Hispanic / Latino 12% Two or more races 8%
- Hispanic origin (detail)
- Mexican 10%
- Common ancestry
- Slovak 4% Italian 3% Lithuanian 3%
- Foreign-born
- 3% · Canada
- Languages at home
- 95% English-only · Spanish 4%
Political lean MEDSL · Larimer
- 2024 margin
- D (+17.6) · D 57.4% · R 39.8% · Other 2.9%
- 2008→2024 swing
- +7.9pp toward D · 2008: 9.7pp · 2024: 17.6pp
- All cycles
- 2024: D+17.6 2020: D+15.4 2016: D+4.9 2012: D+5.2 2008: D+9.7
Not yet ingested
- Civics
- —
Market trends
- HPI YoY
- ▼ -606.26%
- Current HPI
- 253.4939
- Rent YoY
- ▲ 3.57%
- Metro
- Fort Collins, CO
- State GDP YoY
- ▲ 1.95%
- F500 in state
- 14
Industry mix (Fortune 500 HQ in CO)
| Industry | F500 HQs | Revenue |
|---|---|---|
| Technology Distribution | 1 | $31B |
|
||
| Food / Agriculture | 1 | $18B |
|
||
| Packaging | 1 | $14B |
|
||
| Healthcare | 1 | $13B |
|
||
| Energy | 1 | $10B |
|
||
| Technology | 1 | $4B |
|
||
Price history
+30.4% since first listed3 events — show timeline
- 2026-04-14 Listed $99,000 REColorado as Distributed by MLS Grid
- 2002-08-30 Sold (MLS) $75,000 IRES
- 2002-07-14 Listed $75,900 IRES
Cash-flow waterfall
monthlySold comps — $/sqft
last 12 mo · ≤1 miLoading sold comps…