9714 Bay View Dr · Live Oak, TX
Flood risk 1/10 · Minimal
- FEMA flood zone
- X (unshaded)
- Chance of flooding over 30 yrs
- 0.0%
- Est. flood insurance / yr
- $507 – $1,088
Fire risk 1/10 · Minimal
- Est. fire insurance / yr
- $1,222 – $2,270
Heat risk 8/10 · Major
- Hot days now (above 107°F)
- 6 days/yr
- Hot days in 30 yrs
- 18 days/yr
Wind risk 8/10 · Major
- Chance of severe wind over 30 yrs
- 80.0%
Air-quality risk 2/10 · Minimal
- Unhealthy air days now
- 0 days/yr
- Unhealthy air days in 30 yrs
- 1 days/yr
Risk factors via First Street. Map © Google.
Why this score? — see what drove the D grade
The composite is a weighted blend of 9 inputs, each scored 0–100. Each bar is that input's sub-score; the figure is the points it added to the 100-point composite (weight × sub-score).
- ARV discount +13.7/15.0
- Cash flow +11.3/30.0
- Livability +3.7/5.0
- 1% rule +3.6/10.0
- DSCR +3.3/10.0
- Condition / age +2.5/5.0
- Schools +2.4/10.0
- Rent growth +2.2/5.0
- Appreciation +0.0/10.0
$189,000
🖨 Deal sheet (PDF) 📄 Offer letter ✓ Due diligence
Listing remarks MLS
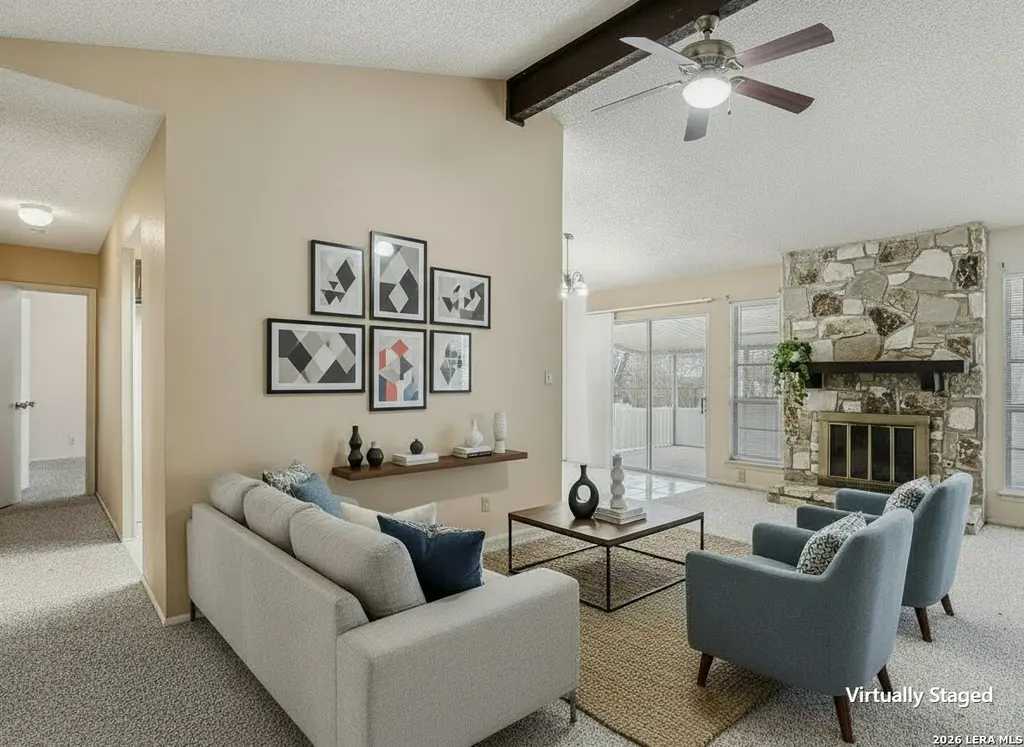
Price reduced! With a brand-new foundation and a transferable warranty for extra peace of mind, this home is a great opportunity to make your own. It just needs a few cosmetic updates. The smart layout includes split bedrooms for privacy, a covered patio ideal for relaxing, and a spacious backyard perfect for outdoor fun. While the interior could use fresh paint and some updates, it's a blank canvas ready for your style and vision. Schedule a showing today and bring your best offer.
Key facts
- Roomy backyard
- Nine years old roof
- Covered patio
Tags
Neighborhood map
What this means for you Summary
Snapshot
- This is a 3-bed/2.0-bath single-family listed at $189k.
Deal economics
- At list price, monthly cash flow is $-71 ($-849/yr) — negative.
- To cash-flow at today's rent, offer at most $177k (6.6% below list).
- To meet the 1% rule (rent ≥ 1% of price), the offer needs to be $163k (14.0% below list).
- Recommended offer: $163k (14.0% below list) — sets the bar for 1% rule.
- Cap rate 5.8% vs local median 3.7% in Live Oak — top-decile yield for the area; either an underpriced asset or a hidden risk that comps aren't pricing in. Stress-test before assuming the spread holds.
Location & tenants
- Location reads 73/100 on livability (#211 in TX) — a middle-class / working-renter tenant base. Strengths: cost of living A+, housing A+; Watch: health & safety D+, amenities F, commute F.
- Judson ISD (suburban): math 21% / reading 33% proficiency, ranked #660 of 826 in TX (top 80%) — low school quality limits family demand, transient renter base, plan for 1-2y turnover.
- Zoned schools: Miller Point El (math 26% / reading 41%, grade F, #2,174 of 4,322 statewide, top 51%, 606 students, 79% FRL); Judson Middle (math 21% / reading 34%, grade F, #1,156 of 1,662 statewide, top 71%, 1,259 students, 70% FRL); Judson H S (math 19% / reading 38%, grade F, #1,157 of 1,632 statewide, top 72%, 2,666 students, 62% FRL).
- Market conditions: Rents soft (-1.1%/yr); 212 active listings in the ZIP; 40 comparable units currently listed for rent nearby; rentals leasing fast (median 13d on market — plan ~1-2 weeks tenant-placement turnaround); 8,308 units permitted in Bexar County in 2024 (2,506 in 5+ unit buildings).
Forward outlook
- Local home prices are declining (-3.0%/yr); year-one equity from $1k of loan paydown is wiped out by about $6k of value loss. Plan a longer hold.
- Bexar County population projected at +50% by 2050 — long-run rental-demand tailwind backs the buy-and-hold thesis.
Negotiation context
- It's been on market 123 days — a 12% lower offer ($166k) is reasonable based on typical stale-listing flexibility.
Risks & watch-outs
- Climate carrying-cost: severe wind risk, 80% chance of damaging wind over 30y; extreme-heat days projected 6→18/yr by 2055 (HVAC capex compounding) — expect insurance premiums to compound above CPI over the hold.
Questions for the listing agent
- What do current leases actually rent for vs. the listed asking? Can we see a recent rent roll and the last 12 months of T-12 income?
- It's been on market 123 days. Have you received any prior offers? Is the seller open to a 14% concession, seller financing, or rate buy-down credit?
- Built in 1978 — when were the roof, HVAC, electrical panel, plumbing, and water heater last replaced?
- Why hasn't it sold? Are there any deal-killer items the seller is aware of (foundation, flood, title, zoning, code violations)?
- Is there a deadline driving the sale (1031 exchange, divorce, estate, relocation)? That informs how much negotiation room exists.
- Schools are A-rated — typically a magnet for longer-tenancy family renters. What's the average tenant stay here, and is there a school-zone premium baked into asking?
- The area grade is low — what's the realistic commute time and amenity access for the typical tenant pool here? Any planned neighborhood developments (good or bad) we should know about?
- What's the average days-on-market for RENTAL listings here right now (not sales)? A rising rental-DOM trend means longer vacancies and softer asking-rent achievability than the comps imply.
- What's the recent tenant-quality profile in this submarket — average credit score on applications, eviction rate, late-payment / NSF rate, and stable-employment percentage? A property-management company in the area should have these aggregated.
- How much new for-sale + rental construction is in the pipeline within 1–3 miles? Heavy new supply typically softens prices + rents 12–24 months out; constrained supply supports both.
Investment metrics
- 1% rule
- 0.86% ✗
- Cap rate
- 5.84%
- Cash-on-cash
- -1.60%
- DSCR
- 0.93
- GRM
- 9.7
CMA / ARV
- ARV (median comp)
- $219,252
- List price
- $189,000
- Delta
- -13.80%
- Verdict
- UNDERPRICED
- Comps
- 20 within 1.0 mi
Show comp detail 12 sales within ~0.75 mi
| Address | Dist | Beds/Ba | Sqft | Sold | Price | $/sf | Match |
|---|---|---|---|---|---|---|---|
| 6747 Sunlit Pass | 0.08mi | 3/2.0 | 1,386 (+2%) | 3mo | $209,000 | $151 | 91 |
| 6747 Mesa Glade | 0.09mi | 3/2.0 | 1,386 (+2%) | 14mo | $217,000 | $157 | 81 |
| 9511 New World | 0.20mi | 3/2.0 | 1,256 (-8%) | 5mo | $195,000 | $155 | 74 |
| 6514 Ithaca Fls | 0.58mi | 3/2.0 | 1,383 (+2%) | 4mo | $264,900 | $192 | 67 |
| 9713 Sandy Ridge Way | 0.43mi | 3/2.0 | 1,234 (-9%) | 2mo | $225,000 | $182 | 63 |
| 9934 Hawk Vlg | 0.63mi | 3/2.0 | 1,311 (-4%) | 2mo | $218,000 | $166 | 63 |
| 6430 Ithaca Fls | 0.58mi | 3/2.0 | 1,520 (+12%) | 1mo | $170,000 | $112 | 52 |
| 10274 King Robert | 0.54mi | 3/2.0 | 1,522 (+12%) | 3mo | $345,125 | $227 | 52 |
| 6411 Prince Howard | 0.53mi | 3/2.0 | 1,522 (+12%) | 6mo | $322,990 | $212 | 51 |
| 7115 Whittney | 0.66mi | 3/2.0 | 1,209 (-11%) | 10mo | $217,000 | $179 | 42 |
| 7107 Comanche Ridge Dr | 0.71mi | 3/2.0 | 1,438 (+6%) | 19mo | $210,000 | $146 | 41 |
| 6815 Buckley | 0.75mi | 3/2.0 | 1,522 (+12%) | 6mo | $130,000 | $85 | 40 |
Match score weights: distance 35% · size 25% · config 20% · recency 20%. Top-matched comps best support the ARV.
Projected returns pro-forma
-3.0% appreciation · 0.0% rent growth · sell at horizon
- IRR
- -22.5%
- Equity multiple
- 0.25×
- Total profit
- $-39,841
- Equity at exit
- $28,181
- IRR
- -27.3%
- Equity multiple
- -0.11×
- Total profit
- $-58,682
- Equity at exit
- $16,341
Cash invested: $52,920 (down + closing). Projections, not guarantees.
Landlord ↔ Tenant lean methodology
- Overall (STATE)
- 87 Strongly Landlord-Friendly
- State Texas
- 87 Strongly Landlord-Friendly · R+5
- County
- — inherits STATE
- City
- — inherits STATE
ZIP-level market 78239
- Home prices YoY
- -5.9%
- Rents YoY
- -1.1%
- Active inventory
- 212
- Price-to-rent
- 9.7×
Monthly cashflow live
- Estimated rent
- $1,625 high interval (Pro) →
- Mortgage (P&I)
- −$991
- Tax from tax record
- −$285 /mo · $3,418/yr
- Insurance
- −$79
- HOA
- −$0
- Vacancy / Maint / Mgmt
- −$341
- Net cashflow
- $-71
Break-even live
Sensitivity live
| Price | -10% $36 | -5% $-17 | +0% $-71 | +5% $-124 | +10% $-178 |
|---|---|---|---|---|---|
| Rent | -10% $-199 | -5% $-135 | +0% $-71 | +5% $-7 | +10% $58 |
| Rate | -1.0pp $24 | -0.5pp $-23 | base $-71 | +0.5pp $-120 | +1.0pp $-170 |
UW: 25.0% down · 7.5% · 30yr · 1.5% tax · 5.0% vac · 8.0% maint · 8.0% mgmt
Financing live
Cash to close
- Down payment
- $47,250
- Closing costs
- $5,670
- Reserves months
- —
- Total cash needed
- —
Loan-product check · same deal, 3 products live
Conventional
25% down · 7.5% · 30yr
- Down + closing
- —
- Monthly P&I
- —
- Monthly cashflow
- —
- DSCR
- —
- Eligible?
- —
Personal DTI + credit; lowest rate.
DSCR
20% down · 8.5% · 30yr
- Down + closing
- —
- Monthly P&I
- —
- Monthly cashflow
- —
- DSCR
- —
- Eligible?
- —
No personal income docs; deal must DSCR.
Hard money
10% down · 12.0% · 12mo
- Down + closing
- —
- Monthly P&I
- —
- Monthly cashflow
- —
- DSCR
- —
- Eligible?
- —
Short-term bridge; refi at stabilization.
Rent comps 40 comps
| Address | Beds | Baths | Sqft | Rent | $/sqft | DOM | Units | Dist |
|---|---|---|---|---|---|---|---|---|
| 9410 Fulwood Trl San Antonio, TX | 3.0 | 2.0 | 1210 | $1,425 | $1.18 | 24d | 1 | 0.16mi |
| 9711 Arcade Rdg San Antonio, TX | 3.0 | 2.0 | 1210 | $1,299 | $1.07 | 46d | 1 | 0.24mi |
| 6635 Barton Rock Rd San Antonio, TX | 3.0 | 2.0 | 1386 | $1,600 | $1.15 | 0d | 1 | 0.26mi |
| 6811 Evercrest Ln San Antonio, TX | 3.0 | 2.5 | 1582 | $2,100 | $1.33 | 26d | 1 | 0.39mi |
| 9535 Apple Ridge Ln San Antonio, TX | 3.0 | 2.0 | 1602 | $1,638 | $1.02 | 5d | 1 | 0.48mi |
| 6918 Crestway Rd Unit 2 San Antonio, TX | 3.0 | 2.5 | 1225 | $1,395 | $1.14 | 0d | 1 | 0.49mi |
| 6918 Crestway Rd Unit 4 San Antonio, TX | 3.0 | 2.5 | 1261 | $1,420 | $1.13 | 0d | 1 | 0.49mi |
| 9527 Apple Ridge Ln San Antonio, TX | 3.0 | 2.0 | 1602 | $1,575 | $0.98 | 0d | 1 | 0.49mi |
| 6607 Shadden Oaks San Antonio, TX | 3.0 | 2.0 | 1525 | $1,800 | $1.18 | 26d | 1 | 0.49mi |
| 6926 Crestway Rd San Antonio, TX | 3.0 | 2.5 | 1325 | $1,345 | $1.02 | 46d | 1 | 0.51mi |
| 6934 Crestway Rd #2 San Antonio, TX | 3.0 | 2.5 | 1225 | $1,395 | $1.14 | 0d | 1 | 0.53mi |
| 8818 Bridington San Antonio, TX | 3.0 | 2.0 | 1814 | $2,100 | $1.16 | 16d | 1 | 0.55mi |
| 9426 Apple Ridge Ln San Antonio, TX | 3.0 | 2.5 | 1225 | $1,350 | $1.10 | 46d | 1 | 0.55mi |
| 9426 Apple Ridge Ln San Antonio, TX | 3.0 | 2.5 | 1225 | $1,495 | $1.22 | 12d | 1 | 0.55mi |
| 9426 Apple Ridge Ln Unit 303 San Antonio, TX | 3.0 | 2.5 | 1231 | $1,400 | $1.14 | 46d | 1 | 0.55mi |
| 9426 Apple Ridge Ln Unit 104 San Antonio, TX | 3.0 | 2.5 | 1225 | $1,495 | $1.22 | 10d | 1 | 0.57mi |
| 7239 Converse Ridge Ln Unit 703 Windcrest, TX | 3.0 | 2.5 | 1225 | $1,500 | $1.22 | 26d | 1 | 0.57mi |
| 7239 Converse Ridge Ln Unit 603 Windcrest, TX | 3.0 | 2.5 | 1225 | $1,450 | $1.18 | 14d | 1 | 0.57mi |
| 7110 Ridge Port Dr Converse, TX | 3.0 | 2.0 | 1589 | $1,600 | $1.01 | 14d | 1 | 0.60mi |
| 6406 Ithaca Fls San Antonio, TX | 3.0 | 2.5 | 1508 | $1,500 | $0.99 | 13d | 1 | 0.61mi |
| 9426 Apple Ridge Ln Unit 503 San Antonio, TX | 3.0 | 2.5 | 1225 | $1,600 | $1.31 | 17d | 1 | 0.61mi |
| 9426 Apple Ridge Ln Unit 503 San Antonio, TX | 3.0 | 2.5 | 1225 | $1,395 | $1.14 | 6d | 1 | 0.61mi |
| 6427 Ithaca Fls San Antonio, TX | 3.0 | 2.0 | 1314 | $1,595 | $1.21 | 26d | 1 | 0.63mi |
| 6427 Ithaca Fls San Antonio, TX | 3.0 | 2.0 | 1315 | $1,595 | $1.21 | 10d | 1 | 0.63mi |
| 6527 Ithaca Fls San Antonio, TX | 3.0 | 2.5 | 1528 | $1,850 | $1.21 | 6d | 1 | 0.63mi |
| 6527 Ithaca Fls San Antonio, TX | 3.0 | 2.5 | 1528 | $1,850 | $1.21 | 0d | 1 | 0.63mi |
| 9034 Glen Shadow Dr Unit 38 San Antonio, TX | 3.0 | 2.5 | 1225 | $1,645 | $1.34 | 0d | 1 | 0.64mi |
| 9034 Glen Shadow Dr Unit 34 San Antonio, TX | 3.0 | 2.5 | 1225 | $1,645 | $1.34 | 26d | 1 | 0.64mi |
| 9034 Glen Shadow Dr Unit 27 San Antonio, TX | 3.0 | 2.5 | 1225 | $1,550 | $1.27 | 6d | 1 | 0.64mi |
| 9034 Glen Shadow Dr Unit 25 San Antonio, TX | 3.0 | 2.5 | 1225 | $1,500 | $1.22 | 0d | 1 | 0.64mi |
| 9034 Glen Shadow Dr Unit 13 San Antonio, TX | 3.0 | 2.5 | 1225 | $1,645 | $1.34 | 46d | 1 | 0.64mi |
| 9034 Glen Shadow Dr Unit 27 San Antonio, TX | 3.0 | 2.5 | 1225 | $1,550 | $1.27 | 0d | 1 | 0.64mi |
| 7106 Comanche Rdg Converse, TX | 3.0 | 2.0 | 1592 | $1,750 | $1.10 | 26d | 1 | 0.65mi |
| 7347 Kitty Hawk Rd Converse, TX | 1.0–4.0 | 1.0–2.0 | 990 | $1,604 | $1.62 | 6d | 1 | 0.65mi |
| 10527 Sonora Sunset San Antonio, TX | 3.0 | 2.5 | 1582 | $1,599 | $1.01 | 10d | 1 | 0.66mi |
| 10527 Sonora Sunset San Antonio, TX | 3.0 | 2.5 | 1582 | $1,599 | $1.01 | 22d | 1 | 0.66mi |
| 6503 Ithaca Frst San Antonio, TX | 3.0 | 2.0 | 1630 | $1,695 | $1.04 | 46d | 1 | 0.68mi |
| 7461 Kitty Hawk Rd Converse, TX | 1.0–3.0 | 1.0–2.0 | 873 | $1,788 | $2.05 | 0d | 27 | 0.70mi |
| 6923 Glen Fair San Antonio, TX | 4.0 | 2.5 | 1632 | $1,725 | $1.06 | 10d | 1 | 0.76mi |
| 9034 (15/16) Glen Shadow Dr San Antonio, TX | 3.0 | 2.5 | 1225 | $1,572 | $1.28 | 0d | 8 | 0.79mi |
Listing history 19 events
-
2026-06-22days on market $189,000 Active 123 DOM
-
2026-06-21days on market $189,000 Active 122 DOM
-
2026-06-18days on market $189,000 Active 119 DOM
-
2026-06-17days on market $189,000 Active 118 DOM
-
2026-06-16days on market $189,000 Active 117 DOM
-
2026-06-15days on market $189,000 Active 116 DOM
-
2026-06-13days on market $189,000 Active 114 DOM
-
2026-06-09days on market $189,000 Active 110 DOM
-
2026-06-08days on market $189,000 Active 109 DOM
-
2026-06-07statusdays on market $189,000 Active 108 DOM
-
2026-06-04days on market $189,000 Price Change 105 DOM
-
2026-06-03days on market $189,000 Price Change 104 DOM
-
2026-06-02days on market $189,000 Price Change 103 DOM
-
2026-06-01days on market $189,000 Price Change 102 DOM
-
2026-05-31days on market $189,000 Price Change 101 DOM
-
2026-04-10price $197,000 487-char remark
Show marketing remark (487 chars)
Price reduced! With a brand-new foundation and a transferable warranty for extra peace of mind, this home is a great opportunity to make your own. It just needs a few cosmetic updates. The smart layout includes split bedrooms for privacy, a covered patio ideal for relaxing, and a spacious backyard perfect for outdoor fun. While the interior could use fresh paint and some updates, it's a blank canvas ready for your style and vision. Schedule a showing today and bring your best offer.
-
2026-02-19$206,000 New 487-char remark
Show marketing remark (487 chars)
Price reduced! With a brand-new foundation and a transferable warranty for extra peace of mind, this home is a great opportunity to make your own. It just needs a few cosmetic updates. The smart layout includes split bedrooms for privacy, a covered patio ideal for relaxing, and a spacious backyard perfect for outdoor fun. While the interior could use fresh paint and some updates, it's a blank canvas ready for your style and vision. Schedule a showing today and bring your best offer.
-
2009-04-02soldstatus
-
1981-09-01soldstatus
ⓘ Source: listings_history table (triggers on properties + properties_extension) + one-shot
backfill from property_details.listing_events for pre-trigger history.
Tax reassessment forecast TX · Resets to sale price
- Current annual tax
- $3,418 · $285/mo
- Projected year-2 tax
- $3,459 · $288/mo
- Expected delta
- +$41/yr (+$3/mo · 1.2%)
ⓘ Screening estimate from a state-policy table — verify with the county assessor before closing.
Climate risk First Street
- Flood 1/10 Low FEMA zone X (unshaded) · 0% chance over 30 yrs
- Wildfire 1/10 Low
- Heat 8/10 Severe 6 d/yr ≥107°F today · 18 d/yr by 30 yrs out
- Wind 8/10 Severe 80% chance of damaging wind over 30 yrs
- Air quality 2/10 Low 0 unhealthy d/yr today · 1 by 30 yrs out
Nearby sold comps map
Loading sold comps map…
Walkable amenities ~0.75 mi
Loading nearby amenities…
Taxation est. · year 1
- Rental income
- $19,503
- − Mortgage interest
- −$10,587
- − Property taxes
- −$3,418
- − Insurance
- −$945
- − Repairs & maintenance
- −$1,560
- − Management
- −$1,560
- − Depreciation
- −$5,498
- Taxable loss
- −$4,065
- Est. tax savings @ 24.0%
- +$976
- After-tax cash flow
- $127/yr
For passive investors: Depreciation is non-cash, so a rental often shows a tax loss while cash-flowing — sheltering income. Rental losses are passive: they offset passive income freely, and up to $25,000/yr can offset ordinary (W-2) income if you actively participate and your MAGI is under $100k (phasing out to $0 by $150k); unused losses carry forward. On sale, claimed depreciation is recaptured at up to 25%, and gains may owe capital-gains tax (a 1031 exchange can defer both). Figures are a year-1 estimate at your 24.0% rate — not tax advice; consult a CPA.
Schools (NCES district)
- District
- Judson ISD
- NCES district ID
- 4824990
- Math proficiency
- 21% ▼ -21.00%
- Reading proficiency
- 33% ▼ -7.00%
- Median HH income
- $57,542
- Composite
- 24.39/100
- National rank
- #7689
- State rank
- #660 of 826 in TX
Livability — Live Oak
- Score
- 73/100
- State rank
- #211
- US rank
- #5260
Category grades
Schools grade is shown separately in the Schools card above.
Census & demographics
- County
- Bexar County · 1,990,555 people
- Metro
- San Antonio-New Braunfels, TX
- Population (ZIP)
- 28,609
- Household income
- $70,098
- Rent vs Own
- Severe rent burden
- 488.0
Population outlook (Bexar County) Hauer SSP2
- Today (2025)
- 2,336,851 people
- By 2030
- 2,560,728 · +9.6%
- By 2040
- 3,020,569 · +29.3%
- By 2050
- 3,493,522 · +49.5%
- By 2075
- 4,668,459 · +99.8%
- By 2100
- 5,533,242 · +136.8%
Race, ethnicity, and origin ACS 2023
- Neighborhood character
- Diverse neighborhood (Simpson 0.66)
- Race & ethnicity
- Hispanic / Latino 47% White 30% Two or more races 20% Black 16% Asian 4% Pacific Islander 2%
- Hispanic origin (detail)
- Mexican 38% Puerto Rican 4%
- Common ancestry
- Lithuanian 2% Romanian 1% Slovak 1%
- Foreign-born
- 13% · Canada, Vietnam, Jamaica
- Languages at home
- 72% English-only · Spanish 24% Vietnamese 1% Chinese 1%
Political lean MEDSL · Bexar
- 2024 margin
- Lean D (+9.8) · D 54.3% · R 44.6% · Other 1.1%
- 2008→2024 swing
- +4.2pp toward D · 2008: 5.6pp · 2024: 9.8pp
- All cycles
- 2024: D+9.8 2020: D+18.2 2016: D+13.5 2012: D+4.6 2008: D+5.6
Not yet ingested
- Civics
- —
Market trends
- HPI YoY
- ▼ -15.13%
- Current HPI
- 242.1272
- Rent YoY
- ▼ -1.05%
- Metro
- San Antonio-New Braunfels, TX
- State GDP YoY
- ▲ 3.95%
- F500 in state
- 110
Industry mix (Fortune 500 HQ in TX)
| Industry | F500 HQs | Revenue |
|---|---|---|
| Energy | 16 | $1,198B |
|
||
| Technology | 5 | $198B |
|
||
| Engineering / Construction | 4 | $72B |
|
||
| Energy Services | 3 | $60B |
|
||
| Utilities | 3 | $41B |
|
||
| Healthcare | 2 | $330B |
|
||
Price history
-4.4% since first listed4 events — show timeline
- 2026-04-10 Price Changed $197,000 LERA
- 2026-02-19 Listed $206,000 LERA
- 2009-04-02 Sold (Public Records) — Public Records
- 1981-09-01 Sold (Public Records) — Public Records
Property tax history
+15.4%/yrLatest (2025): $3,418 · -3.3% YoY. Source: county tax records.
Cash-flow waterfall
monthlySold comps — $/sqft
last 12 mo · ≤1 miLoading sold comps…