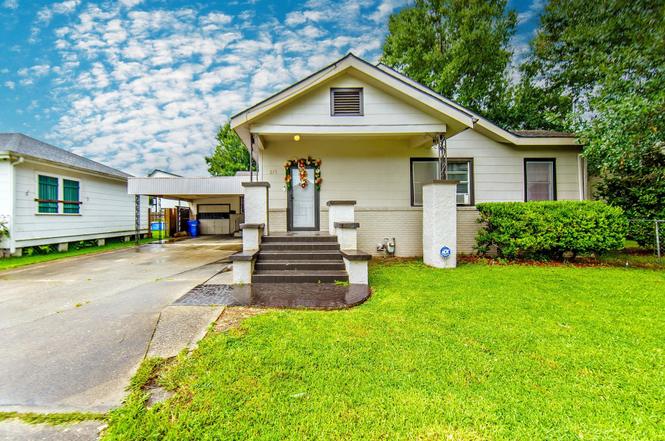
217 E 111th St · Thibodaux, LA
Flood risk 4/10 · Minor
- FEMA flood zone
- X
- Chance of flooding over 30 yrs
- 0.22%
- Est. flood insurance / yr
- $507 – $1,088
Fire risk 1/10 · Minimal
- Est. fire insurance / yr
- $1,269 – $2,357
Heat risk 9/10 · Severe
- Hot days now (above 108°F)
- 7 days/yr
- Hot days in 30 yrs
- 22 days/yr
Wind risk 9/10 · Severe
- Chance of severe wind over 30 yrs
- 99.0%
Air-quality risk 1/10 · Minimal
- Unhealthy air days now
- 0 days/yr
- Unhealthy air days in 30 yrs
- 0 days/yr
Risk factors via First Street. Map © Google.
Why this score? — see what drove the C+ grade
The composite is a weighted blend of 9 inputs, each scored 0–100. Each bar is that input's sub-score; the figure is the points it added to the 100-point composite (weight × sub-score).
- Cash flow +22.3/30.0
- ARV discount +15.0/15.0
- DSCR +7.1/10.0
- 1% rule +5.8/10.0
- Livability +4.2/5.0
- Schools +3.4/10.0
- Rent growth +3.2/5.0
- Condition / age +2.2/5.0
- Appreciation +0.0/10.0
$160,000
🖨 Deal sheet 📄 Offer letter ✓ Due diligence
Listing remarks
Welcome to this spacious and versatile home located in the heart of Thibodaux! Offering over 1,900 square feet of living area, this 3-bedroom, 2-bathroom home sits on a generous 60' x 180' lot and provides plenty of room both inside and out. Step inside to find two separate living areas, including a flexible space that can be used as a formal living room, home office, playroom, or additional entertaining area. The spacious kitchen offers ample cabinet and counter space, making meal preparation and hosting a breeze. Throughout the home, you'll appreciate the abundance of storage options designed to keep everything organized. Downstairs, a bonus entertaining area provides the perfect setting
Key facts
- Flexible space
- Outdoor kitchen area
- Large backyard
Tags
Property features AI
Exterior
- Parking: 2 parking spaces
- Utilities: Public water; Public sewer
- Home design: Detached single family residence; Residential property
- Construction: Wood siding and brick construction; Pillar/post/pier foundation
- Exterior features: Wood siding and brick exterior; Pillar/post/pier foundation; Lot approximately 0.247 acres (60 x 180)
Interior
- Bathrooms: 2 full bathrooms
- Heating & cooling: Heating system present; Window unit cooling
- Interior features: Window cooling units; Heating present
Neighborhood map
What this means for you Summary
Snapshot
- This is a 3-bed/2.0-bath single-family listed at $160k. Condition is rated fair.
Deal economics
- At list price, monthly cash flow is $264 ($3k/yr) — positive.
- The deal already cash-flows at list — no discount required.
- Meets the 1% rule at list price ($2k rent vs $160k).
- Cap rate 8.3% vs local median 3.8% in Thibodaux — top-decile yield for the area; either an underpriced asset or a hidden risk that comps aren't pricing in. Stress-test before assuming the spread holds.
Location & tenants
- Location reads 84/100 on livability (#2 in LA, #723 nationally) — a professional / high-income tenant draw. Strengths: commute A+, cost of living A+, health & safety A+; Watch: crime C-, employment F.
- Lafourche Parish (other): math 31% / reading 49% proficiency, ranked #22 of 98 in LA (top 22%) — families likely to look elsewhere, expect single-tenant / working-renter base with shorter leases.
- Market conditions: Rents rising (+2.9%/yr); 513 active listings in the ZIP; 2 comparable units currently listed for rent nearby; 319 units permitted in Lafourche Parish in 2024 (0 in 5+ unit buildings).
- This rent runs 36% of the median local income ($58k/yr) — at the standard rent-burdened threshold; future hikes will face affordability resistance.
Forward outlook
- Local home prices are declining (-3.0%/yr); year-one equity from $1k of loan paydown is wiped out by about $5k of value loss. Plan a longer hold.
Negotiation context
- Only 1 days on market — expect competitive offers; lowballing is unlikely to land.
Risks & watch-outs
- Climate carrying-cost: severe wind risk, 99% chance of damaging wind over 30y; extreme-heat days projected 7→22/yr by 2055 (HVAC capex compounding) — expect insurance premiums to compound above CPI over the hold.
Questions for the listing agent
- Have any recent inspections been done? Can we get a copy of the seller's disclosures and any deferred-maintenance estimates?
- Built in 1960 — when were the roof, HVAC, electrical panel, plumbing, and water heater last replaced?
- Is there a deadline driving the sale (1031 exchange, divorce, estate, relocation)? That informs how much negotiation room exists.
- Schools are A-rated — typically a magnet for longer-tenancy family renters. What's the average tenant stay here, and is there a school-zone premium baked into asking?
- What's the average days-on-market for RENTAL listings here right now (not sales)? A rising rental-DOM trend means longer vacancies and softer asking-rent achievability than the comps imply.
- What's the recent tenant-quality profile in this submarket — average credit score on applications, eviction rate, late-payment / NSF rate, and stable-employment percentage? A property-management company in the area should have these aggregated.
- How much new for-sale + rental construction is in the pipeline within 1–3 miles? Heavy new supply typically softens prices + rents 12–24 months out; constrained supply supports both.
Investment metrics
- 1% rule
- 1.08% ✓
- Cap rate
- 8.27%
- Cash-on-cash
- 7.06%
- DSCR
- 1.31
- GRM
- 7.7
CMA / ARV
- ARV (on-the-fly)
- $215,265
- Comps found
- 12
Show comp detail 12 sales within ~0.75 mi
| Address | Dist | Beds/Ba | Sqft | Sold | Price | $/sf | Match |
|---|---|---|---|---|---|---|---|
| 610 Green St | 0.35mi | 3/2.0 | 1,850 (-3%) | 4mo | $115,000 | $62 | 76 |
| 1406 Canal Blvd | 0.52mi | 3/2.0 | 1,836 (-4%) | 1mo | $175,000 | $95 | 69 |
| 1209 Tetreau St | 0.35mi | 3/2.0 | 1,749 (-8%) | 2mo | $149,900 | $86 | 69 |
| 574 Goode St | 0.34mi | 3/1.0 | 1,776 (-7%) | 1mo | $127,000 | $72 | 68 |
| 910 Harrison St | 0.29mi | 4/2.0 (+1) | 1,700 (-11%) | 2mo | $145,000 | $85 | 62 |
| 144 Pecan St | 0.31mi | 4/2.0 (+1) | 1,681 (-12%) | 6mo | $190,000 | $113 | 56 |
| 1044 Jackson St | 0.20mi | 2/2.0 (-1) | 1,708 (-10%) | 16mo | $225,000 | $132 | 55 |
| 319 Saint Mary St | 0.53mi | 3/2.0 | 1,749 (-8%) | 12mo | $198,000 | $113 | 52 |
| 1222 Canal Blvd | 0.41mi | 3/1.5 | 1,642 (-14%) | 12mo | $200,000 | $122 | 46 |
| 718 Bayou Ln | 0.60mi | 3/3.0 | 2,036 (+7%) | 15mo | $395,000 | $194 | 44 |
| 262 E Bayou Rd | 0.75mi | 3/2.0 | 1,693 (-11%) | 21mo | $329,000 | $194 | 29 |
| 505 Oak St | 0.69mi | 4/2.0 (+1) | 1,677 (-12%) | 20mo | $208,000 | $124 | 26 |
Match score weights: distance 35% · size 25% · config 20% · recency 20%. Top-matched comps best support the ARV.
Projected returns pro-forma
-3.0% appreciation · 2.9% rent growth · sell at horizon
- IRR
- -5.6%
- Equity multiple
- 0.79×
- Total profit
- $-9,277
- Equity at exit
- $23,857
- IRR
- 4.0%
- Equity multiple
- 1.29×
- Total profit
- $12,944
- Equity at exit
- $13,834
Cash invested: $44,800 (down + closing). Projections, not guarantees.
Landlord ↔ Tenant lean methodology
- Overall (STATE)
- 90 Strongly Landlord-Friendly
- State Louisiana
- 90 Strongly Landlord-Friendly · R+12
- County
- — inherits STATE
- City
- — inherits STATE
ZIP-level market 70301
- Rents YoY
- 2.9%
- Active inventory
- 513
- Price-to-rent
- 7.7×
Monthly cashflow live
- Estimated rent
- $1,734 medium interval (Pro) →
- Mortgage (P&I)
- −$839
- Tax est. 1.5%
- −$200 /mo · $2,400/yr
- Insurance
- −$67
- HOA
- −$0
- Vacancy / Maint / Mgmt
- −$364
- Net cashflow
- $264
Break-even live
UW: 25.0% down · 7.5% · 30yr · 1.5% tax · 5.0% vac · 8.0% maint · 8.0% mgmt
Financing live
Cash to close
- Down payment
- $40,000
- Closing costs
- $4,800
- Reserves months
- —
- Total cash needed
- —
Loan-product check · same deal, 3 products live
Conventional
25% down · 7.5% · 30yr
- Down + closing
- —
- Monthly P&I
- —
- Monthly cashflow
- —
- DSCR
- —
- Eligible?
- —
Personal DTI + credit; lowest rate.
DSCR
20% down · 8.5% · 30yr
- Down + closing
- —
- Monthly P&I
- —
- Monthly cashflow
- —
- DSCR
- —
- Eligible?
- —
No personal income docs; deal must DSCR.
Hard money
10% down · 12.0% · 12mo
- Down + closing
- —
- Monthly P&I
- —
- Monthly cashflow
- —
- DSCR
- —
- Eligible?
- —
Short-term bridge; refi at stabilization.
Rent comps 2 comps
| Address | Beds | Baths | Sqft | Rent | $/sqft | DOM | Units | Dist |
|---|---|---|---|---|---|---|---|---|
| 304 Bradford St Thibodaux, LA | 3.0 | 1.0 | 1400 | $1,150 | $0.82 | 43d | 1 | 0.44mi |
| 624 Percy Brown Rd Thibodaux, LA | 1.0–3.0 | 1.0–2.0 | 1085 | $3,065 | $2.82 | 43d | 29 | 1.41mi |
Listing history 2 events
-
2026-06-15remarks 699-char remark
-
2026-06-15$160,000 Active 1 DOM
ⓘ Source: listings_history table (triggers on properties + properties_extension) + one-shot
backfill from property_details.listing_events for pre-trigger history.
Climate risk First Street
- Flood 4/10 Moderate FEMA zone X · 22% chance over 30 yrs
- Wildfire 1/10 Low
- Heat 9/10 Extreme 7 d/yr ≥108°F today · 22 d/yr by 30 yrs out
- Wind 9/10 Extreme 99% chance of damaging wind over 30 yrs
- Air quality 1/10 Low 0 unhealthy d/yr today · 0 by 30 yrs out
Nearby sold comps map
Loading sold comps map…
Walkable amenities ~0.75 mi
Loading nearby amenities…
Taxation est. · year 1
- Rental income
- $20,802
- − Mortgage interest
- −$8,962
- − Property taxes
- −$2,400
- − Insurance
- −$800
- − Repairs & maintenance
- −$1,664
- − Management
- −$1,664
- − Depreciation
- −$4,655
- Taxable income
- $657
- Est. tax owed @ 24.0%
- −$158
- After-tax cash flow
- $3,007/yr
For passive investors: Depreciation is non-cash, so a rental often shows a tax loss while cash-flowing — sheltering income. Rental losses are passive: they offset passive income freely, and up to $25,000/yr can offset ordinary (W-2) income if you actively participate and your MAGI is under $100k (phasing out to $0 by $150k); unused losses carry forward. On sale, claimed depreciation is recaptured at up to 25%, and gains may owe capital-gains tax (a 1031 exchange can defer both). Figures are a year-1 estimate at your 24.0% rate — not tax advice; consult a CPA.
Condition & rehab AI · 13 photos
This home requires moderate repairs and maintenance, with potential for significant value increase through exterior painting and interior updates.
Repairs flagged
- Minor kitchen cabinets — slight wear
- Minor bathroom fixtures — slight wear
- Moderate exterior siding — moderate wear
Value-add opportunities
- Resale paint exterior — enhances curb appeal
- Rental replace carpet in bedrooms — improves comfort
- Resale update kitchen cabinets — modernizes space
Renovation cost estimate screening
| Repair item | Severity | Est. cost |
|---|---|---|
| kitchen cabinets · slight wear | Minor | $500–3,000 |
| bathroom fixtures · slight wear | Minor | $500–3,000 |
| exterior siding · moderate wear | Moderate | $3,000–15,000 |
| Total estimated repair cost · 3 items | $4,000–21,000 |
Value-add ROI direction
- Resale paint exterior — enhances curb appeal ↑
- Rental replace carpet in bedrooms — improves comfort ↑
- Resale update kitchen cabinets — modernizes space ↑
ⓘ Cost ranges are severity-bucket heuristics (US national rule-of-thumb). Get contractor quotes + a written scope before underwriting a rehab budget.
Schools (NCES district)
- District
- Lafourche Parish
- NCES district ID
- 2200900
- Math proficiency
- 31% ▼ -43.00%
- Reading proficiency
- 49% ▼ -32.00%
- Median HH income
- $49,703
- Composite
- 34.4/100
- National rank
- #5205
- State rank
- #22 of 98 in LA
Livability — Thibodaux
- Score
- 84/100
- State rank
- #2
- US rank
- #723
Category grades
Schools grade is shown separately in the Schools card above.
Census & demographics
- Census place
- Thibodaux, LA
- County
- Lafourche Parish · 50,095 people
- City population
- 50,095
- Metro
- Houma-Thibodaux, LA
- Population (ZIP)
- 50,095
- Household income
- $58,394
- Rent vs Own
- Severe rent burden
- 1513.0
Population outlook (Lafourche County) Hauer SSP2
- Today (2025)
- 102,122 people
- By 2030
- 103,361 · +1.2%
- By 2040
- 104,401 · +2.2%
- By 2050
- 102,795 · +0.7%
- By 2075
- 95,599 · -6.4%
- By 2100
- 82,303 · -19.4%
Race, ethnicity, and origin ACS 2023
- Neighborhood character
- Predominantly White (71%)
- Race & ethnicity
- White 71% Black 20% Hispanic / Latino 5% Two or more races 5% Native American 1%
- Hispanic origin (detail)
- Mexican 3%
- Common ancestry
- Lithuanian 18% Italian 1% Slovak 1%
- Foreign-born
- 2% · Canada
- Languages at home
- 95% English-only · French/Haitian/Cajun 2% Spanish 2%
Political lean MEDSL · Lafourche
- 2024 margin
- Solid R (+62.1) · D 18.4% · R 80.4% · Other 1.2%
- 2008→2024 swing
- -16.1pp toward R · 2008: -46.0pp · 2024: -62.1pp
- All cycles
- 2024: R+62.1 2020: R+60.3 2016: R+56.5 2012: R+48.5 2008: R+46.0
Not yet ingested
- Civics
- —
Market trends
- HPI YoY
- ▼ -98.35%
- Current HPI
- 124.5559
- Rent YoY
- ▲ 2.90%
- Metro
- Houma-Thibodaux, LA
- State GDP YoY
- ▲ 3.29%
- F500 in state
- 10
Industry mix (Fortune 500 HQ in LA)
| Industry | F500 HQs | Revenue |
|---|---|---|
| Telecommunications | 2 | $23B |
|
||
| Utilities | 1 | $12B |
|
||
| Wholesale / Distribution | 1 | $5B |
|
||
| Advertising | 1 | $2B |
|
||
Price history
1 event — show timeline
- 2026-06-15 Listed $160,000 GBRMLS
Cash-flow waterfall
monthlySold comps — $/sqft
last 12 mo · ≤1 miLoading sold comps…