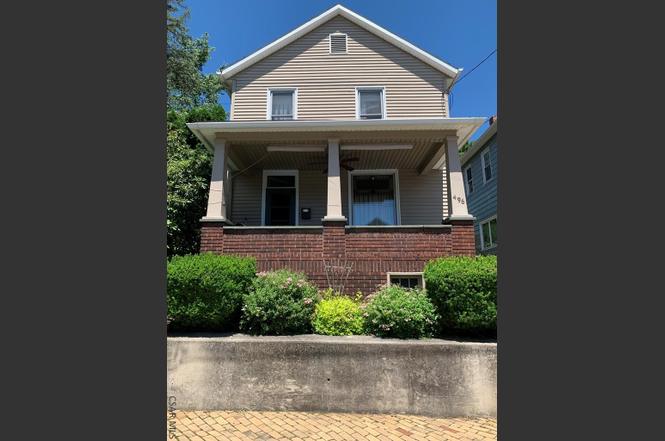
496 First St · East Conemaugh, PA
Flood risk 7/10 · Major
- FEMA flood zone
- X (unshaded)
- Chance of flooding over 30 yrs
- 0.99%
- Est. flood insurance / yr
- $473 – $860
Fire risk 3/10 · Minor
- Est. fire insurance / yr
- $511 – $949
Heat risk 3/10 · Minor
- Hot days now (above 91°F)
- 8 days/yr
- Hot days in 30 yrs
- 19 days/yr
Wind risk 2/10 · Minimal
- Chance of severe wind over 30 yrs
- —
Air-quality risk 2/10 · Minimal
- Unhealthy air days now
- 1 days/yr
- Unhealthy air days in 30 yrs
- 2 days/yr
Risk factors via First Street. Map © Google.
Why this score? — see what drove the B grade
The composite is a weighted blend of 9 inputs, each scored 0–100. Each bar is that input's sub-score; the figure is the points it added to the 100-point composite (weight × sub-score).
- Cash flow +30.0/30.0
- 1% rule +10.0/10.0
- DSCR +10.0/10.0
- Appreciation +6.8/10.0
- Schools +3.6/10.0
- ARV discount +3.5/15.0
- Livability +3.0/5.0
- Rent growth +2.5/5.0
- Condition / age +2.5/5.0
$48,000
🖨 Deal sheet 📄 Offer letter ✓ Due diligence
Listing remarks
Welcome home to this charming and lovingly maintained property that combines comfort, convenience, and outdoor beauty. Relax on the spacious front porch featuring a glider and roller shades—the perfect spot to enjoy your morning coffee or unwind in the evening. Inside, you'll find a thoughtfully updated kitchen with attractive luxury vinyl tile flooring, abundant cabinet space, and recessed lighting that creates a bright and welcoming atmosphere. Spacious living and dining rooms perfect for making memories during social gatherings. A convenient first-floor powder room adds everyday functionality, while the home's overall condition reflects years of attentive care and maintenance. Step
Key facts
- Newer furnace
- Cozy sunporch
- Storage shed
Tags
Property features AI
Exterior
- Parking: On-street parking; Paved parking
- Security: Smoke detector(s)
- Utilities: Public water; Public sewer (sewer available)
- Home design: Residential single-family home; Three or more levels (3 stories)
- Construction: Brick, frame and vinyl siding construction; Shingle roof; Built on a full basement
- Exterior features: Covered patio and porch; Patio; Porch; Rectangular lot; Public maintained road; City street frontage
Interior
- Kitchen: Range; Oven; Microwave; Range hood; Refrigerator
- Flooring: Carpet; Laminate; Vinyl; Wood
- Bathrooms: 1 full bathroom; 1 half bathroom
- Heating & cooling: Hot water heating; Electric heating; Oil heating; Ceiling fan(s); Wall unit(s) for cooling
- Interior features: Eat-in kitchen; Entrance foyer; High-speed internet; Window coverings; Double-pane windows; Fireplace (2)
- Laundry & utility: Washer; Dryer; Laundry in basement with sink; Full, unfinished basement
Neighborhood map
What this means for you Summary
Snapshot
- This is a 3-bed/1.5-bath single-family listed at $48k.
Deal economics
- At list price, monthly cash flow is $549 ($7k/yr) — positive.
- The deal already cash-flows at list — no discount required.
- Meets the 1% rule at list price ($1k rent vs $48k).
Location & tenants
- Location reads 60/100 on livability (#1,504 in PA) — a middle-class / working-renter tenant base. Strengths: crime A+, cost of living A+; Watch: schools F, amenities F, commute F.
- Conemaugh Valley SD (rural): math 30% / reading 56% proficiency, ranked #313 of 539 in PA (top 58%) — families likely to look elsewhere, expect single-tenant / working-renter base with shorter leases.
- Market conditions: 22 active listings in the ZIP; 64 units permitted in Cambria County in 2024 (0 in 5+ unit buildings).
Forward outlook
- In year one you build about $2k of equity ($332 loan paydown + $2k appreciation (3.6% local appreciation)).
- Cambria County population projected at -28% by 2050 — secular population decline; favor cash flow + early exit over multi-decade hold.
- At projected returns (3.6% appreciation + 3.0% rent growth), your $13k cash investment doubles in ~2 years — after that, you're playing with house money.
Negotiation context
- Only 2 days on market — expect competitive offers; lowballing is unlikely to land.
- Current owner paid $7k; list at $48k implies a 606% gain — meaningful room to come down on a strong offer.
Risks & watch-outs
- Watch-outs: flood insurance adds $56/mo.
- Climate carrying-cost: major flood risk — expect insurance premiums to compound above CPI over the hold.
Questions for the listing agent
- What's the actual annual flood-insurance premium (NFIP or private), and is the property in a SFHA with mandatory coverage?
- Is there a deadline driving the sale (1031 exchange, divorce, estate, relocation)? That informs how much negotiation room exists.
- Schools are F-rated, which usually means shorter tenancies and higher turnover. Who's the typical renter profile here, and what's been the actual vacancy rate?
- What's the average days-on-market for RENTAL listings here right now (not sales)? A rising rental-DOM trend means longer vacancies and softer asking-rent achievability than the comps imply.
- What's the recent tenant-quality profile in this submarket — average credit score on applications, eviction rate, late-payment / NSF rate, and stable-employment percentage? A property-management company in the area should have these aggregated.
- How much new for-sale + rental construction is in the pipeline within 1–3 miles? Heavy new supply typically softens prices + rents 12–24 months out; constrained supply supports both.
Investment metrics
- 1% rule
- 2.47% ✓
- Cap rate
- 21.41%
- Cash-on-cash
- 54.01%
- DSCR
- 3.40
- GRM
- 3.4
CMA / ARV
- ARV (on-the-fly)
- $44,100
- Comps found
- 7
Show comp detail 7 sales within ~0.75 mi
| Address | Dist | Beds/Ba | Sqft | Sold | Price | $/sf | Match |
|---|---|---|---|---|---|---|---|
| 223 First St | 0.34mi | 3/1.0 | 1,250 (-1%) | 13mo | $37,500 | $30 | 70 |
| 145 Jackson St | 0.51mi | 3/1.0 | 1,231 (-2%) | 4mo | $50,000 | $41 | 67 |
| 415 Second St | 0.14mi | 3/2.0 | 1,208 (-4%) | 23mo | $15,000 | $12 | 66 |
| 113 Bon Air St | 0.52mi | 2/1.0 (-1) | 1,242 (-1%) | 11mo | $50,000 | $40 | 57 |
| 1136 Main St | 0.34mi | 4/1.0 (+1) | 1,232 (-2%) | 20mo | $43,400 | $35 | 57 |
| 1 Headrick Aly | 0.38mi | 4/1.5 (+1) | 1,232 (-2%) | 20mo | $32,000 | $26 | 57 |
| 1161 William Penn Ave | 0.66mi | 3/2.0 | 1,080 (-14%) | 14mo | $171,000 | $158 | 32 |
Match score weights: distance 35% · size 25% · config 20% · recency 20%. Top-matched comps best support the ARV.
Projected returns pro-forma
3.56% appreciation · 3.0% rent growth · sell at horizon
- IRR
- 55.0%
- Equity multiple
- 4.14×
- Total profit
- $42,266
- Equity at exit
- $23,121
- IRR
- 54.1%
- Equity multiple
- 8.42×
- Total profit
- $99,760
- Equity at exit
- $36,876
Cash invested: $13,440 (down + closing). Projections, not guarantees.
Landlord ↔ Tenant lean methodology
- Overall (STATE)
- 62 Landlord-Friendly
- State Pennsylvania
- 62 Landlord-Friendly · EVEN
- County
- — inherits STATE
- City
- — inherits STATE
ZIP-level market 15909
- Home prices YoY
- 2.4%
- Active inventory
- 22
- Price-to-rent
- 3.4×
Monthly cashflow live
- Estimated rent
- $1,185 medium interval (Pro) →
- Mortgage (P&I)
- −$252
- Tax from tax record
- −$59 /mo · $712/yr
- Insurance
- −$20
- Flood insurance flood zone
- −$56 /mo · $666/yr
- HOA
- −$0
- Vacancy / Maint / Mgmt
- −$249
- Net cashflow
- $549
Break-even live
UW: 25.0% down · 7.5% · 30yr · 1.5% tax · 5.0% vac · 8.0% maint · 8.0% mgmt
Financing live
Cash to close
- Down payment
- $12,000
- Closing costs
- $1,440
- Reserves months
- —
- Total cash needed
- —
Loan-product check · same deal, 3 products live
Conventional
25% down · 7.5% · 30yr
- Down + closing
- —
- Monthly P&I
- —
- Monthly cashflow
- —
- DSCR
- —
- Eligible?
- —
Personal DTI + credit; lowest rate.
DSCR
20% down · 8.5% · 30yr
- Down + closing
- —
- Monthly P&I
- —
- Monthly cashflow
- —
- DSCR
- —
- Eligible?
- —
No personal income docs; deal must DSCR.
Hard money
10% down · 12.0% · 12mo
- Down + closing
- —
- Monthly P&I
- —
- Monthly cashflow
- —
- DSCR
- —
- Eligible?
- —
Short-term bridge; refi at stabilization.
Listing history 3 events
-
2026-06-19days on market $48,000 Active 2 DOM
-
2026-06-17remarks 693-char remark
-
2026-06-17$48,000 Active 1 DOM
ⓘ Source: listings_history table (triggers on properties + properties_extension) + one-shot
backfill from property_details.listing_events for pre-trigger history.
Tax reassessment forecast PA · Partial reset (capped growth)
- Current annual tax
- $712 · $59/mo
- Projected year-2 tax
- $735 · $61/mo
- Expected delta
- +$23/yr (+$2/mo · 3.2%)
ⓘ Screening estimate from a state-policy table — verify with the county assessor before closing.
Climate risk First Street
- Flood 7/10 Severe FEMA zone X (unshaded) · 99% chance over 30 yrs
- Wildfire 3/10 Moderate
- Heat 3/10 Moderate 8 d/yr ≥91°F today · 19 d/yr by 30 yrs out
- Wind 2/10 Low
- Air quality 2/10 Low 1 unhealthy d/yr today · 2 by 30 yrs out
Nearby sold comps map
Loading sold comps map…
Walkable amenities ~0.75 mi
Loading nearby amenities…
Taxation est. · year 1
- Rental income
- $14,217
- − Mortgage interest
- −$2,689
- − Property taxes
- −$712
- − Insurance
- −$906
- − Repairs & maintenance
- −$1,137
- − Management
- −$1,137
- − Depreciation
- −$1,396
- Taxable income
- $6,238
- Est. tax owed @ 24.0%
- −$1,497
- After-tax cash flow
- $5,095/yr
For passive investors: Depreciation is non-cash, so a rental often shows a tax loss while cash-flowing — sheltering income. Rental losses are passive: they offset passive income freely, and up to $25,000/yr can offset ordinary (W-2) income if you actively participate and your MAGI is under $100k (phasing out to $0 by $150k); unused losses carry forward. On sale, claimed depreciation is recaptured at up to 25%, and gains may owe capital-gains tax (a 1031 exchange can defer both). Figures are a year-1 estimate at your 24.0% rate — not tax advice; consult a CPA.
Schools (NCES district)
- District
- Conemaugh Valley SD
- NCES district ID
- 4206430
- Math proficiency
- 30% ▼ -18.00%
- Reading proficiency
- 56% ▼ -11.00%
- Median HH income
- $42,523
- Composite
- 36.16/100
- National rank
- #4739
- State rank
- #313 of 539 in PA
Livability — East Conemaugh
- Score
- 60/100
- State rank
- #1504
- US rank
- #19510
Category grades
Schools grade is shown separately in the Schools card above.
Census & demographics
- Census place
- East Conemaugh, PA
- Population (ZIP)
- 4,850
Population outlook (Cambria County) Hauer SSP2
- Today (2025)
- 122,754 people
- By 2030
- 115,827 · -5.6%
- By 2040
- 101,309 · -17.5%
- By 2050
- 88,379 · -28.0%
- By 2075
- 65,237 · -46.9%
- By 2100
- 46,909 · -61.8%
Race, ethnicity, and origin ACS 2023
- Neighborhood character
- Predominantly White (95%)
- Race & ethnicity
- White 95% Two or more races 3% Hispanic / Latino 2%
- Common ancestry
- Romanian 13% Polish 2% Slovak 2%
- Foreign-born
- 0%
- Languages at home
- 99% English-only · Spanish 1%
Political lean MEDSL · Cambria
- 2024 margin
- Solid R (+39.7) · D 29.8% · R 69.5%
- 2008→2024 swing
- -40.4pp toward R · 2008: 0.7pp · 2024: -39.7pp
- All cycles
- 2024: R+39.7 2020: R+37.3 2016: R+37.8 2012: R+17.8 2008: D+0.7
Not yet ingested
- Civics
- —
Market trends
- HPI YoY
- ▲ 3.56%
- Current HPI
- 150.8221
- Rent YoY
- —
- Metro
- —
- State GDP YoY
- ▲ 1.68%
- F500 in state
- 34
Industry mix (Fortune 500 HQ in PA)
| Industry | F500 HQs | Revenue |
|---|---|---|
| Healthcare | 2 | $309B |
|
||
| Insurance | 2 | $27B |
|
||
| Telecommunications / Media | 1 | $124B |
|
||
| Industrial Distribution | 1 | $22B |
|
||
| Financial Services | 1 | $20B |
|
||
| Chemicals / Materials | 1 | $18B |
|
||
Price history
+605.9% since first listed2 events — show timeline
- 2026-06-17 Listed $48,000 CSMLS
- 1996-02-01 Sold (Public Records) $6,800 Public Records
Property tax history
+0.9%/yrLatest (2026): $712 · +0.0% YoY. Source: county tax records.
Cash-flow waterfall
monthlySold comps — $/sqft
last 12 mo · ≤1 miLoading sold comps…