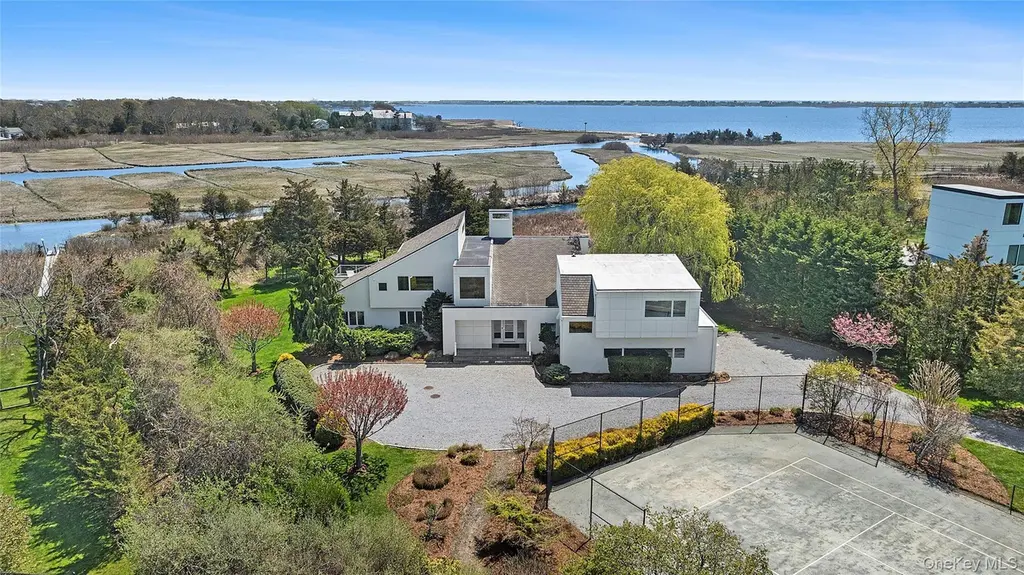
22 Tanners Neck Ln · Westhampton, NY
Flood risk 5/10 · Moderate
- FEMA flood zone
- X (shaded)
- Chance of flooding over 30 yrs
- 0.51%
- Est. flood insurance / yr
- $473 – $860
Fire risk 1/10 · Minimal
- Est. fire insurance / yr
- $691 – $1,283
Heat risk 4/10 · Minor
- Hot days now (above 90°F)
- 6 days/yr
- Hot days in 30 yrs
- 16 days/yr
Wind risk 8/10 · Major
- Chance of severe wind over 30 yrs
- 80.0%
Air-quality risk 4/10 · Minor
- Unhealthy air days now
- 4 days/yr
- Unhealthy air days in 30 yrs
- 5 days/yr
Risk factors via First Street. Map © Google.
Why this score? — see what drove the D- grade
The composite is a weighted blend of 9 inputs, each scored 0–100. Each bar is that input's sub-score; the figure is the points it added to the 100-point composite (weight × sub-score).
- Appreciation +9.4/10.0
- Cash flow +7.4/30.0
- Schools +6.6/10.0
- ARV discount +3.5/15.0
- Livability +3.0/5.0
- Rent growth +2.5/5.0
- Condition / age +2.5/5.0
- DSCR +1.5/10.0
- 1% rule +0.9/10.0
$3,699,000
🖨 Deal sheet (PDF) 📄 Offer letter ✓ Due diligence
Listing remarks
MODERN COASTAL ELEGANCE Nestled on a sprawling 1.64-acre estate in the heart of Westhampton, this Bruce Nagel-designed masterpiece offers the ultimate Hamptons retreat. Extensively reimagined in 2011, the residence seamlessly blends architectural sophistication with the relaxed pace of waterfront living. The open foyer is adorned with sleek gray hardwood floors and a direct sightline to the water through floor-to-ceiling glass windows and doors. The heart of the home is a great room featuring a linear gas fireplace, offering panoramic views of the pool, deck, and the canal beyond. Enjoy the high-end Downsview kitchen featuring white lacquer cabinetry, substantial Caesarstone countertops, an
Key facts
- Private side deck
- Bruce nagel designed
- Mahogany deck
Tags
Property features AI
Exterior
- Parking: Driveway; 2-car garage
- Security: Security system
- Utilities: Septic tank; No public utilities listed
- Home design: Single family residence
- Construction: Stucco exterior
- Exterior features: Private in-ground vinyl pool; Tennis court(s); Waterfront
Interior
- Kitchen: Dishwasher; Gas oven; Gas range; Microwave; Range; Refrigerator; Kitchen island; Eat-in kitchen; Open kitchen
- Bedrooms: Includes a first-floor bedroom
- Flooring: Carpet; Hardwood
- Bathrooms: 5 full bathrooms
- Heating & cooling: Central air conditioning; Forced air heating; Propane heating
- Interior features: First-floor bedroom; First-floor full bath; Double vanity; Eat-in kitchen; His and hers closets; Kitchen island; Open floorplan; Open kitchen; Primary bathroom
- Laundry & utility: Washer; Dryer; Laundry located in hall
Neighborhood map
What this means for you Summary
Snapshot
- This is a 4-bed/4.0-bath single-family listed at $3.70M.
Deal economics
- At list price, monthly cash flow is $-5k ($-58k/yr) — negative.
- To cash-flow at today's rent, offer at most $2.85M (22.9% below list).
- To meet the 1% rule (rent ≥ 1% of price), the offer needs to be $2.19M (40.7% below list).
- Recommended offer: $2.19M (40.7% below list) — sets the bar for 1% rule.
- Cap rate 4.7% vs local median 9.0% in Westhampton — below-typical yield; the buyer is paying a premium for something (appreciation thesis, condition, location) that the cap rate doesn't capture.
Location & tenants
- Location reads 60/100 on livability (#969 in NY) — a middle-class / working-renter tenant base. Strengths: crime A+, employment A+; Watch: housing C-, amenities F, commute F.
- Westhampton Beach Union Free School District (suburban): math 72% / reading 75% proficiency, ranked #81 of 590 in NY (top 14%) — strong family-tenant draw, lease renewals of 3-5y typical.
- Zoned schools: Westhampton Beach Elementary School (math 67% / reading 67%, grade B+, #525 of 2,108 statewide, top 27%, 356 students, 43% FRL); Westhampton Middle School (math 61% / reading 63%, grade B+, #136 of 729 statewide, top 20%, 434 students, 26% FRL); Westhampton Beach Senior High School (math 90% / reading 96%, grade A+, #147 of 1,100 statewide, top 14%, 964 students, 24% FRL).
- Market conditions: 66 active listings in the ZIP; 13 comparable units currently listed for rent nearby; rentals at typical pace (median 20d on market — plan ~3-4 weeks tenant-placement turnaround); high-income renter base; 1,366 units permitted in Suffolk County in 2024 (216 in 5+ unit buildings).
- At $21,924/mo this rent would consume 174% of the median local household income ($151k/yr) — very limited rent-growth headroom before tenants either downsize or default.
Forward outlook
- In year one you build about $352k of equity ($26k loan paydown + $326k appreciation (8.8% local appreciation)).
- Suffolk County population projected to shrink 5% by 2050 — rents likely to lag national; underwrite the cash flow, not the appreciation.
- By year 2, paydown + projected appreciation supports a ~$564k cash-out refi (75% LTV) — recoverable capital for the next deal without selling this one.
Negotiation context
- It's been on market 24 days — a 2% lower offer ($3.64M) is reasonable based on typical stale-listing flexibility.
- Current owner paid $662k; list at $3.70M implies a 458% gain — meaningful room to come down on a strong offer.
Risks & watch-outs
- Climate carrying-cost: moderate flood risk; severe wind risk, 80% chance of damaging wind over 30y — expect insurance premiums to compound above CPI over the hold.
Questions for the listing agent
- What do current leases actually rent for vs. the listed asking? Can we see a recent rent roll and the last 12 months of T-12 income?
- Is there a deadline driving the sale (1031 exchange, divorce, estate, relocation)? That informs how much negotiation room exists.
- Schools are D-rated, which usually means shorter tenancies and higher turnover. Who's the typical renter profile here, and what's been the actual vacancy rate?
- The area grade is low — what's the realistic commute time and amenity access for the typical tenant pool here? Any planned neighborhood developments (good or bad) we should know about?
- What's the average days-on-market for RENTAL listings here right now (not sales)? A rising rental-DOM trend means longer vacancies and softer asking-rent achievability than the comps imply.
- What's the recent tenant-quality profile in this submarket — average credit score on applications, eviction rate, late-payment / NSF rate, and stable-employment percentage? A property-management company in the area should have these aggregated.
- How much new for-sale + rental construction is in the pipeline within 1–3 miles? Heavy new supply typically softens prices + rents 12–24 months out; constrained supply supports both.
Investment metrics
- 1% rule
- 0.59% ✗
- Cap rate
- 4.74%
- Cash-on-cash
- -5.56%
- DSCR
- 0.75
- GRM
- 14.1
CMA / ARV
- ARV (median comp)
- $3,397,222
- List price
- $3,699,000
- Delta
- 8.88%
- Verdict
- FAIR
- Comps
- 16 within 1.0 mi
Show comp detail 2 sales within ~0.75 mi
| Address | Dist | Beds/Ba | Sqft | Sold | Price | $/sf | Match |
|---|---|---|---|---|---|---|---|
| 6 Wintergreen Ln | 0.67mi | 3/2.0 (-1) | 1,947 (-2%) | 3mo | $1,200,000 | $616 | 50 |
| 23 Sweetgrass Rd | 0.61mi | 3/2.0 (-1) | 1,732 (-13%) | 22mo | $1,537,500 | $888 | 19 |
Match score weights: distance 35% · size 25% · config 20% · recency 20%. Top-matched comps best support the ARV.
Projected returns pro-forma
8.82% appreciation · 3.0% rent growth · sell at horizon
- IRR
- 17.7%
- Equity multiple
- 2.37×
- Total profit
- $1,414,142
- Equity at exit
- $3,020,516
- IRR
- 16.7%
- Equity multiple
- 5.20×
- Total profit
- $4,344,873
- Equity at exit
- $6,208,200
Cash invested: $1,035,720 (down + closing). Projections, not guarantees.
Landlord ↔ Tenant lean methodology
- Overall (STATE)
- 15 Strongly Tenant-Friendly
- State New York
- 15 Strongly Tenant-Friendly · D+10
- County
- — inherits STATE
- City
- — inherits STATE
ZIP-level market 11977
- Home prices YoY
- 2.3%
- Active inventory
- 66
- Price-to-rent
- 14.1×
Monthly cashflow live
- Estimated rent
- $21,924 medium interval (Pro) →
- Mortgage (P&I)
- −$19,398
- Tax from tax record
- −$1,178 /mo · $14,130/yr
- Insurance
- −$1,541
- HOA
- −$0
- Vacancy / Maint / Mgmt
- −$4,604
- Net cashflow
- $-4,797
Break-even live
Sensitivity live
| Price | -10% $-2,703 | -5% $-3,750 | +0% $-4,797 | +5% $-5,844 | +10% $-6,891 |
|---|---|---|---|---|---|
| Rent | -10% $-6,529 | -5% $-5,663 | +0% $-4,797 | +5% $-3,931 | +10% $-3,065 |
| Rate | -1.0pp $-2,934 | -0.5pp $-3,856 | base $-4,797 | +0.5pp $-5,755 | +1.0pp $-6,731 |
UW: 25.0% down · 7.5% · 30yr · 1.5% tax · 5.0% vac · 8.0% maint · 8.0% mgmt
Financing live
Cash to close
- Down payment
- $924,750
- Closing costs
- $110,970
- Reserves months
- —
- Total cash needed
- —
Loan-product check · same deal, 3 products live
Conventional
25% down · 7.5% · 30yr
- Down + closing
- —
- Monthly P&I
- —
- Monthly cashflow
- —
- DSCR
- —
- Eligible?
- —
Personal DTI + credit; lowest rate.
DSCR
20% down · 8.5% · 30yr
- Down + closing
- —
- Monthly P&I
- —
- Monthly cashflow
- —
- DSCR
- —
- Eligible?
- —
No personal income docs; deal must DSCR.
Hard money
10% down · 12.0% · 12mo
- Down + closing
- —
- Monthly P&I
- —
- Monthly cashflow
- —
- DSCR
- —
- Eligible?
- —
Short-term bridge; refi at stabilization.
Rent comps 13 comps
| Address | Beds | Baths | Sqft | Rent | $/sqft | DOM | Units | Dist |
|---|---|---|---|---|---|---|---|---|
| 70 Tanners Neck Ln Westhampton, NY | 4.0 | 3.5 | 2100 | $20,000 | $9.52 | 45d | 1 | 0.65mi |
| 70 Jagger Ln Westhampton, NY | 3.0 | 2.0 | 1850 | $20,000 | $10.81 | 0d | 1 | 0.69mi |
| 134A Montauk Hwy Westhampton, NY | 4.0 | 3.5 | 2478 | $15,000 | $6.05 | 0d | 1 | 0.95mi |
| 19 Bishop Ave Westhampton, NY | 3.0 | 2.0 | 1514 | $15,000 | $9.91 | 20d | 1 | 1.02mi |
| 132 Point Rd Westhampton Beach, NY | 3.0 | 3.0 | 1500 | $15,000 | $10.00 | 20d | 1 | 1.07mi |
| 88 Point Rd Westhampton Beach, NY | 3.0 | 2.0 | 2100 | $18,000 | $8.57 | 45d | 1 | 1.08mi |
| 22 Meadow Ln Westhampton Beach, NY | 4.0 | 4.0 | 2500 | $70,000 | $28.00 | 26d | 1 | 1.10mi |
| 25 N Quarter Rd Westhampton, NY | 4.0 | 3.0 | 2000 | $30,000 | $15.00 | 18d | 1 | 1.17mi |
| 7 Pond Point Rd Westhampton Beach, NY | 3.0 | 2.5 | 1450 | $25,000 | $17.24 | 16d | 1 | 1.19mi |
| 35 Halsey Rd Remsenburg, NY | 3.0 | 2.0 | 2345 | $10,000 | $4.26 | 0d | 1 | 1.22mi |
| 552 Dune Rd Westhampton Beach, NY | 5.0 | 3.5 | 2296 | $55,000 | $23.95 | 45d | 1 | 1.43mi |
| 31 Liberty St Westhampton Beach, NY | 3.0 | 1.5 | 2000 | $40,000 | $20.00 | 45d | 1 | 1.49mi |
| 298 Dune Rd Westhampton Beach, NY | 3.0 | 2.0 | 1800 | $50,000 | $27.78 | 26d | 1 | 1.49mi |
Listing history 6 events
-
2026-06-02statusdays on market $3,699,000 Pending 24 DOM
-
2026-06-01days on market $3,699,000 Active 23 DOM
-
2026-05-31days on market $3,699,000 Active 22 DOM
-
2026-05-09$3,699,000 Active 2295-char remark
-
1999-02-24soldstatus $662,500
-
1995-11-21soldstatus $470,000
ⓘ Source: listings_history table (triggers on properties + properties_extension) + one-shot
backfill from property_details.listing_events for pre-trigger history.
Tax reassessment forecast NY · Partial reset (capped growth)
- Current annual tax
- $14,130 · $1,178/mo
- Projected year-2 tax
- $38,322 · $3,193/mo
- Expected delta
- +$24,192/yr (+$2,016/mo · 171.2%)
ⓘ Screening estimate from a state-policy table — verify with the county assessor before closing.
Climate risk First Street
- Flood 5/10 Major FEMA zone X (shaded) · 51% chance over 30 yrs
- Wildfire 1/10 Low
- Heat 4/10 Moderate 6 d/yr ≥90°F today · 16 d/yr by 30 yrs out
- Wind 8/10 Severe 80% chance of damaging wind over 30 yrs
- Air quality 4/10 Moderate 4 unhealthy d/yr today · 5 by 30 yrs out
Nearby sold comps map
Loading sold comps map…
Walkable amenities ~0.75 mi
Loading nearby amenities…
Taxation est. · year 1
- Rental income
- $263,086
- − Mortgage interest
- −$207,202
- − Property taxes
- −$14,130
- − Insurance
- −$18,495
- − Repairs & maintenance
- −$21,047
- − Management
- −$21,047
- − Depreciation
- −$107,607
- Taxable loss
- −$126,442
- Est. tax savings @ 24.0%
- +$30,346
- After-tax cash flow
- $-27,217/yr
For passive investors: Depreciation is non-cash, so a rental often shows a tax loss while cash-flowing — sheltering income. Rental losses are passive: they offset passive income freely, and up to $25,000/yr can offset ordinary (W-2) income if you actively participate and your MAGI is under $100k (phasing out to $0 by $150k); unused losses carry forward. On sale, claimed depreciation is recaptured at up to 25%, and gains may owe capital-gains tax (a 1031 exchange can defer both). Figures are a year-1 estimate at your 24.0% rate — not tax advice; consult a CPA.
Schools (NCES district)
- District
- Westhampton Beach Union Free School District
- NCES district ID
- 3631020
- Math proficiency
- 72% ▼ -5.00%
- Reading proficiency
- 75% ▲ 3.00%
- Median HH income
- $88,137
- Composite
- 65.91/100
- National rank
- #444
- State rank
- #81 of 590 in NY
Livability — Westhampton
- Score
- 60/100
- State rank
- #969
- US rank
- #18972
Category grades
Schools grade is shown separately in the Schools card above.
Census & demographics
- Census place
- Westhampton, NY
- County
- Suffolk County · 679,920 people
- City population
- 2,843
- Metro
- New York-Newark-Jersey City, NY-NJ-PA
- Population (ZIP)
- 2,843
- Household income
- $151,375
- Rent vs Own
- Severe rent burden
- 14.0
Population outlook (Suffolk County) Hauer SSP2
- Today (2025)
- 1,505,262 people
- By 2030
- 1,498,318 · -0.5%
- By 2040
- 1,471,101 · -2.3%
- By 2050
- 1,424,848 · -5.3%
- By 2075
- 1,337,157 · -11.2%
- By 2100
- 1,217,720 · -19.1%
Race, ethnicity, and origin ACS 2023
- Neighborhood character
- Predominantly White (89%)
- Race & ethnicity
- White 89% Hispanic / Latino 5% Asian 3% Two or more races 2%
- Hispanic origin (detail)
- Common ancestry
- Scotch-Irish 3% Romanian 3% Subsaharan African 1%
- Foreign-born
- 11% · Canada, South Korea
- Languages at home
- 89% English-only · Spanish 5% Other Indo-European 4% Korean 2%
Political lean MEDSL · Suffolk
- 2024 margin
- Lean R (+10.0) · D 45.0% · R 55.0%
- 2008→2024 swing
- -16.0pp toward R · 2008: 6.0pp · 2024: -10.0pp
- All cycles
- 2024: R+10.0 2020: R+0.0 2016: R+8.2 2012: D+2.9 2008: D+6.0
Not yet ingested
- Civics
- —
Market trends
- HPI YoY
- ▲ 8.82%
- Current HPI
- 391.8868
- Rent YoY
- —
- Metro
- New York-Newark-Jersey City, NY-NJ-PA
- State GDP YoY
- ▲ 2.60%
- F500 in state
- 92
Industry mix (Fortune 500 HQ in NY)
| Industry | F500 HQs | Revenue |
|---|---|---|
| Financial Services | 10 | $950B |
|
||
| Consumer Goods | 9 | $162B |
|
||
| Insurance | 4 | $225B |
|
||
| Telecommunications | 2 | $144B |
|
||
| Pharmaceuticals | 2 | $112B |
|
||
| Media / Entertainment | 2 | $69B |
|
||
Price history
+687.0% since first listed4 events — show timeline
- 2026-06-02 Pending — OneKey® MLS as Distributed by MLS Grid
- 2026-05-09 Listed $3,699,000 OneKey® MLS as Distributed by MLS Grid
- 1999-02-24 Sold (Public Records) $662,500 Public Records
- 1995-11-21 Sold (Public Records) $470,000 Public Records
Property tax history
+0.4%/yrLatest (2022): $14,130 · +0.0% YoY. Source: county tax records.
Cash-flow waterfall
monthlySold comps — $/sqft
last 12 mo · ≤1 miLoading sold comps…