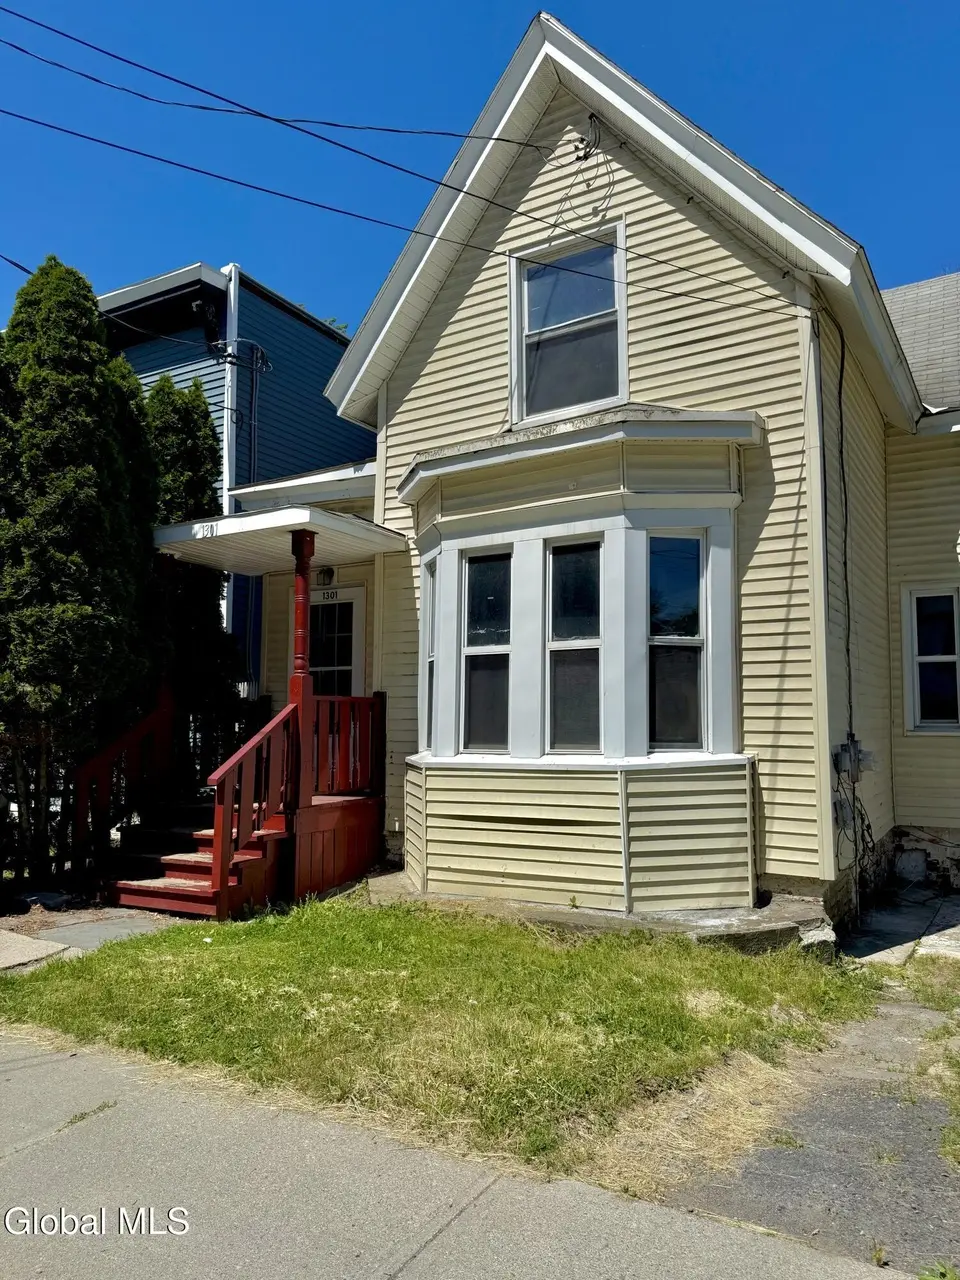
1301 Broadway · Rensselaer, NY
Flood risk 1/10 · Minimal
- FEMA flood zone
- X
- Chance of flooding over 30 yrs
- 0.0%
- Est. flood insurance / yr
- $473 – $860
Fire risk 3/10 · Minor
- Est. fire insurance / yr
- $691 – $1,283
Heat risk 4/10 · Minor
- Hot days now (above 97°F)
- 7 days/yr
- Hot days in 30 yrs
- 17 days/yr
Wind risk 3/10 · Minor
- Chance of severe wind over 30 yrs
- 6.0%
Air-quality risk 2/10 · Minimal
- Unhealthy air days now
- 0 days/yr
- Unhealthy air days in 30 yrs
- 1 days/yr
Risk factors via First Street. Map © Google.
Why this score? — see what drove the D grade
The composite is a weighted blend of 9 inputs, each scored 0–100. Each bar is that input's sub-score; the figure is the points it added to the 100-point composite (weight × sub-score).
- Cash flow +19.9/30.0
- DSCR +6.3/10.0
- 1% rule +5.2/10.0
- Livability +3.9/5.0
- Rent growth +2.7/5.0
- Schools +2.7/10.0
- Condition / age +2.5/5.0
- ARV discount +1.5/15.0
- Appreciation +0.0/10.0
$185,000
🖨 Deal sheet 📄 Offer letter ✓ Due diligence
Listing remarks MLS
Move in ready 3 bed 2 bath available now in Rensselaer! Central location in Rensselaer, minutes away from the train station and downtown Albany. Close to 787 and I90. Contingent on owners finding a new home.
Key facts
- New plumbing
- Fresh paint
- New flooring
Tags
Property features AI
Exterior
- Parking: Stone driveway with space for 2 vehicles
- Utilities: Public water; Public sewer
- Home design: Single family residence; Vinyl siding
- Construction: Vinyl siding construction
- Exterior features: Lot approximately 0.1 acre (about 4,356 sq ft)
Interior
- Kitchen: Gas oven; Refrigerator
- Bedrooms: One bedroom on the first level; Two bedrooms on the second level
- Bathrooms: 2 full bathrooms (one on the first level, one on the second level)
- Heating & cooling: Baseboard heating
- Interior features: 8 total rooms; Unfinished basement with exterior entry and walk-out access
- Laundry & utility: Washer and dryer; Laundry room in the basement
Neighborhood map
What this means for you Summary
Snapshot
- This is a 3-bed/2.0-bath single-family listed at $185k.
Deal economics
- At list price, monthly cash flow is $225 ($3k/yr) — positive.
- The deal already cash-flows at list — no discount required.
- Meets the 1% rule at list price ($2k rent vs $185k).
- Cap rate 7.8% vs local median 5.0% in Rensselaer — top-decile yield for the area; either an underpriced asset or a hidden risk that comps aren't pricing in. Stress-test before assuming the spread holds.
Location & tenants
- Location reads 77/100 on livability (#191 in NY, #2,967 nationally) — a middle-class / working-renter tenant base. Strengths: commute A+, housing A+, health & safety A+; Watch: schools C-, crime D+.
- Rensselaer City School District (suburban): math 28% / reading 34% proficiency, ranked #574 of 590 in NY (top 97%) — families likely to look elsewhere, expect single-tenant / working-renter base with shorter leases.
- Market conditions: Rents flat; 102 active listings in the ZIP; 35 comparable units currently listed for rent nearby; rentals at typical pace (median 23d on market — plan ~3-4 weeks tenant-placement turnaround); 43% of comp listings sitting > 30 days — soft ceiling on asking rent; solid renter incomes; 405 units permitted in Rensselaer County in 2024 (224 in 5+ unit buildings).
Forward outlook
- Local home prices are declining (-3.0%/yr); year-one equity from $1k of loan paydown is wiped out by about $6k of value loss. Plan a longer hold.
- Rensselaer County population projected to shrink 6% by 2050 — rents likely to lag national; underwrite the cash flow, not the appreciation.
Negotiation context
- Only 13 days on market — expect competitive offers; lowballing is unlikely to land.
- 5 sale attempts since 16y ago; this cycle's ask has dropped $10k (5%) from the opening price — seller is motivated, your offer sets the floor, not the list.
- Current owner paid $160k; 16% above their basis — modest negotiation headroom, anchor on the comps not their cost.
Risks & watch-outs
- Watch-outs: built in 1945 — expect roof / HVAC / electrical / plumbing capex.
Questions for the listing agent
- Built in 1945 — when were the roof, HVAC, electrical panel, plumbing, and water heater last replaced?
- Is there a deadline driving the sale (1031 exchange, divorce, estate, relocation)? That informs how much negotiation room exists.
- Crime grade is D in this area — have there been break-ins, vandalism, or insurance claims at this property in the last 3 years? What carrier currently insures it and at what premium?
- The area grade is low — what's the realistic commute time and amenity access for the typical tenant pool here? Any planned neighborhood developments (good or bad) we should know about?
- What's the average days-on-market for RENTAL listings here right now (not sales)? A rising rental-DOM trend means longer vacancies and softer asking-rent achievability than the comps imply.
- What's the recent tenant-quality profile in this submarket — average credit score on applications, eviction rate, late-payment / NSF rate, and stable-employment percentage? A property-management company in the area should have these aggregated.
- How much new for-sale + rental construction is in the pipeline within 1–3 miles? Heavy new supply typically softens prices + rents 12–24 months out; constrained supply supports both.
Investment metrics
- 1% rule
- 1.02% ✓
- Cap rate
- 7.75%
- Cash-on-cash
- 5.21%
- DSCR
- 1.23
- GRM
- 8.2
CMA / ARV
- ARV (on-the-fly)
- $163,370
- Comps found
- 11
Show comp detail 11 sales within ~0.75 mi
| Address | Dist | Beds/Ba | Sqft | Sold | Price | $/sf | Match |
|---|---|---|---|---|---|---|---|
| 1016 4th St | 0.29mi | 2/1.0 (-1) | 1,010 (+5%) | 4mo | $172,000 | $170 | 65 |
| 70 Fowler Ave | 0.35mi | 2/1.0 (-1) | 1,025 (+7%) | 4mo | $193,000 | $188 | 60 |
| 2 Patten Ave | 0.62mi | 3/1.0 | 1,010 (+5%) | 12mo | $171,000 | $169 | 48 |
| 1600 2nd St | 0.42mi | 2/1.0 (-1) | 891 (-7%) | 17mo | $140,000 | $157 | 45 |
| 1701 4th St | 0.50mi | 3/1.0 | 900 (-6%) | 22mo | $90,000 | $100 | 44 |
| 68 Elm St | 0.67mi | 3/1.0 | 880 (-8%) | 12mo | $55,000 | $63 | 40 |
| 1602 2nd St | 0.43mi | 2/1.0 (-1) | 860 (-10%) | 17mo | $77,500 | $90 | 39 |
| 68 Lawrence St | 0.66mi | 3/1.5 | 858 (-11%) | 14mo | $287,000 | $334 | 38 |
| 1822 7th St | 0.70mi | 3/1.0 | 1,097 (+14%) | 6mo | $219,900 | $200 | 34 |
| 1634 5th St | 0.52mi | 3/1.5 | 1,100 (+14%) | 20mo | $224,771 | $204 | 33 |
| 29 Chestnut St | 0.62mi | 2/1.0 (-1) | 816 (-15%) | 9mo | $149,900 | $184 | 30 |
Match score weights: distance 35% · size 25% · config 20% · recency 20%. Top-matched comps best support the ARV.
Projected returns pro-forma
-3.0% appreciation · 0.9% rent growth · sell at horizon
- IRR
- -10.6%
- Equity multiple
- 0.62×
- Total profit
- $-19,521
- Equity at exit
- $27,584
- IRR
- -4.5%
- Equity multiple
- 0.73×
- Total profit
- $-13,786
- Equity at exit
- $15,995
Cash invested: $51,800 (down + closing). Projections, not guarantees.
Landlord ↔ Tenant lean methodology
- Overall (STATE)
- 15 Strongly Tenant-Friendly
- State New York
- 15 Strongly Tenant-Friendly · D+10
- County
- — inherits STATE
- City
- — inherits STATE
ZIP-level market 12144
- Home prices YoY
- -33.4%
- Rents YoY
- 0.9%
- Active inventory
- 102
- Price-to-rent
- 8.2×
Monthly cashflow live
- Estimated rent
- $1,881 high interval (Pro) →
- Mortgage (P&I)
- −$970
- Tax from tax record
- −$214 /mo · $2,562/yr
- Insurance
- −$77
- HOA
- −$0
- Vacancy / Maint / Mgmt
- −$395
- Net cashflow
- $225
Break-even live
UW: 25.0% down · 7.5% · 30yr · 1.5% tax · 5.0% vac · 8.0% maint · 8.0% mgmt
Financing live
Cash to close
- Down payment
- $46,250
- Closing costs
- $5,550
- Reserves months
- —
- Total cash needed
- —
Loan-product check · same deal, 3 products live
Conventional
25% down · 7.5% · 30yr
- Down + closing
- —
- Monthly P&I
- —
- Monthly cashflow
- —
- DSCR
- —
- Eligible?
- —
Personal DTI + credit; lowest rate.
DSCR
20% down · 8.5% · 30yr
- Down + closing
- —
- Monthly P&I
- —
- Monthly cashflow
- —
- DSCR
- —
- Eligible?
- —
No personal income docs; deal must DSCR.
Hard money
10% down · 12.0% · 12mo
- Down + closing
- —
- Monthly P&I
- —
- Monthly cashflow
- —
- DSCR
- —
- Eligible?
- —
Short-term bridge; refi at stabilization.
Rent comps 35 comps
| Address | Beds | Baths | Sqft | Rent | $/sqft | DOM | Units | Dist |
|---|---|---|---|---|---|---|---|---|
| 1307 Broadway Rensselaer, NY | 2.0 | 1.0 | 1014 | $1,650 | $1.63 | 14d | 1 | 0.04mi |
| 1311 Broadway Rensselaer, NY | 2.0 | 1.0 | 1014 | $1,650 | $1.63 | 14d | 1 | 0.05mi |
| 1047 Broadway Rensselaer, NY | 2.0 | 1.0 | 1014 | $1,650 | $1.63 | 14d | 1 | 0.15mi |
| 934 Broadway Unit 1 Rensselaer, NY | 2.0 | 1.0 | 741 | $1,450 | $1.96 | 43d | 1 | 0.22mi |
| 1444 2nd St Unit 2 Rensselaer, NY | 4.0 | 1.0 | 950 | $1,900 | $2.00 | 43d | 1 | 0.24mi |
| 99 New Broadway Rensselaer, NY | 2.0 | 1.0–2.0 | 946 | $2,495 | $2.64 | 14d | 5 | 0.51mi |
| 37 Maiden Ln Albany, NY | 2.0 | 1.0 | 700 | $1,515 | $2.16 | 14d | 1 | 0.75mi |
| 883 Broadway Apt 201 Albany, NY | 2.0 | 1.0 | 980 | $1,450 | $1.48 | 23d | 1 | 0.77mi |
| 48 N Pearl St Albany, NY | 2.0 | 1.0–2.5 | 1251 | $3,500 | $2.80 | 14d | 17 | 0.77mi |
| 7 Elm Ct Rensselaer, NY | 1.0–2.0 | 1.0–2.0 | 829 | $1,830 | $2.21 | 14d | 1 | 0.86mi |
| 9 St Josephs Ter Albany, NY | 3.0 | 2.0 | 1000 | $1,850 | $1.85 | 43d | 1 | 0.88mi |
| 151 S Pearl St Albany, NY | 2.0 | 1.0 | 1000 | $1,600 | $1.60 | 14d | 1 | 1.01mi |
| 135 Madison Ave Unit 2 Albany, NY | 2.0 | 1.0 | 1000 | $1,400 | $1.40 | 43d | 1 | 1.02mi |
| 31 Van Zandt St Albany, NY | 2.0 | 1.0 | 850 | $1,700 | $2.00 | 43d | 1 | 1.04mi |
| 168 S Pearl St Albany, NY | 3.0 | 1.5 | 1044 | $1,800 | $1.72 | 23d | 1 | 1.04mi |
| 151 Madison Ave Unit C Albany, NY | 2.0 | 1.0 | 750 | $1,125 | $1.50 | 23d | 1 | 1.06mi |
| 103 Grand St Unit 1 Albany, NY | 2.0 | 1.0 | 800 | $1,250 | $1.56 | 14d | 1 | 1.12mi |
| 17 Ash Grove Pl Albany, NY | 2.0 | 1.0 | 800 | $1,400 | $1.75 | 43d | 1 | 1.13mi |
| 149 Jay St Albany, NY | 2.0 | 1.0 | 1000 | $1,750 | $1.75 | 43d | 1 | 1.31mi |
| 254 Sheridan Ave Unit 2 Albany, NY | 3.0 | 1.0 | 900 | $1,300 | $1.44 | 23d | 1 | 1.32mi |
| 110 Lark St Unit STREET-1 Albany, NY | 2.0 | 1.0 | 975 | $1,150 | $1.18 | 14d | 1 | 1.32mi |
| 110 Lark St Unit STREET-1 Albany, NY | 2.0 | 1.0 | 975 | $1,150 | $1.18 | 21d | 1 | 1.32mi |
| 156 Jay St Albany, NY | 2.0 | 1.0 | 600 | $1,200 | $2.00 | 43d | 1 | 1.34mi |
| 341 Madison Ave Albany, NY | 2.0 | 1.0 | 1000 | $1,800 | $1.80 | 14d | 1 | 1.38mi |
| 346 Madison Ave Unit 3 Albany, NY | 3.0 | 2.0 | 1110 | $2,725 | $2.45 | 43d | 1 | 1.40mi |
| 155 Chestnut St Albany, NY | 2.0 | 1.0 | 850 | $2,000 | $2.35 | 14d | 1 | 1.40mi |
| 199 Lark St Albany, NY | 3.0 | 1.0 | 1000 | $1,800 | $1.80 | 43d | 1 | 1.43mi |
| 132 4th Ave Albany, NY | 3.0 | 1.0 | 770 | $1,800 | $2.34 | 21d | 1 | 1.44mi |
| 4 Irving St Unit 2nd Floor Albany, NY | 3.0 | 1.0 | 1000 | $1,695 | $1.70 | 43d | 1 | 1.44mi |
| 33 Centre St Apt 3A Albany, NY | 2.0 | 1.0 | 975 | $1,925 | $1.97 | 21d | 1 | 1.46mi |
| 33 Centre St Apt 1D Albany, NY | 2.0 | 1.0 | 825 | $1,800 | $2.18 | 43d | 1 | 1.46mi |
| 33 Centre St Apt 1A Albany, NY | 2.0 | 1.0 | 885 | $1,825 | $2.06 | 14d | 1 | 1.46mi |
| 33 Centre St Apt 2A Albany, NY | 2.0 | 1.0 | 975 | $1,875 | $1.92 | 43d | 1 | 1.46mi |
| 33 Centre St Apt 2D Albany, NY | 2.0 | 1.0 | 1000 | $1,900 | $1.90 | 43d | 1 | 1.46mi |
| 336 Clinton Ave Albany, NY | 2.0 | 1.0 | 900 | $1,700 | $1.89 | 43d | 1 | 1.46mi |
Listing history 11 events
-
2026-06-18days on market $185,000 Active 13 DOM
-
2026-06-17days on market $185,000 Active 12 DOM
-
2026-06-16days on market $185,000 Active 11 DOM
-
2026-06-15price $185,000 Active 10 DOM
-
2026-06-15days on market $195,000 Active 10 DOM
-
2026-06-14days on market $195,000 Active 8 DOM
-
2026-06-10days on market $195,000 Active 5 DOM
-
2026-06-09days on market $195,000 Active 4 DOM
-
2026-06-08days on market $195,000 Active 3 DOM
-
2026-06-07remarks 443-char remark
-
2026-06-07$195,000 Active 2 DOM
ⓘ Source: listings_history table (triggers on properties + properties_extension) + one-shot
backfill from property_details.listing_events for pre-trigger history.
Tax reassessment forecast NY · Partial reset (capped growth)
- Current annual tax
- $2,562 · $214/mo
- Projected year-2 tax
- $2,844 · $237/mo
- Expected delta
- +$282/yr (+$24/mo · 11.0%)
ⓘ Screening estimate from a state-policy table — verify with the county assessor before closing.
Climate risk First Street
- Flood 1/10 Low FEMA zone X · 0% chance over 30 yrs
- Wildfire 3/10 Moderate
- Heat 4/10 Moderate 7 d/yr ≥97°F today · 17 d/yr by 30 yrs out
- Wind 3/10 Moderate 6% chance of damaging wind over 30 yrs
- Air quality 2/10 Low 0 unhealthy d/yr today · 1 by 30 yrs out
Nearby sold comps map
Loading sold comps map…
Walkable amenities ~0.75 mi
Loading nearby amenities…
Taxation est. · year 1
- Rental income
- $22,569
- − Mortgage interest
- −$10,363
- − Property taxes
- −$2,562
- − Insurance
- −$925
- − Repairs & maintenance
- −$1,806
- − Management
- −$1,806
- − Depreciation
- −$5,382
- Taxable loss
- −$274
- Est. tax savings @ 24.0%
- +$66
- After-tax cash flow
- $2,766/yr
For passive investors: Depreciation is non-cash, so a rental often shows a tax loss while cash-flowing — sheltering income. Rental losses are passive: they offset passive income freely, and up to $25,000/yr can offset ordinary (W-2) income if you actively participate and your MAGI is under $100k (phasing out to $0 by $150k); unused losses carry forward. On sale, claimed depreciation is recaptured at up to 25%, and gains may owe capital-gains tax (a 1031 exchange can defer both). Figures are a year-1 estimate at your 24.0% rate — not tax advice; consult a CPA.
Schools (NCES district)
- District
- Rensselaer City School District
- NCES district ID
- 3624450
- Math proficiency
- 28% ▼ -2.00%
- Reading proficiency
- 34% ▼ -1.00%
- Median HH income
- $48,665
- Composite
- 26.89/100
- National rank
- #7096
- State rank
- #574 of 590 in NY
Livability — Rensselaer
- Score
- 77/100
- State rank
- #191
- US rank
- #2967
Category grades
Schools grade is shown separately in the Schools card above.
Census & demographics
- Census place
- Rensselaer, NY
- County
- Rensselaer County · 75,590 people
- City population
- 22,111
- Metro
- Albany-Schenectady-Troy, NY
- Population (ZIP)
- 22,111
- Household income
- $90,738
- Rent vs Own
- Severe rent burden
- 541.0
Population outlook (Rensselaer County) Hauer SSP2
- Today (2025)
- 162,400 people
- By 2030
- 161,746 · -0.4%
- By 2040
- 158,095 · -2.7%
- By 2050
- 152,966 · -5.8%
- By 2075
- 140,767 · -13.3%
- By 2100
- 124,727 · -23.2%
Race, ethnicity, and origin ACS 2023
- Neighborhood character
- Predominantly White (76%)
- Race & ethnicity
- White 76% Two or more races 8% Asian 7% Hispanic / Latino 6% Black 6%
- Hispanic origin (detail)
- Puerto Rican 4%
- Common ancestry
- Romanian 7% Lithuanian 6% Iranian 3%
- Foreign-born
- 7% · Philippines, Canada, China
- Languages at home
- 91% English-only · Other Asian/Pacific 3% Spanish 2% Chinese 1%
Political lean MEDSL · Rensselaer
- 2024 margin
- Toss-up / Even · D 50.7% · R 49.3%
- 2008→2024 swing
- -8.0pp toward R · 2008: 9.3pp · 2024: 1.4pp
- All cycles
- 2024: D+1.4 2020: D+5.6 2016: R+2.9 2012: D+11.8 2008: D+9.3
Not yet ingested
- Civics
- —
Market trends
- HPI YoY
- ▼ -138.26%
- Current HPI
- 276.2239
- Rent YoY
- ▲ 0.90%
- Metro
- Albany-Schenectady-Troy, NY
- State GDP YoY
- ▲ 2.60%
- F500 in state
- 92
Industry mix (Fortune 500 HQ in NY)
| Industry | F500 HQs | Revenue |
|---|---|---|
| Financial Services | 10 | $950B |
|
||
| Consumer Goods | 9 | $162B |
|
||
| Insurance | 4 | $225B |
|
||
| Telecommunications | 2 | $144B |
|
||
| Pharmaceuticals | 2 | $112B |
|
||
| Media / Entertainment | 2 | $69B |
|
||
Price history
+306.2% since first listed16 events — show timeline
- 2026-06-05 Listed $195,000 Global MLS
- 2023-10-02 Sold (MLS) $160,000 Global MLS
- 2023-09-26 Sold (Public Records) $160,000 Public Records
- 2023-08-10 Pending — Global MLS
- 2023-05-22 Listed $189,000 Global MLS
- 2016-08-03 Sold (Public Records) $39,000 Public Records
- 2016-07-29 Sold (MLS) $39,000 Global MLS
- 2016-04-30 Pending — Global MLS
- 2015-12-09 Listed $54,900 Global MLS
- 2015-10-14 Pending — Global MLS
- 2015-10-01 Listing Removed — Global MLS
- 2015-09-09 Listed $54,000 Global MLS
- 2010-11-12 Sold (MLS) $17,000 Global MLS
- 2010-10-18 Listing Removed — Global MLS
- 2010-09-21 Listed $24,000 Global MLS
- 1993-09-16 Sold (Public Records) $48,000 Public Records
Property tax history
+7.4%/yrLatest (2025): $2,562 · -3.2% YoY. Source: county tax records.
Cash-flow waterfall
monthlySold comps — $/sqft
last 12 mo · ≤1 miLoading sold comps…