 Multi-family
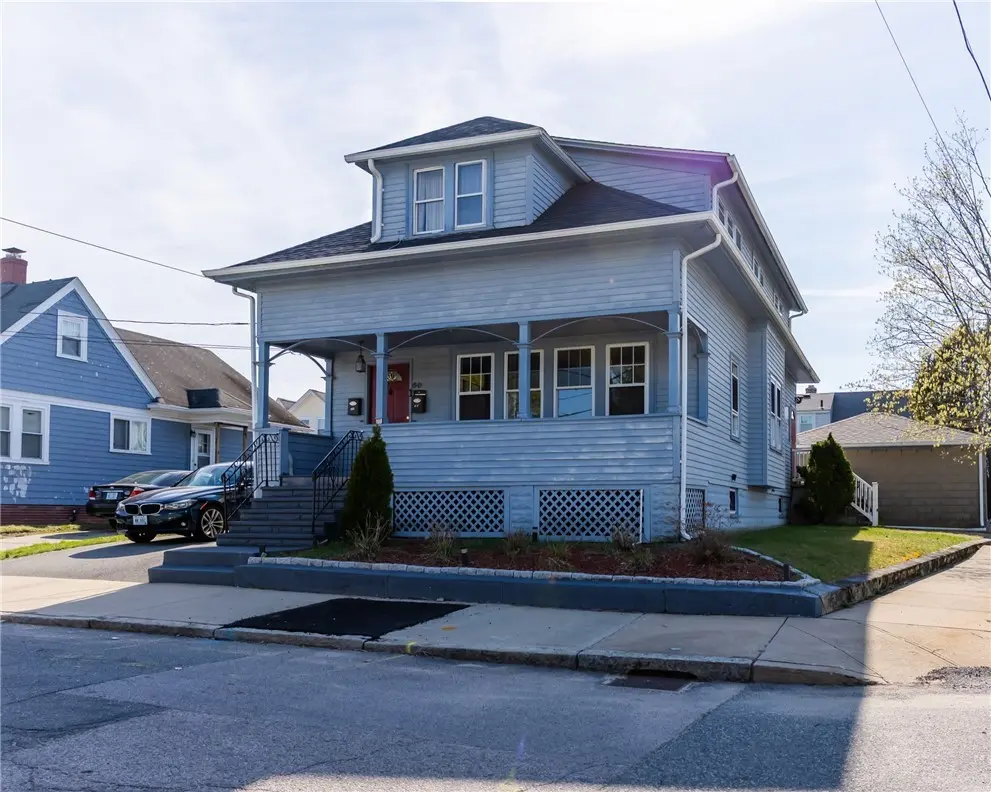
50 Pendleton St · Cranston, RI
Flood risk 1/10 · Minimal
- FEMA flood zone
- X (unshaded)
- Chance of flooding over 30 yrs
- 0.0%
- Est. flood insurance / yr
- $507 – $1,088
Fire risk 1/10 · Minimal
- Est. fire insurance / yr
- $835 – $1,551
Heat risk 6/10 · Moderate
- Hot days now (above 96°F)
- 7 days/yr
- Hot days in 30 yrs
- 15 days/yr
Wind risk 6/10 · Moderate
- Chance of severe wind over 30 yrs
- 71.0%
Air-quality risk 2/10 · Minimal
- Unhealthy air days now
- 1 days/yr
- Unhealthy air days in 30 yrs
- 2 days/yr
Risk factors via First Street. Map © Google.
Why this score? — see what drove the D grade
The composite is a weighted blend of 9 inputs, each scored 0–100. Each bar is that input's sub-score; the figure is the points it added to the 100-point composite (weight × sub-score).
- ARV discount +15.0/15.0
- Cash flow +10.7/30.0
- Livability +4.4/5.0
- DSCR +3.1/10.0
- Rent growth +3.1/5.0
- 1% rule +2.5/10.0
- Condition / age +2.5/5.0
- Schools +2.3/10.0
- Appreciation +0.0/10.0
$519,000
🖨 Deal sheet 📄 Offer letter ✓ Due diligence
Multi-family units
County records classify this as Multi-Family (2-4 Unit). Listing-text estimate: 1 unit. estimate disagrees with records
Listing remarks MLS
Well-located multi-family in Cranston, RI offering both convenience and opportunity. Situated near schools, shopping, and everyday amenities, with easy highway access to Downtown Providence, Pawtucket, and Boston (northbound), as well as quick routes heading south. Set in a quiet neighborhood, this property is ideal for someone looking to step into their first investment or build long-term value. Whether you choose to live in one unit and rent the other, or lease both units, the flexibility is there. The property also features a detached two-car garage and a private backyard that's perfect for entertaining or creating a comfortable outdoor space.
Key facts
- Private backyard
- Quiet neighborhood
- Easy highway access
Tags
Neighborhood map
What this means for you Summary
Snapshot
- This is a 4-bed/2.0-bath multifamily listed at $519k.
Deal economics
- At list price, monthly cash flow is $-248 ($-3k/yr) — negative.
- To cash-flow at today's rent, offer at most $475k (8.4% below list).
- To meet the 1% rule (rent ≥ 1% of price), the offer needs to be $389k (25.0% below list).
- Recommended offer: $389k (25.0% below list) — sets the bar for 1% rule.
- Cap rate 5.7% vs local median 3.3% in Cranston — top-decile yield for the area; either an underpriced asset or a hidden risk that comps aren't pricing in. Stress-test before assuming the spread holds.
Location & tenants
- Location reads 87/100 on livability (#1 in RI, #323 nationally) — a professional / high-income tenant draw. Strengths: crime A+, employment A+, housing A+.
- Cranston (suburban): math 16% / reading 35% proficiency, ranked #23 of 39 in RI (top 59%) — low school quality limits family demand, transient renter base, plan for 1-2y turnover.
- Market conditions: Rents rising (+2.4%/yr); 124 active listings in the ZIP; 9 comparable units currently listed for rent nearby; rentals at typical pace (median 24d on market — plan ~3-4 weeks tenant-placement turnaround); solid renter incomes; 776 units permitted in Providence County in 2024 (229 in 5+ unit buildings).
- At $3,891/mo this rent would consume 58% of the median local household income ($81k/yr) (locally 985% of renters already pay >50% of income on rent) — very limited rent-growth headroom before tenants either downsize or default.
Forward outlook
- Local home prices are declining (-3.0%/yr); year-one equity from $4k of loan paydown is wiped out by about $16k of value loss. Plan a longer hold.
- Providence County population projected at +5% by 2050 — modest demand growth; plan on rents tracking national, not racing it.
Negotiation context
- It's been on market 33 days — a 3% lower offer ($503k) is reasonable based on typical stale-listing flexibility.
- 6 sale attempts since 31y ago with the ask held roughly flat each time — persistent listings suggest the price (not the market) is what's stuck; bring a comps-based counter.
- Current owner paid $437k; 19% above their basis — modest negotiation headroom, anchor on the comps not their cost.
Risks & watch-outs
- Watch-outs: built in 1924 — expect roof / HVAC / electrical / plumbing capex.
- Climate carrying-cost: major wind risk, 71% chance of damaging wind over 30y; extreme-heat days projected 7→15/yr by 2055 (HVAC capex compounding) — expect insurance premiums to compound above CPI over the hold.
Questions for the listing agent
- What do current leases actually rent for vs. the listed asking? Can we see a recent rent roll and the last 12 months of T-12 income?
- It's been on market 33 days. Have you received any prior offers? Is the seller open to a 25% concession, seller financing, or rate buy-down credit?
- Built in 1924 — when were the roof, HVAC, electrical panel, plumbing, and water heater last replaced?
- Is there a deadline driving the sale (1031 exchange, divorce, estate, relocation)? That informs how much negotiation room exists.
- The area grade is low — what's the realistic commute time and amenity access for the typical tenant pool here? Any planned neighborhood developments (good or bad) we should know about?
- What's the average days-on-market for RENTAL listings here right now (not sales)? A rising rental-DOM trend means longer vacancies and softer asking-rent achievability than the comps imply.
- What's the recent tenant-quality profile in this submarket — average credit score on applications, eviction rate, late-payment / NSF rate, and stable-employment percentage? A property-management company in the area should have these aggregated.
- How much new apartment / multifamily construction is in the pipeline within 1–3 miles? Heavy new supply (>2% of stock underway) typically softens rents 12–24 months out; light construction supports rent growth.
Investment metrics
- 1% rule
- 0.75% ✗
- Cap rate
- 5.72%
- Cash-on-cash
- -2.05%
- DSCR
- 0.91
- GRM
- 11.1
CMA / ARV
- ARV (median comp)
- $655,389
- List price
- $519,000
- Delta
- -20.81%
- Verdict
- UNDERPRICED
- Comps
- 20 within 1.0 mi
Show comp detail 12 sales within ~0.75 mi
| Address | Dist | Beds/Ba | Sqft | Sold | Price | $/sf | Match |
|---|---|---|---|---|---|---|---|
| 761 Dyer Ave | 0.25mi | 5/3.5 (+1) | 1,663 (+2%) | 2mo | $360,000 | $216 | 73 |
| 749 Dyer Ave | 0.25mi | 4/2.5 | 1,663 (+2%) | 23mo | $325,000 | $195 | 64 |
| 83 Princess Ave | 0.11mi | 4/2.0 | 1,472 (-10%) | 19mo | $455,000 | $309 | 62 |
| 105 Princess Ave | 0.09mi | 5/2.0 (+1) | 1,847 (+13%) | 10mo | $605,000 | $328 | 60 |
| 13 14 Pine St | 0.50mi | 4/2.0 | 1,782 (+9%) | 2mo | $480,000 | $269 | 60 |
| 598 Laurel Hill Ave | 0.31mi | 3/2.0 (-1) | 1,800 (+10%) | 9mo | $455,000 | $253 | 56 |
| 69 Whipple Ave | 0.71mi | 4/2.0 | 1,719 (+5%) | 4mo | $543,000 | $316 | 55 |
| 65 Bain St | 0.67mi | 4/2.0 | 1,580 (-3%) | 15mo | $450,000 | $285 | 50 |
| 51 Maple St | 0.53mi | 4/3.0 | 1,663 (+2%) | 22mo | $400,000 | $241 | 50 |
| 9 St. Mary's Dr | 0.62mi | 4/2.0 | 1,773 (+8%) | 12mo | $505,000 | $285 | 47 |
| 11 Browne St | 0.68mi | 4/2.0 | 1,876 (+15%) | 2mo | $565,000 | $301 | 42 |
| 210 -212 Crescent Ave | 0.61mi | 5/2.0 (+1) | 1,843 (+13%) | 6mo | $540,000 | $293 | 40 |
Match score weights: distance 35% · size 25% · config 20% · recency 20%. Top-matched comps best support the ARV.
Projected returns pro-forma
-3.0% appreciation · 2.42% rent growth · sell at horizon
- IRR
- -20.3%
- Equity multiple
- 0.30×
- Total profit
- $-102,255
- Equity at exit
- $77,385
- IRR
- -14.7%
- Equity multiple
- 0.18×
- Total profit
- $-118,958
- Equity at exit
- $44,874
Cash invested: $145,320 (down + closing). Projections, not guarantees.
Landlord ↔ Tenant lean methodology
- Overall (STATE)
- 31 Tenant-Leaning
- State Rhode Island
- 31 Tenant-Leaning · D+8
- County
- — inherits STATE
- City
- — inherits STATE
ZIP-level market 02920
- Rents YoY
- 2.4%
- Active inventory
- 124
- Price-to-rent
- 22.2×
Monthly cashflow live
- Estimated rent
- $3,891 high interval (Pro) →
- Mortgage (P&I)
- −$2,722
- Tax from tax record
- −$384 /mo · $4,607/yr
- Insurance
- −$216
- HOA
- −$0
- Vacancy / Maint / Mgmt
- −$817
- Net cashflow
- $-248
Break-even live
2-unit breakdown (identical units grouped — click to expand)
| Units | Beds | Baths | Est. rent |
|---|---|---|---|
| 2× units | 2 | 1 | $3,892 |
| #1 | 2 | 1 | $1,946 |
| #2 | 2 | 1 | $1,946 |
| Total (2 units) | $3,891 | ||
UW: 25.0% down · 7.5% · 30yr · 1.5% tax · 5.0% vac · 8.0% maint · 8.0% mgmt
Financing live
Cash to close
- Down payment
- $129,750
- Closing costs
- $15,570
- Reserves months
- —
- Total cash needed
- —
Loan-product check · same deal, 3 products live
Conventional
25% down · 7.5% · 30yr
- Down + closing
- —
- Monthly P&I
- —
- Monthly cashflow
- —
- DSCR
- —
- Eligible?
- —
Personal DTI + credit; lowest rate.
DSCR
20% down · 8.5% · 30yr
- Down + closing
- —
- Monthly P&I
- —
- Monthly cashflow
- —
- DSCR
- —
- Eligible?
- —
No personal income docs; deal must DSCR.
Hard money
10% down · 12.0% · 12mo
- Down + closing
- —
- Monthly P&I
- —
- Monthly cashflow
- —
- DSCR
- —
- Eligible?
- —
Short-term bridge; refi at stabilization.
Rent comps 9 comps
| Address | Beds | Baths | Sqft | Rent | $/sqft | DOM | Units | Dist |
|---|---|---|---|---|---|---|---|---|
| 1303 Cranston St Unit 1 Cranston, RI | 3.0 | 1.0 | 1356 | $2,750 | $2.03 | 43d | 1 | 0.15mi |
| 718 Dyer Ave Cranston, RI | 3.0 | 1.5 | 1250 | $1,900 | $1.52 | 17d | 1 | 0.23mi |
| 718 Dyer Ave Cranston, RI | 3.0 | 1.5 | 1233 | $1,900 | $1.54 | 23d | 1 | 0.23mi |
| 216 Maplewood Ave Cranston, RI | 3.0 | 1.5 | 1850 | $2,200 | $1.19 | 43d | 1 | 0.76mi |
| 8 Anthony Ave Unit 1 Providence, RI | 3.0 | 2.0 | 1400 | $2,800 | $2.00 | 14d | 1 | 1.14mi |
| 35 Stadden St Unit 2/3 Providence, RI | 3.0 | 1.5 | 1900 | $2,600 | $1.37 | 17d | 1 | 1.26mi |
| 120 Pontiac Ave Unit 1 Cranston, RI | 3.0 | 1.0 | 1320 | $2,500 | $1.89 | 43d | 1 | 1.27mi |
| 29 Dunford St Unit 2 Providence, RI | 3.0 | 2.0 | 1116 | $2,400 | $2.15 | 23d | 1 | 1.38mi |
| 56 Greenwich St Unit 1 Providence, RI | 3.0 | 2.0 | 1400 | $2,800 | $2.00 | 23d | 1 | 1.43mi |
Listing history 19 events
-
2026-05-14price $519,000 654-char remark
Show marketing remark (654 chars)
Well-located multi-family in Cranston, RI offering both convenience and opportunity. Situated near schools, shopping, and everyday amenities, with easy highway access to Downtown Providence, Pawtucket, and Boston (northbound), as well as quick routes heading south. Set in a quiet neighborhood, this property is ideal for someone looking to step into their first investment or build long-term value. Whether you choose to live in one unit and rent the other, or lease both units, the flexibility is there. The property also features a detached two-car garage and a private backyard that's perfect for entertaining or creating a comfortable outdoor space.
-
2026-04-16$529,000 Active 654-char remark
Show marketing remark (654 chars)
Well-located multi-family in Cranston, RI offering both convenience and opportunity. Situated near schools, shopping, and everyday amenities, with easy highway access to Downtown Providence, Pawtucket, and Boston (northbound), as well as quick routes heading south. Set in a quiet neighborhood, this property is ideal for someone looking to step into their first investment or build long-term value. Whether you choose to live in one unit and rent the other, or lease both units, the flexibility is there. The property also features a detached two-car garage and a private backyard that's perfect for entertaining or creating a comfortable outdoor space.
-
2022-06-23soldstatus $437,000 Closed 213-char remark
Show marketing remark (213 chars)
Special 2 family home. The home sits on a corner lot with a detached garage. A lot of mechanical & cosmetic updates. Newer roof and window. Hardwood floors through the home. Separate utilities for both units
-
2022-04-18historical Active Under Contract 213-char remark
Show marketing remark (213 chars)
Special 2 family home. The home sits on a corner lot with a detached garage. A lot of mechanical & cosmetic updates. Newer roof and window. Hardwood floors through the home. Separate utilities for both units
-
2022-04-18$435,000 Active 213-char remark
Show marketing remark (213 chars)
Special 2 family home. The home sits on a corner lot with a detached garage. A lot of mechanical & cosmetic updates. Newer roof and window. Hardwood floors through the home. Separate utilities for both units
-
2022-02-15soldstatus $350,000
-
2021-12-01soldstatus $315,000 Closed
-
2021-12-01soldstatus $315,000
-
2021-11-10status Pending
-
2021-11-05$300,000 Active
-
2021-10-06status Pending
-
2021-10-06historical
-
2021-10-01$300,000 Active
-
2005-02-18soldstatus $277,000
-
2005-02-18soldstatus $277,000
-
2005-01-11historical
-
2004-11-22$284,900
-
1996-07-03soldstatus $77,500
-
1995-11-20$84,500
ⓘ Source: listings_history table (triggers on properties + properties_extension) + one-shot
backfill from property_details.listing_events for pre-trigger history.
Tax reassessment forecast RI · Partial reset (capped growth)
- Current annual tax
- $4,607 · $384/mo
- Projected year-2 tax
- $6,533 · $544/mo
- Expected delta
- +$1,926/yr (+$161/mo · 41.8%)
ⓘ Screening estimate from a state-policy table — verify with the county assessor before closing.
Climate risk First Street
- Flood 1/10 Low FEMA zone X (unshaded) · 0% chance over 30 yrs
- Wildfire 1/10 Low
- Heat 6/10 Major 7 d/yr ≥96°F today · 15 d/yr by 30 yrs out
- Wind 6/10 Major 71% chance of damaging wind over 30 yrs
- Air quality 2/10 Low 1 unhealthy d/yr today · 2 by 30 yrs out
Nearby sold comps map
Loading sold comps map…
Walkable amenities ~0.75 mi
Loading nearby amenities…
Taxation est. · year 1
- Rental income
- $46,692
- − Mortgage interest
- −$29,072
- − Property taxes
- −$4,607
- − Insurance
- −$2,595
- − Repairs & maintenance
- −$3,735
- − Management
- −$3,735
- − Depreciation
- −$15,098
- Taxable loss
- −$12,151
- Est. tax savings @ 24.0%
- +$2,916
- After-tax cash flow
- $-59/yr
For passive investors: Depreciation is non-cash, so a rental often shows a tax loss while cash-flowing — sheltering income. Rental losses are passive: they offset passive income freely, and up to $25,000/yr can offset ordinary (W-2) income if you actively participate and your MAGI is under $100k (phasing out to $0 by $150k); unused losses carry forward. On sale, claimed depreciation is recaptured at up to 25%, and gains may owe capital-gains tax (a 1031 exchange can defer both). Figures are a year-1 estimate at your 24.0% rate — not tax advice; consult a CPA.
Schools (NCES district)
- District
- Cranston
- NCES district ID
- 4400240
- Math proficiency
- 16% ▼ -11.00%
- Reading proficiency
- 35% ▼ -7.00%
- Median HH income
- $60,070
- Composite
- 23.36/100
- National rank
- #7910
- State rank
- #23 of 39 in RI
Livability — Cranston
- Score
- 87/100
- State rank
- #1
- US rank
- #323
Category grades
Schools grade is shown separately in the Schools card above.
Census & demographics
- Census place
- Cranston, RI
- County
- Providence County · 548,917 people
- City population
- 72,803
- Metro
- Providence-Warwick, RI-MA
- Population (ZIP)
- 37,155
- Household income
- $80,717
- Rent vs Own
- Severe rent burden
- 985.0
Population outlook (Providence County) Hauer SSP2
- Today (2025)
- 653,469 people
- By 2030
- 660,819 · +1.1%
- By 2040
- 672,747 · +3.0%
- By 2050
- 683,741 · +4.6%
- By 2075
- 720,435 · +10.2%
- By 2100
- 741,582 · +13.5%
Race, ethnicity, and origin ACS 2023
- Neighborhood character
- Majority White (65%)
- Race & ethnicity
- White 65% Hispanic / Latino 18% Two or more races 8% Asian 7% Black 7%
- Hispanic origin (detail)
- Puerto Rican 4% Dominican 6%
- Common ancestry
- Lithuanian 6% Russian 5% Slovak 2%
- Foreign-born
- 16% · Canada, China
- Languages at home
- 73% English-only · Spanish 15% Other Indo-European 5% French/Haitian/Cajun 2%
Political lean MEDSL · Providence
- 2024 margin
- D (+14.4) · D 56.1% · R 41.7% · Other 2.2%
- 2008→2024 swing
- -20.0pp toward R · 2008: 34.4pp · 2024: 14.4pp
- All cycles
- 2024: D+14.4 2020: D+22.9 2016: D+21.2 2012: D+34.9 2008: D+34.4
Not yet ingested
- Civics
- —
Market trends
- HPI YoY
- ▼ -449.22%
- Current HPI
- 334.2336
- Rent YoY
- ▲ 2.42%
- Metro
- Providence-Warwick, RI-MA
- State GDP YoY
- ▲ 2.25%
- F500 in state
- 10
Industry mix (Fortune 500 HQ in RI)
| Industry | F500 HQs | Revenue |
|---|---|---|
| Healthcare | 1 | $373B |
|
||
| Food Distribution | 1 | $31B |
|
||
| Aerospace / Defense | 1 | $14B |
|
||
| Financial Services | 1 | $8B |
|
||
| Consumer Goods | 1 | $4B |
|
||
Price history
+514.2% since first listed19 events — show timeline
- 2026-05-14 Price Changed $519,000 RIS
- 2026-04-16 Listed $529,000 RIS
- 2022-06-23 Sold (MLS) $437,000 RIS
- 2022-04-18 Contingent — RIS
- 2022-04-18 Listed $435,000 RIS
- 2022-02-15 Sold (Public Records) $350,000 Public Records
- 2021-12-01 Sold (Public Records) $315,000 Public Records
- 2021-12-01 Sold (MLS) $315,000 RIS
- 2021-11-10 Pending — RIS
- 2021-11-05 Listed $300,000 RIS
- 2021-10-06 Pending — RIS
- 2021-10-06 Listing Removed — RIS
- 2021-10-01 Listed $300,000 RIS
- 2005-02-18 Sold (Public Records) $277,000 Public Records
- 2005-02-18 Sold (MLS) $277,000 RIS
- 2005-01-11 Listing Removed — RIS
- 2004-11-22 Listed $284,900 RIS
- 1996-07-03 Sold (MLS) $77,500 RIS
- 1995-11-20 Listed $84,500 RIS
Property tax history
+2.8%/yrLatest (2025): $4,607 · +2.0% YoY. Source: county tax records.
Cash-flow waterfall
monthlySold comps — $/sqft
last 12 mo · ≤1 miLoading sold comps…