 🏷️ Likely Rental
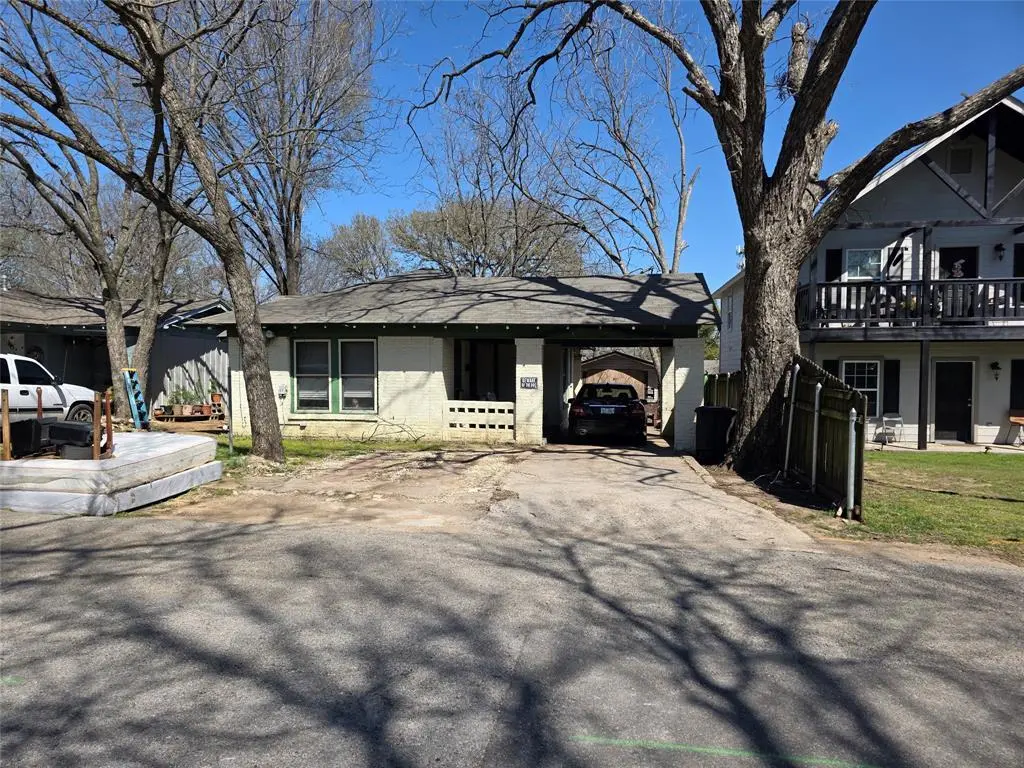
305 S Wood St · Cleburne, TX
Flood risk 4/10 · Minor
- FEMA flood zone
- X (unshaded)
- Chance of flooding over 30 yrs
- 0.22%
- Est. flood insurance / yr
- $507 – $1,088
Fire risk 5/10 · Moderate
- Est. fire insurance / yr
- $1,222 – $2,270
Heat risk 7/10 · Major
- Hot days now (above 109°F)
- 7 days/yr
- Hot days in 30 yrs
- 24 days/yr
Wind risk 6/10 · Moderate
- Chance of severe wind over 30 yrs
- 27.0%
Air-quality risk 2/10 · Minimal
- Unhealthy air days now
- 1 days/yr
- Unhealthy air days in 30 yrs
- 2 days/yr
Risk factors via First Street. Map © Google.
Why this score? — see what drove the C- grade
The composite is a weighted blend of 9 inputs, each scored 0–100. Each bar is that input's sub-score; the figure is the points it added to the 100-point composite (weight × sub-score).
- Cash flow +17.0/30.0
- ARV discount +15.0/15.0
- DSCR +5.3/10.0
- 1% rule +4.6/10.0
- Livability +3.4/5.0
- Schools +2.9/10.0
- Condition / age +2.5/5.0
- Rent growth +2.3/5.0
- Appreciation +0.0/10.0
$139,900
🖨 Deal sheet 📄 Offer letter ✓ Due diligence
Listing remarks MLS
So many options. Full of possibilities and packed with potential, this 2-bedroom, 1-bath, 1 car carport home in Cleburne can be yours. Whether you’re looking for your 1st home, wanting to down size or build your investor portfolio. This home is ready for a new owner to add their personal touch and restore its full sparkle. Home features a large kitchen. Utility room for full washer and dryer. Nice fenced backyard. Conveniently located near schools, parks, shopping, and downtown amenities. Home is occupied by long time tenant. Home can also be packaged with 5 other homes that are offered for sale as well. All MLS# for properties offer for sale 21206881, 21211282, 21211302, 21214411. 21214430 and 21214445. Home and property are being sold “as-is” “where-is”.
Key facts
- Near schools
- Near shopping
- Large kitchen
Tags
Neighborhood map
What this means for you Summary
Snapshot
- This is a 2-bed/1.0-bath single-family listed at $140k.
Deal economics
- At list price, monthly cash flow is $96 ($1k/yr) — positive.
- The deal already cash-flows at list — no discount required.
- To meet the 1% rule (rent ≥ 1% of price), the offer needs to be $134k (4.1% below list).
- Recommended offer: $132k (6.0% below list) — sets the bar for market timing.
- Cap rate 7.1% vs local median 3.6% in Cleburne — top-decile yield for the area; either an underpriced asset or a hidden risk that comps aren't pricing in. Stress-test before assuming the spread holds.
Location & tenants
- Location reads 68/100 on livability (#460 in TX) — a middle-class / working-renter tenant base. Strengths: cost of living A+, housing A+, health & safety A+; Watch: employment C-, schools F, amenities F.
- Cleburne ISD (town): math 34% / reading 33% proficiency, ranked #537 of 826 in TX (top 65%) — families likely to look elsewhere, expect single-tenant / working-renter base with shorter leases.
- Market conditions: Rents soft (-0.8%/yr); 660 active listings in the ZIP; 27 comparable units currently listed for rent nearby; rentals at typical pace (median 25d on market — plan ~3-4 weeks tenant-placement turnaround); solid renter incomes; 2,152 units permitted in Johnson County in 2024 (76 in 5+ unit buildings).
Forward outlook
- Local home prices are declining (-3.0%/yr); year-one equity from $967 of loan paydown is wiped out by about $4k of value loss. Plan a longer hold.
- Johnson County population projected at +24% by 2050 — long-run rental-demand tailwind backs the buy-and-hold thesis.
Negotiation context
- It's been on market 90 days — a 6% lower offer ($132k) is reasonable based on typical stale-listing flexibility.
Risks & watch-outs
- Watch-outs: built in 1910 — expect roof / HVAC / electrical / plumbing capex.
- Climate carrying-cost: major wind risk, 27% chance of damaging wind over 30y; moderate wildfire risk; extreme-heat days projected 7→24/yr by 2055 (HVAC capex compounding) — expect insurance premiums to compound above CPI over the hold.
Questions for the listing agent
- It's been on market 90 days. Have you received any prior offers? Is the seller open to a 6% concession, seller financing, or rate buy-down credit?
- Built in 1910 — when were the roof, HVAC, electrical panel, plumbing, and water heater last replaced?
- Why hasn't it sold? Are there any deal-killer items the seller is aware of (foundation, flood, title, zoning, code violations)?
- Is there a deadline driving the sale (1031 exchange, divorce, estate, relocation)? That informs how much negotiation room exists.
- Schools are F-rated, which usually means shorter tenancies and higher turnover. Who's the typical renter profile here, and what's been the actual vacancy rate?
- What's the average days-on-market for RENTAL listings here right now (not sales)? A rising rental-DOM trend means longer vacancies and softer asking-rent achievability than the comps imply.
- What's the recent tenant-quality profile in this submarket — average credit score on applications, eviction rate, late-payment / NSF rate, and stable-employment percentage? A property-management company in the area should have these aggregated.
- How much new for-sale + rental construction is in the pipeline within 1–3 miles? Heavy new supply typically softens prices + rents 12–24 months out; constrained supply supports both.
Investment metrics
- 1% rule
- 0.96% ✗
- Cap rate
- 7.11%
- Cash-on-cash
- 2.93%
- DSCR
- 1.13
- GRM
- 8.7
CMA / ARV
- ARV (median comp)
- $190,308
- List price
- $139,900
- Delta
- -26.49%
- Verdict
- UNDERPRICED
- Comps
- 20 within 1.0 mi
Show comp detail 12 sales within ~0.75 mi
| Address | Dist | Beds/Ba | Sqft | Sold | Price | $/sf | Match |
|---|---|---|---|---|---|---|---|
| 603 W 2nd St | 0.44mi | 2/1.0 | 1,016 (+9%) | 7mo | $169,900 | $167 | 59 |
| 405 E Willingham St | 0.63mi | 2/1.0 | 910 (-2%) | 11mo | $118,000 | $130 | 58 |
| 1104 Prairie Ave | 0.67mi | 2/1.0 | 952 (+2%) | 9mo | $178,000 | $187 | 58 |
| 607 N Buffalo | 0.55mi | 2/1.0 | 965 (+4%) | 13mo | $100,000 | $104 | 58 |
| 905 Hodge St | 0.56mi | 2/1.0 | 912 (-2%) | 21mo | $196,000 | $215 | 53 |
| 101 S Pendell Ave | 0.49mi | 2/1.0 | 1,040 (+12%) | 6mo | $199,500 | $192 | 53 |
| 206 N Holloway St | 0.56mi | 3/1.5 (+1) | 1,002 (+8%) | 3mo | $200,000 | $200 | 52 |
| 517 Featherston St | 0.31mi | 3/2.0 (+1) | 1,047 (+12%) | 7mo | $199,000 | $190 | 50 |
| 105 Circle Dr | 0.59mi | 2/1.0 | 832 (-11%) | 10mo | $134,900 | $162 | 46 |
| 602 W 2nd St | 0.43mi | 2/1.0 | 1,067 (+14%) | 16mo | $210,000 | $197 | 43 |
| 205 N Wood St | 0.60mi | 2/1.0 | 871 (-6%) | 23mo | $99,900 | $115 | 42 |
| 205 Heath St | 0.73mi | 3/1.0 (+1) | 1,051 (+13%) | 14mo | $158,500 | $151 | 28 |
Match score weights: distance 35% · size 25% · config 20% · recency 20%. Top-matched comps best support the ARV.
Projected returns pro-forma
-3.0% appreciation · 0.0% rent growth · sell at horizon
- IRR
- -15.1%
- Equity multiple
- 0.48×
- Total profit
- $-20,491
- Equity at exit
- $20,860
- IRR
- -12.6%
- Equity multiple
- 0.36×
- Total profit
- $-25,120
- Equity at exit
- $12,096
Cash invested: $39,172 (down + closing). Projections, not guarantees.
Landlord ↔ Tenant lean methodology
- Overall (STATE)
- 87 Strongly Landlord-Friendly
- State Texas
- 87 Strongly Landlord-Friendly · R+5
- County
- — inherits STATE
- City
- — inherits STATE
ZIP-level market 76033
- Rents YoY
- -0.8%
- Active inventory
- 660
- Price-to-rent
- 8.7×
Monthly cashflow live
- Estimated rent
- $1,342 high interval (Pro) →
- Mortgage (P&I)
- −$734
- Tax from tax record
- −$173 /mo · $2,071/yr
- Insurance
- −$58
- HOA
- −$0
- Vacancy / Maint / Mgmt
- −$282
- Net cashflow
- $96
Break-even live
UW: 25.0% down · 7.5% · 30yr · 1.5% tax · 5.0% vac · 8.0% maint · 8.0% mgmt
Financing live
Cash to close
- Down payment
- $34,975
- Closing costs
- $4,197
- Reserves months
- —
- Total cash needed
- —
Loan-product check · same deal, 3 products live
Conventional
25% down · 7.5% · 30yr
- Down + closing
- —
- Monthly P&I
- —
- Monthly cashflow
- —
- DSCR
- —
- Eligible?
- —
Personal DTI + credit; lowest rate.
DSCR
20% down · 8.5% · 30yr
- Down + closing
- —
- Monthly P&I
- —
- Monthly cashflow
- —
- DSCR
- —
- Eligible?
- —
No personal income docs; deal must DSCR.
Hard money
10% down · 12.0% · 12mo
- Down + closing
- —
- Monthly P&I
- —
- Monthly cashflow
- —
- DSCR
- —
- Eligible?
- —
Short-term bridge; refi at stabilization.
Rent comps 27 comps
| Address | Beds | Baths | Sqft | Rent | $/sqft | DOM | Units | Dist |
|---|---|---|---|---|---|---|---|---|
| 204 W Westhill Dr Cleburne, TX | 3.0 | 2.0 | 1040 | $1,950 | $1.88 | 43d | 1 | 0.20mi |
| 204 S Caddo St Cleburne, TX | 1.0 | 1.0 | 650 | $1,000 | $1.54 | 24d | 1 | 0.28mi |
| 201 E Chambers St Unit 203 Cleburne, TX | 1.0 | 1.0 | 1022 | $1,525 | $1.49 | 2d | 1 | 0.39mi |
| 305 N Robinson St Cleburne, TX | 1.0 | 1.0 | 574 | $849 | $1.48 | 10d | 1 | 0.53mi |
| 305 N Robinson St Unit C, Upstairs Right Cleburne, TX | 1.0 | 1.0 | 574 | $799 | $1.39 | 3d | 1 | 0.53mi |
| 112 W Wilson St Cleburne, TX | 2.0 | 1.0 | 1002 | $1,400 | $1.40 | 43d | 1 | 0.59mi |
| 909 W Wardville St Cleburne, TX | 2.0 | 1.0 | 847 | $1,350 | $1.59 | 43d | 1 | 0.60mi |
| 907 Hodge St Cleburne, TX | 2.0 | 1.0 | 912 | $1,450 | $1.59 | 2d | 1 | 0.61mi |
| 823 College St Cleburne, TX | 2.0 | 1.0 | 944 | $1,550 | $1.64 | 16d | 1 | 0.66mi |
| 823 College St Cleburne, TX | 2.0 | 1.0 | 944 | $1,550 | $1.64 | 6d | 1 | 0.66mi |
| 431 N Wilhite St Unit 431 Cleburne, TX | 2.0 | 1.0 | 750 | $1,195 | $1.59 | 19d | 1 | 0.71mi |
| 203 Willana Ct Cleburne, TX | 3.0 | 2.0 | 1100 | $1,700 | $1.55 | 20d | 1 | 0.79mi |
| 601 Royal St Cleburne, TX | 2.0 | 1.0 | 720 | $1,325 | $1.84 | 43d | 1 | 1.01mi |
| 601 Royal St Cleburne, TX | 2.0 | 1.0 | 720 | $1,300 | $1.81 | 7d | 1 | 1.01mi |
| 601 Royal St Cleburne, TX | 2.0 | 1.0 | 720 | $1,375 | $1.91 | 2d | 1 | 1.01mi |
| 1106 Williams Ave Unit D Cleburne, TX | 2.0 | 1.0 | 900 | $900 | $1.00 | 24d | 1 | 1.06mi |
| 1108 Williams Ave Unit H Cleburne, TX | 2.0 | 1.0 | 900 | $900 | $1.00 | 24d | 1 | 1.07mi |
| 1110 Williams Ave Unit C Cleburne, TX | 2.0 | 1.0 | 900 | $900 | $1.00 | 43d | 1 | 1.09mi |
| 901 N Border St Unit A Cleburne, TX | 2.0 | 1.0 | 900 | $950 | $1.06 | 43d | 1 | 1.12mi |
| 1308 N Brazos Ave Cleburne, TX | 3.0 | 2.0 | 1028 | $1,595 | $1.55 | 24d | 1 | 1.17mi |
| 1312 Ridge Run St Cleburne, TX | 1.0 | 1.0 | 661 | $1,122 | $1.70 | 43d | 1 | 1.19mi |
| 1312 Ridge Run St Unit A Cleburne, TX | 2.0 | 2.0 | 992 | $1,250 | $1.26 | 24d | 1 | 1.19mi |
| 815 Woodard Ave Cleburne, TX | 1.0–2.0 | 1.0–2.0 | 793 | $1,335 | $1.68 | 1d | 8 | 1.25mi |
| 1302 Berry Dr Unit A Cleburne, TX | 2.0 | 1.0 | 861 | $1,400 | $1.63 | 43d | 1 | 1.27mi |
| 1304 Berry Dr Cleburne, TX | 2.0 | 1.0 | 900 | $1,200 | $1.33 | 20d | 1 | 1.28mi |
| 101 Westcourt Dr Cleburne, TX | 2.0 | 1.5 | 980 | $1,565 | $1.60 | 43d | 1 | 1.29mi |
| 1211 Country Club Rd Cleburne, TX | 2.0 | 1.0 | 994 | $1,395 | $1.40 | 24d | 1 | 1.48mi |
Listing history 16 events
-
2026-06-18days on market $139,900 Active 90 DOM
-
2026-06-17days on market $139,900 Active 89 DOM
-
2026-06-16days on market $139,900 Active 88 DOM
-
2026-06-15days on market $139,900 Active 87 DOM
-
2026-06-13days on market $139,900 Active 85 DOM
-
2026-06-09days on market $139,900 Active 81 DOM
-
2026-06-08days on market $139,900 Active 80 DOM
-
2026-06-07days on market $139,900 Active 79 DOM
-
2026-06-04days on market $139,900 Active 76 DOM
-
2026-06-03pricedays on market $139,900 Active 75 DOM
-
2026-06-02days on market $150,000 Active 74 DOM
-
2026-06-01days on market $150,000 Active 73 DOM
-
2026-05-31days on market $150,000 Active 72 DOM
-
2026-03-20$150,000 Active 798-char remark
Show marketing remark (798 chars)
So many options. Full of possibilities and packed with potential, this 2-bedroom, 1-bath, 1 car carport home in Cleburne can be yours. Whether you’re looking for your 1st home, wanting to down size or build your investor portfolio. This home is ready for a new owner to add their personal touch and restore its full sparkle. Home features a large kitchen. Utility room for full washer and dryer. Nice fenced backyard. Conveniently located near schools, parks, shopping, and downtown amenities. Home is occupied by long time tenant. Home can also be packaged with 5 other homes that are offered for sale as well. All MLS# for properties offer for sale 21206881, 21211282, 21211302, 21214411. 21214430 and 21214445. Home and property are being sold “as-is” “where-is”.
-
2006-01-30soldstatus
-
1997-07-23soldstatus
ⓘ Source: listings_history table (triggers on properties + properties_extension) + one-shot
backfill from property_details.listing_events for pre-trigger history.
Tax reassessment forecast TX · Resets to sale price
- Current annual tax
- $2,071 · $173/mo
- Projected year-2 tax
- $2,560 · $213/mo
- Expected delta
- +$490/yr (+$41/mo · 23.6%)
ⓘ Screening estimate from a state-policy table — verify with the county assessor before closing.
Climate risk First Street
- Flood 4/10 Moderate FEMA zone X (unshaded) · 22% chance over 30 yrs
- Wildfire 5/10 Major
- Heat 7/10 Severe 7 d/yr ≥109°F today · 24 d/yr by 30 yrs out
- Wind 6/10 Major 27% chance of damaging wind over 30 yrs
- Air quality 2/10 Low 1 unhealthy d/yr today · 2 by 30 yrs out
Nearby sold comps map
Loading sold comps map…
Walkable amenities ~0.75 mi
Loading nearby amenities…
Taxation est. · year 1
- Rental income
- $16,104
- − Mortgage interest
- −$7,837
- − Property taxes
- −$2,071
- − Insurance
- −$700
- − Repairs & maintenance
- −$1,288
- − Management
- −$1,288
- − Depreciation
- −$4,070
- Taxable loss
- −$1,149
- Est. tax savings @ 24.0%
- +$276
- After-tax cash flow
- $1,424/yr
For passive investors: Depreciation is non-cash, so a rental often shows a tax loss while cash-flowing — sheltering income. Rental losses are passive: they offset passive income freely, and up to $25,000/yr can offset ordinary (W-2) income if you actively participate and your MAGI is under $100k (phasing out to $0 by $150k); unused losses carry forward. On sale, claimed depreciation is recaptured at up to 25%, and gains may owe capital-gains tax (a 1031 exchange can defer both). Figures are a year-1 estimate at your 24.0% rate — not tax advice; consult a CPA.
Schools (NCES district)
- District
- Cleburne ISD
- NCES district ID
- 4814310
- Math proficiency
- 34% ▼ -2.00%
- Reading proficiency
- 33% ▼ -2.00%
- Median HH income
- $48,788
- Composite
- 29.0/100
- National rank
- #6618
- State rank
- #537 of 826 in TX
Livability — Cleburne
- Score
- 68/100
- State rank
- #460
- US rank
- #9292
Category grades
Schools grade is shown separately in the Schools card above.
Census & demographics
- Census place
- Cleburne, TX
- County
- Johnson County · 147,987 people
- City population
- 29,538
- Metro
- Dallas-Fort Worth-Arlington, TX
- Population (ZIP)
- 29,538
- Household income
- $76,292
- Rent vs Own
- Severe rent burden
- 927.0
Population outlook (Johnson County) Hauer SSP2
- Today (2025)
- 179,678 people
- By 2030
- 189,208 · +5.3%
- By 2040
- 207,261 · +15.4%
- By 2050
- 223,064 · +24.1%
- By 2075
- 259,979 · +44.7%
- By 2100
- 275,395 · +53.3%
Race, ethnicity, and origin ACS 2023
- Neighborhood character
- Majority White (64%)
- Race & ethnicity
- White 64% Hispanic / Latino 26% Two or more races 15% Black 4% Native American 1%
- Hispanic origin (detail)
- Mexican 23%
- Common ancestry
- Slovak 2% Italian 2% Portuguese 1%
- Foreign-born
- 8% · Canada, Guatemala, Vietnam
- Languages at home
- 81% English-only · Spanish 17% Other Asian/Pacific 2%
Political lean MEDSL · Johnson
- 2024 margin
- Solid R (+51.4) · D 23.9% · R 75.3%
- 2008→2024 swing
- -3.9pp toward R · 2008: -47.5pp · 2024: -51.4pp
- All cycles
- 2024: R+51.4 2020: R+53.0 2016: R+58.3 2012: R+55.6 2008: R+47.5
Not yet ingested
- Civics
- —
Market trends
- HPI YoY
- ▼ -202.75%
- Current HPI
- 246.0029
- Rent YoY
- ▼ -0.83%
- Metro
- Dallas-Fort Worth-Arlington, TX
- State GDP YoY
- ▲ 3.95%
- F500 in state
- 110
Industry mix (Fortune 500 HQ in TX)
| Industry | F500 HQs | Revenue |
|---|---|---|
| Energy | 16 | $1,198B |
|
||
| Technology | 5 | $198B |
|
||
| Engineering / Construction | 4 | $72B |
|
||
| Energy Services | 3 | $60B |
|
||
| Utilities | 3 | $41B |
|
||
| Healthcare | 2 | $330B |
|
||
Price history
3 events — show timeline
- 2026-03-20 Listed $150,000 NTREIS
- 2006-01-30 Sold (Public Records) — Public Records
- 1997-07-23 Sold (Public Records) — Public Records
Property tax history
+6.2%/yrLatest (2025): $2,071 · +1.5% YoY. Source: county tax records.
Cash-flow waterfall
monthlySold comps — $/sqft
last 12 mo · ≤1 miLoading sold comps…