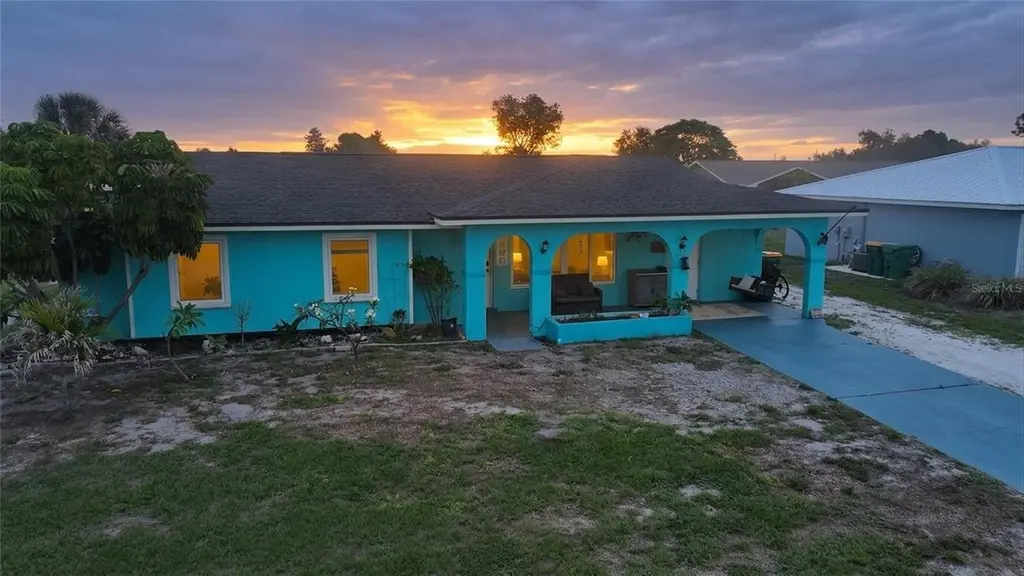
13518 Alberta Ave · North Port, FL
Flood risk 9/10 · Severe
- FEMA flood zone
- X (shaded)
- Chance of flooding over 30 yrs
- 0.99%
- Est. flood insurance / yr
- $507 – $1,088
Fire risk 2/10 · Minimal
- Est. fire insurance / yr
- $947 – $1,759
Heat risk 10/10 · Severe
- Hot days now (above 107°F)
- 7 days/yr
- Hot days in 30 yrs
- 30 days/yr
Wind risk 10/10 · Severe
- Chance of severe wind over 30 yrs
- 99.0%
Air-quality risk 2/10 · Minimal
- Unhealthy air days now
- 1 days/yr
- Unhealthy air days in 30 yrs
- 1 days/yr
Risk factors via First Street. Map © Google.
Why this score? — see what drove the C grade
The composite is a weighted blend of 9 inputs, each scored 0–100. Each bar is that input's sub-score; the figure is the points it added to the 100-point composite (weight × sub-score).
- Cash flow +17.1/30.0
- ARV discount +15.0/15.0
- 1% rule +5.4/10.0
- DSCR +5.3/10.0
- Schools +4.6/10.0
- Rent growth +3.8/5.0
- Livability +3.8/5.0
- Condition / age +2.5/5.0
- Appreciation +0.0/10.0
$199,900
🖨 Deal sheet 📄 Offer letter ✓ Due diligence
Listing remarks MLS
Come and discover this home in the highly desired community of The Gardens of Gulf Cove. The community is not only close to the beautiful beaches on Manasota Key it also has two club houses, two pools and one of the lowest HOA fee's you will find. This three bedroom two bath home has a new roof, a updated electric panel, fenced yard and large separate laundry room. This home will make the perfect winter retreat or full time residence, not to big and not to small. Also there is an additional storage lot that can be leased for $90.00 per year. Buyers are subject to a background check and credit check. Rentals are not aloud for the first year after purchase.
Key facts
- Block home
- Newer roof
- Large laundry room
Tags
Property features AI
Finance
- Financial info: Lease restrictions apply
- HOA & community: HOA: Gardens of Gulf Cove; Monthly HOA approximately $39.17 (annual fee $470); HOA required with association approval required; HOA includes pool and management; Community clubhouse, fitness center, pool, tennis courts; Deed restrictions; Pets allowed
Exterior
- Utilities: Public water; Public sewer; Cable available; Public utilities
- Home design: Single-family residence; One story; Faces south
- Construction: Block and stucco construction; Shingle roof; Slab foundation; Built on a 0.17-acre lot
- Exterior features: Front porch; Other exterior features
Interior
- Kitchen: Dishwasher; Microwave; Range; Refrigerator; Eat-in kitchen
- Bedrooms: 3 bedrooms
- Flooring: Ceramic tile; Other flooring
- Bathrooms: 2 full bathrooms
- Heating & cooling: Central heating (electric); Central air conditioning
- Interior features: Ceiling fans; Eat-in kitchen; Split bedroom floor plan; Storm windows; Bonus room; Inside utility
- Laundry & utility: Inside laundry room; Washer; Dryer
Neighborhood map
What this means for you Summary
Snapshot
- This is a 2-bed/2.0-bath single-family listed at $200k.
Deal economics
- At list price, monthly cash flow is $74 ($889/yr) — positive.
- The deal already cash-flows at list — no discount required.
- Meets the 1% rule at list price ($2k rent vs $200k).
- Recommended offer: $197k (1.5% below list) — sets the bar for market timing.
- Cap rate 7.1% vs local median 3.6% in North Port — top-decile yield for the area; either an underpriced asset or a hidden risk that comps aren't pricing in. Stress-test before assuming the spread holds.
Location & tenants
- Location reads 75/100 on livability (#252 in FL, #3,975 nationally) — a middle-class / working-renter tenant base. Strengths: crime A+, housing A+, health & safety A+; Watch: amenities F, commute F.
- Charlotte (suburban): math 54% / reading 54% proficiency, ranked #22 of 73 in FL (top 30%) — acceptable for families but not a draw, mixed tenant base, ~2y average lease.
- Market conditions: Rents rising fast (+5.3%/yr); 2188 active listings in the ZIP; 12 comparable units currently listed for rent nearby; rentals at typical pace (median 21d on market — plan ~3-4 weeks tenant-placement turnaround); solid renter incomes; 4,585 units permitted in Charlotte County in 2024 (703 in 5+ unit buildings).
Forward outlook
- Local home prices are declining (-3.0%/yr); year-one equity from $1k of loan paydown is wiped out by about $6k of value loss. Plan a longer hold.
- Charlotte County population projected at +24% by 2050 — long-run rental-demand tailwind backs the buy-and-hold thesis.
Negotiation context
- It's been on market 15 days — a 2% lower offer ($197k) is reasonable based on typical stale-listing flexibility.
- 9 sale attempts since 15y ago with the ask held roughly flat each time — persistent listings suggest the price (not the market) is what's stuck; bring a comps-based counter.
Risks & watch-outs
- Watch-outs: flood insurance adds $66/mo.
- Climate carrying-cost: severe flood risk; severe wind risk, 99% chance of damaging wind over 30y; extreme-heat days projected 7→30/yr by 2055 (HVAC capex compounding) — expect insurance premiums to compound above CPI over the hold.
Questions for the listing agent
- Built in 1973 — when were the roof, HVAC, electrical panel, plumbing, and water heater last replaced?
- What's the actual annual flood-insurance premium (NFIP or private), and is the property in a SFHA with mandatory coverage?
- What does the HOA fee cover, when was the last increase, and are there any pending special assessments or reserve-fund shortfalls?
- Is there a deadline driving the sale (1031 exchange, divorce, estate, relocation)? That informs how much negotiation room exists.
- Schools are B-rated — typically a magnet for longer-tenancy family renters. What's the average tenant stay here, and is there a school-zone premium baked into asking?
- What's the average days-on-market for RENTAL listings here right now (not sales)? A rising rental-DOM trend means longer vacancies and softer asking-rent achievability than the comps imply.
- What's the recent tenant-quality profile in this submarket — average credit score on applications, eviction rate, late-payment / NSF rate, and stable-employment percentage? A property-management company in the area should have these aggregated.
- How much new for-sale + rental construction is in the pipeline within 1–3 miles? Heavy new supply typically softens prices + rents 12–24 months out; constrained supply supports both.
Investment metrics
- 1% rule
- 1.04% ✓
- Cap rate
- 7.14%
- Cash-on-cash
- 3.01%
- DSCR
- 1.13
- GRM
- 8.0
CMA / ARV
- ARV (on-the-fly)
- $248,712
- Comps found
- 11
Show comp detail 11 sales within ~0.75 mi
| Address | Dist | Beds/Ba | Sqft | Sold | Price | $/sf | Match |
|---|---|---|---|---|---|---|---|
| 6570 Coliseum Blvd | 0.14mi | 3/2.0 (+1) | 1,328 (-8%) | 4mo | $228,900 | $172 | 71 |
| 13400 Englewood Rd | 0.25mi | 3/2.0 (+1) | 1,518 (+5%) | 7mo | $250,000 | $165 | 69 |
| 6393 Drucker Cir | 0.32mi | 2/2.0 | 1,303 (-10%) | 1mo | $360,000 | $276 | 68 |
| 6334 Cutler Ter | 0.09mi | 3/3.0 (+1) | 1,641 (+14%) | 2mo | $249,900 | $152 | 62 |
| 6375 Coniston St | 0.41mi | 2/2.0 | 1,276 (-12%) | 3mo | $254,000 | $199 | 59 |
| 6596 Thorman Rd | 0.57mi | 3/2.0 (+1) | 1,494 (+3%) | 10mo | $239,900 | $161 | 55 |
| 6178 Coliseum Blvd | 0.68mi | 3/2.0 (+1) | 1,360 (-6%) | 4mo | $315,000 | $232 | 50 |
| 13300 Darnell Ave | 0.73mi | 3/2.0 (+1) | 1,372 (-5%) | 4mo | $274,900 | $200 | 49 |
| 6540 Thorman Rd | 0.61mi | 3/2.0 (+1) | 1,341 (-7%) | 13mo | $235,000 | $175 | 43 |
| 13489 Darnell Ave | 0.56mi | 3/2.0 (+1) | 1,245 (-14%) | 4mo | $195,000 | $157 | 42 |
| 6461 Thorman Rd | 0.64mi | 3/2.0 (+1) | 1,636 (+13%) | 12mo | $255,000 | $156 | 33 |
Match score weights: distance 35% · size 25% · config 20% · recency 20%. Top-matched comps best support the ARV.
Projected returns pro-forma
-3.0% appreciation · 5.29% rent growth · sell at horizon
- IRR
- -10.8%
- Equity multiple
- 0.60×
- Total profit
- $-22,631
- Equity at exit
- $29,806
- IRR
- 1.8%
- Equity multiple
- 1.14×
- Total profit
- $8,020
- Equity at exit
- $17,284
Cash invested: $55,972 (down + closing). Projections, not guarantees.
Landlord ↔ Tenant lean methodology
- Overall (STATE)
- 87 Strongly Landlord-Friendly
- State Florida
- 87 Strongly Landlord-Friendly · R+3
- County
- — inherits STATE
- City
- — inherits STATE
ZIP-level market 33981
- Home prices YoY
- -7.5%
- Rents YoY
- 5.3%
- Active inventory
- 2188
- Price-to-rent
- 8.0×
Monthly cashflow live
- Estimated rent
- $2,078 high interval (Pro) →
- Mortgage (P&I)
- −$1,048
- Tax from tax record
- −$330 /mo · $3,963/yr
- Insurance
- −$83
- Flood insurance flood zone
- −$66 /mo · $798/yr
- HOA
- −$39
- Vacancy / Maint / Mgmt
- −$436
- Net cashflow
- $74
Break-even live
UW: 25.0% down · 7.5% · 30yr · 1.5% tax · 5.0% vac · 8.0% maint · 8.0% mgmt
Financing live
Cash to close
- Down payment
- $49,975
- Closing costs
- $5,997
- Reserves months
- —
- Total cash needed
- —
Loan-product check · same deal, 3 products live
Conventional
25% down · 7.5% · 30yr
- Down + closing
- —
- Monthly P&I
- —
- Monthly cashflow
- —
- DSCR
- —
- Eligible?
- —
Personal DTI + credit; lowest rate.
DSCR
20% down · 8.5% · 30yr
- Down + closing
- —
- Monthly P&I
- —
- Monthly cashflow
- —
- DSCR
- —
- Eligible?
- —
No personal income docs; deal must DSCR.
Hard money
10% down · 12.0% · 12mo
- Down + closing
- —
- Monthly P&I
- —
- Monthly cashflow
- —
- DSCR
- —
- Eligible?
- —
Short-term bridge; refi at stabilization.
Rent comps 12 comps
| Address | Beds | Baths | Sqft | Rent | $/sqft | DOM | Units | Dist |
|---|---|---|---|---|---|---|---|---|
| 6551 Coliseum Blvd Port Charlotte, FL | 3.0 | 2.0 | 1386 | $1,850 | $1.33 | 13d | 1 | 0.14mi |
| 6248 Drucker Cir Port Charlotte, FL | 3.0 | 2.0 | 1414 | $1,810 | $1.28 | 13d | 1 | 0.29mi |
| 6351 Coniston St Port Charlotte, FL | 3.0 | 2.0 | 1200 | $1,950 | $1.62 | 21d | 1 | 0.40mi |
| 13288 Fowler Ave Port Charlotte, FL | 3.0 | 2.0 | 1203 | $2,500 | $2.08 | 21d | 1 | 0.41mi |
| 13349 Buckett Cir Port Charlotte, FL | 3.0 | 3.0 | 1560 | $2,795 | $1.79 | 21d | 1 | 0.52mi |
| 6628 Thorman Rd Port Charlotte, FL | 3.0 | 2.0 | 1116 | $1,800 | $1.61 | 21d | 1 | 0.53mi |
| 13280 Foresman Blvd Port Charlotte, FL | 3.0 | 2.0 | 1500 | $2,800 | $1.87 | 13d | 1 | 0.77mi |
| 13184 Eureka Cir Port Charlotte, FL | 3.0 | 2.0 | 1640 | $2,300 | $1.40 | 21d | 1 | 0.84mi |
| 5292 Early Ter Port Charlotte, FL | 2.0 | 2.0 | 1130 | $1,800 | $1.59 | 21d | 1 | 1.20mi |
| 5498 Montego Ln Port Charlotte, FL | 2.0 | 2.0 | 1070 | $1,695 | $1.58 | 21d | 1 | 1.24mi |
| 7415 Beckley St Port Charlotte, FL | 3.0 | 2.0 | 1405 | $1,400 | $1.00 | 21d | 1 | 1.28mi |
| 5496 Brussels Ter Port Charlotte, FL | 3.0 | 2.0 | 1400 | $3,900 | $2.79 | 21d | 1 | 1.50mi |
HOA detail
- Monthly dues
- $39 · $468/yr
- Likely covers
- electricpool
Listing history 12 events
-
2026-06-18days on market $199,900 Active 15 DOM
-
2026-06-17days on market $199,900 Active 14 DOM
-
2026-06-16days on market $199,900 Active 13 DOM
-
2026-06-15days on market $199,900 Active 12 DOM
-
2026-06-14days on market $199,900 Active 10 DOM
-
2026-06-13days on market $199,900 Active 9 DOM
-
2026-06-10days on market $199,900 Active 7 DOM
-
2026-06-09days on market $199,900 Active 6 DOM
-
2026-06-08days on market $199,900 Active 5 DOM
-
2026-06-07days on market $199,900 Active 4 DOM
-
2026-06-05remarks 699-char remark
-
2026-06-05$199,900 Active 1 DOM
ⓘ Source: listings_history table (triggers on properties + properties_extension) + one-shot
backfill from property_details.listing_events for pre-trigger history.
Tax reassessment forecast FL · Resets to sale price
- Current annual tax
- $3,963 · $330/mo
- Projected year-2 tax
- $3,963 · $330/mo
- Expected delta
- $0/yr ($0/mo · 0.0%)
ⓘ Screening estimate from a state-policy table — verify with the county assessor before closing.
Climate risk First Street
- Flood 9/10 Extreme FEMA zone X (shaded) · 99% chance over 30 yrs
- Wildfire 2/10 Low
- Heat 10/10 Extreme 7 d/yr ≥107°F today · 30 d/yr by 30 yrs out
- Wind 10/10 Extreme 99% chance of damaging wind over 30 yrs
- Air quality 2/10 Low 1 unhealthy d/yr today · 1 by 30 yrs out
Nearby sold comps map
Loading sold comps map…
Walkable amenities ~0.75 mi
Loading nearby amenities…
Taxation est. · year 1
- Rental income
- $24,933
- − Mortgage interest
- −$11,198
- − Property taxes
- −$3,963
- − Insurance
- −$1,797
- − Repairs & maintenance
- −$1,995
- − Management
- −$1,995
- − HOA
- −$468
- − Depreciation
- −$5,815
- Taxable loss
- −$2,297
- Est. tax savings @ 24.0%
- +$551
- After-tax cash flow
- $1,441/yr
For passive investors: Depreciation is non-cash, so a rental often shows a tax loss while cash-flowing — sheltering income. Rental losses are passive: they offset passive income freely, and up to $25,000/yr can offset ordinary (W-2) income if you actively participate and your MAGI is under $100k (phasing out to $0 by $150k); unused losses carry forward. On sale, claimed depreciation is recaptured at up to 25%, and gains may owe capital-gains tax (a 1031 exchange can defer both). Figures are a year-1 estimate at your 24.0% rate — not tax advice; consult a CPA.
Schools (NCES district)
- District
- Charlotte
- NCES district ID
- 1200240
- Math proficiency
- 54% ▼ -6.00%
- Reading proficiency
- 54% ▼ -1.00%
- Median HH income
- $44,864
- Composite
- 45.62/100
- National rank
- #2586
- State rank
- #22 of 73 in FL
Livability — North Port
- Score
- 75/100
- State rank
- #252
- US rank
- #3975
Category grades
Schools grade is shown separately in the Schools card above.
Census & demographics
- County
- Charlotte County · 196,994 people
- City population
- 75,324
- Metro
- Punta Gorda, FL
- Population (ZIP)
- 15,622
- Household income
- $84,098
- Rent vs Own
- Severe rent burden
- 105.0
Population outlook (Charlotte County) Hauer SSP2
- Today (2025)
- 198,646 people
- By 2030
- 210,507 · +6.0%
- By 2040
- 230,857 · +16.2%
- By 2050
- 247,148 · +24.4%
- By 2075
- 281,777 · +41.8%
- By 2100
- 293,609 · +47.8%
Race, ethnicity, and origin ACS 2023
- Neighborhood character
- Predominantly White (89%)
- Race & ethnicity
- White 89% Two or more races 4% Hispanic / Latino 4% Black 2% Asian 1%
- Common ancestry
- Romanian 4% Lithuanian 3% Italian 2%
- Foreign-born
- 6% · Canada
- Languages at home
- 96% English-only · Spanish 1% German/W. Germanic 1% Tagalog/Filipino 1%
Political lean MEDSL · Charlotte
- 2024 margin
- Solid R (+34.0) · D 32.7% · R 66.7%
- 2008→2024 swing
- -26.7pp toward R · 2008: -7.2pp · 2024: -34.0pp
- All cycles
- 2024: R+34.0 2020: R+26.6 2016: R+27.8 2012: R+14.3 2008: R+7.2
Not yet ingested
- Civics
- —
Market trends
- HPI YoY
- ▼ -28.09%
- Current HPI
- 346.5247
- Rent YoY
- ▲ 5.29%
- Metro
- Punta Gorda, FL
- State GDP YoY
- ▲ 3.28%
- F500 in state
- 36
Industry mix (Fortune 500 HQ in FL)
| Industry | F500 HQs | Revenue |
|---|---|---|
| Industrial Technology | 2 | $29B |
|
||
| Insurance | 2 | $17B |
|
||
| Retail | 1 | $60B |
|
||
| Technology Distribution | 1 | $58B |
|
||
| Homebuilding | 1 | $35B |
|
||
| Technology Manufacturing | 1 | $35B |
|
||
Price history
+207.5% since first listed32 events — show timeline
- 2026-06-03 Listed $199,900 Stellar MLS as Distributed by MLS Grid
- 2021-12-03 Listing Removed — Stellar MLS as Distributed by MLS Grid
- 2021-12-03 Sold (Public Records) $275,000 Public Records
- 2021-12-02 Sold (MLS) $275,000 Stellar MLS as Distributed by MLS Grid
- 2021-11-01 Pending — Stellar MLS as Distributed by MLS Grid
- 2021-10-26 Listed $274,900 Stellar MLS as Distributed by MLS Grid
- 2019-11-27 Sold (Public Records) $158,000 Public Records
- 2019-11-25 Sold (MLS) $158,000 Stellar MLS as Distributed by MLS Grid
- 2019-10-26 Pending — Stellar MLS as Distributed by MLS Grid
- 2019-10-16 Price Changed $162,900 Stellar MLS as Distributed by MLS Grid
- 2019-10-04 Listed $168,900 Stellar MLS as Distributed by MLS Grid
- 2018-08-29 Pending — Stellar MLS as Distributed by MLS Grid
- 2018-08-29 Listing Removed — Stellar MLS as Distributed by MLS Grid
- 2018-08-26 Listed $148,000 Stellar MLS as Distributed by MLS Grid
- 2015-02-11 Sold (Public Records) $100,000 Public Records
- 2015-02-11 Sold (MLS) $100,000 Stellar MLS as Distributed by MLS Grid
- 2015-01-13 Pending — Stellar MLS as Distributed by MLS Grid
- 2014-12-29 Price Changed $104,000 Stellar MLS as Distributed by MLS Grid
- 2014-12-01 Price Changed $108,000 Stellar MLS as Distributed by MLS Grid
- 2014-11-17 Listed $111,000 Stellar MLS as Distributed by MLS Grid
- 2014-09-01 Listing Removed — Stellar MLS as Distributed by MLS Grid
- 2014-06-10 Listing Removed — Stellar MLS as Distributed by MLS Grid
- 2014-04-01 Relisted — Stellar MLS as Distributed by MLS Grid
- 2014-04-01 Price Changed $109,900 Stellar MLS as Distributed by MLS Grid
- 2014-02-08 Listed $114,900 Stellar MLS as Distributed by MLS Grid
- 2012-06-19 Sold (Public Records) $62,500 Public Records
- 2012-06-18 Sold (MLS) $62,500 Stellar MLS as Distributed by MLS Grid
- 2011-09-08 Listed $74,000 Stellar MLS as Distributed by MLS Grid
- 2011-06-06 Sold (Public Records) $57,200 Public Records
- 2011-02-28 Sold (MLS) $37,377 Stellar MLS as Distributed by MLS Grid
- 2011-01-14 Listed $36,900 Stellar MLS as Distributed by MLS Grid
- 1999-03-02 Sold (Public Records) $65,000 Public Records
Property tax history
+7.0%/yrLatest (2025): $3,963 · +39.0% YoY. Source: county tax records.
Cash-flow waterfall
monthlySold comps — $/sqft
last 12 mo · ≤1 miLoading sold comps…