18235 Lahore Rd · Orange, VA
Flood risk 8/10 · Major
- FEMA flood zone
- X (unshaded)
- Chance of flooding over 30 yrs
- 0.99%
- Est. flood insurance / yr
- $507 – $1,088
Fire risk 3/10 · Minor
- Est. fire insurance / yr
- $666 – $1,236
Heat risk 7/10 · Major
- Hot days now (above 106°F)
- 7 days/yr
- Hot days in 30 yrs
- 17 days/yr
Wind risk 3/10 · Minor
- Chance of severe wind over 30 yrs
- 6.0%
Air-quality risk 2/10 · Minimal
- Unhealthy air days now
- 0 days/yr
- Unhealthy air days in 30 yrs
- 1 days/yr
Risk factors via First Street. Map © Google.
Why this score? — see what drove the C+ grade
The composite is a weighted blend of 9 inputs, each scored 0–100. Each bar is that input's sub-score; the figure is the points it added to the 100-point composite (weight × sub-score).
- Cash flow +22.3/30.0
- ARV discount +15.0/15.0
- DSCR +7.1/10.0
- 1% rule +4.8/10.0
- Schools +4.8/10.0
- Livability +3.7/5.0
- Rent growth +2.5/5.0
- Condition / age +2.5/5.0
- Appreciation +0.7/10.0
$150,000
🖨 Deal sheet (PDF) 📄 Offer letter ✓ Due diligence
Listing remarks MLS
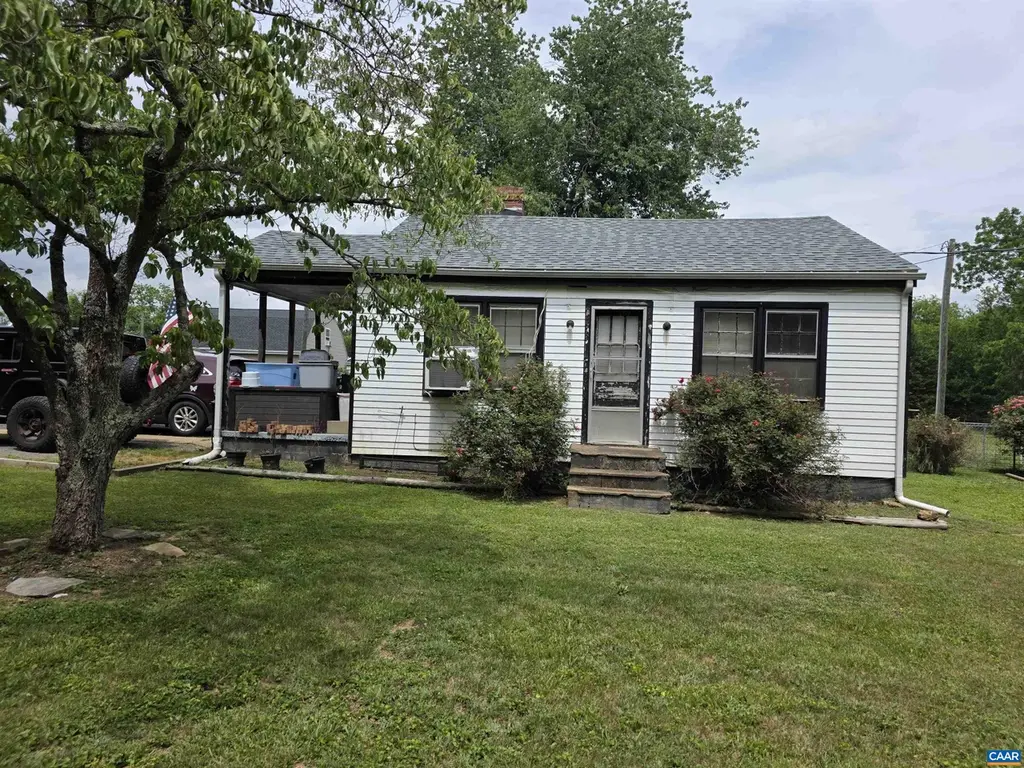
This 2 BR 1 BA home is ideal for 1st time home buyer or investment opportunity. Fenced in back yard for animals. Plenty of storage in 2 outbuildings. LR, kitchen 2 bedrooms in house. Vacant go show. This is home will not last long. Contact Keith for showing/offers.
Key facts
- Public water service
- Roof three years old
- Two storage sheds
Tags
Property features AI
Exterior
- Utilities: Public water; Septic tank; Other utilities
- Home design: Detached single-story home; Stick-built construction; Block foundation
- Construction: Built with stick-built construction; Block foundation
- Exterior features: Approximately 1.15 acre lot
Interior
- Kitchen: Kitchen on the first floor
- Bedrooms: Two main-level bedrooms
- Bathrooms: One full bathroom on the main level
- Heating & cooling: Baseboard heating; Window unit cooling
- Interior features: First-floor kitchen; First-floor living room
Neighborhood map
What this means for you Summary
Snapshot
- This is a 2-bed/1.0-bath single-family listed at $150k.
Deal economics
- At list price, monthly cash flow is $180 ($2k/yr) — positive.
- The deal already cash-flows at list — no discount required.
- To meet the 1% rule (rent ≥ 1% of price), the offer needs to be $147k (2.2% below list).
- Recommended offer: $147k (2.2% below list) — sets the bar for 1% rule.
- Cap rate 8.3% vs local median 4.0% in Orange — top-decile yield for the area; either an underpriced asset or a hidden risk that comps aren't pricing in. Stress-test before assuming the spread holds.
Location & tenants
- Location reads 74/100 on livability (#151 in VA, #4,842 nationally) — a middle-class / working-renter tenant base. Strengths: health & safety A+, housing A, cost of living A-; Watch: crime C-, employment D+, amenities D.
- Orange County Public School District (rural): math 47% / reading 64% proficiency, ranked #71 of 131 in VA (top 54%) — acceptable for families but not a draw, mixed tenant base, ~2y average lease.
- Zoned schools: Unionville Elementary (230 students, 69% FRL); Prospect Heights Middle (math 43% / reading 63%, grade C+, #213 of 342 statewide, top 63%, 456 students, 68% FRL); Orange County High (math 61% / reading 72%, grade B, #195 of 319 statewide, top 62%, 1,476 students, 43% FRL) — zoned schools average 60% FRL vs 34% district-wide (26 pts higher); higher-poverty schools than district average — tighter screening recommended.
- Market conditions: 127 active listings in the ZIP; 412 units permitted in Orange County in 2024 (0 in 5+ unit buildings).
Forward outlook
- Local home prices are declining (-3.0%/yr); year-one equity from $1k of loan paydown is wiped out by about $4k of value loss. Plan a longer hold.
- Orange County population projected at +18% by 2050 — long-run rental-demand tailwind backs the buy-and-hold thesis.
Negotiation context
- Only 8 days on market — expect competitive offers; lowballing is unlikely to land.
- 3 sale attempts since 20y ago with the ask held roughly flat each time — persistent listings suggest the price (not the market) is what's stuck; bring a comps-based counter.
- Current owner paid $98k; list at $150k implies a 53% gain — meaningful room to come down on a strong offer.
Risks & watch-outs
- Watch-outs: flood insurance adds $66/mo; built in 1951 — expect roof / HVAC / electrical / plumbing capex.
- Climate carrying-cost: severe flood risk; extreme-heat days projected 7→17/yr by 2055 (HVAC capex compounding) — expect insurance premiums to compound above CPI over the hold.
Questions for the listing agent
- Built in 1951 — when were the roof, HVAC, electrical panel, plumbing, and water heater last replaced?
- What's the actual annual flood-insurance premium (NFIP or private), and is the property in a SFHA with mandatory coverage?
- Is there a deadline driving the sale (1031 exchange, divorce, estate, relocation)? That informs how much negotiation room exists.
- Schools are B-rated — typically a magnet for longer-tenancy family renters. What's the average tenant stay here, and is there a school-zone premium baked into asking?
- What's the average days-on-market for RENTAL listings here right now (not sales)? A rising rental-DOM trend means longer vacancies and softer asking-rent achievability than the comps imply.
- What's the recent tenant-quality profile in this submarket — average credit score on applications, eviction rate, late-payment / NSF rate, and stable-employment percentage? A property-management company in the area should have these aggregated.
- How much new for-sale + rental construction is in the pipeline within 1–3 miles? Heavy new supply typically softens prices + rents 12–24 months out; constrained supply supports both.
Investment metrics
- 1% rule
- 0.98% ✗
- Cap rate
- 8.27%
- Cash-on-cash
- 7.05%
- DSCR
- 1.31
- GRM
- 8.5
CMA / ARV
- ARV (on-the-fly)
- $272,896
- Comps found
- 1
Show comp detail 1 sale within ~0.75 mi
| Address | Dist | Beds/Ba | Sqft | Sold | Price | $/sf | Match |
|---|---|---|---|---|---|---|---|
| 18639 Lahore Rd | 0.72mi | 3/1.0 (+1) | 920 (+11%) | 20mo | $302,000 | $328 | 27 |
Match score weights: distance 35% · size 25% · config 20% · recency 20%. Top-matched comps best support the ARV.
Projected returns pro-forma
-3.0% appreciation · 3.0% rent growth · sell at horizon
- IRR
- -8.3%
- Equity multiple
- 0.69×
- Total profit
- $-12,842
- Equity at exit
- $22,365
- IRR
- 1.2%
- Equity multiple
- 1.08×
- Total profit
- $3,543
- Equity at exit
- $12,969
Cash invested: $42,000 (down + closing). Projections, not guarantees.
Landlord ↔ Tenant lean methodology
- Overall (STATE)
- 55 Moderately Landlord-Leaning
- State Virginia
- 55 Moderately Landlord-Leaning · D+2
- County
- — inherits STATE
- City
- — inherits STATE
ZIP-level market 22960
- Home prices YoY
- -2.4%
- Active inventory
- 127
- Price-to-rent
- 8.5×
Monthly cashflow live
- Estimated rent
- $1,467 medium interval (Pro) →
- Mortgage (P&I)
- −$787
- Tax from tax record
- −$63 /mo · $760/yr
- Insurance
- −$62
- Flood insurance flood zone
- −$66 /mo · $798/yr
- HOA
- −$0
- Vacancy / Maint / Mgmt
- −$308
- Net cashflow
- $180
Break-even live
Sensitivity live
| Price | -10% $265 | -5% $223 | +0% $180 | +5% $138 | +10% $95 |
|---|---|---|---|---|---|
| Rent | -10% $64 | -5% $122 | +0% $180 | +5% $238 | +10% $296 |
| Rate | -1.0pp $256 | -0.5pp $218 | base $180 | +0.5pp $141 | +1.0pp $102 |
UW: 25.0% down · 7.5% · 30yr · 1.5% tax · 5.0% vac · 8.0% maint · 8.0% mgmt
Financing live
Cash to close
- Down payment
- $37,500
- Closing costs
- $4,500
- Reserves months
- —
- Total cash needed
- —
Loan-product check · same deal, 3 products live
Conventional
25% down · 7.5% · 30yr
- Down + closing
- —
- Monthly P&I
- —
- Monthly cashflow
- —
- DSCR
- —
- Eligible?
- —
Personal DTI + credit; lowest rate.
DSCR
20% down · 8.5% · 30yr
- Down + closing
- —
- Monthly P&I
- —
- Monthly cashflow
- —
- DSCR
- —
- Eligible?
- —
No personal income docs; deal must DSCR.
Hard money
10% down · 12.0% · 12mo
- Down + closing
- —
- Monthly P&I
- —
- Monthly cashflow
- —
- DSCR
- —
- Eligible?
- —
Short-term bridge; refi at stabilization.
Listing history 7 events
-
2026-06-21statusdays on market $150,000 Pending 8 DOM
-
2026-06-18days on market $150,000 Active 6 DOM
-
2026-06-17days on market $150,000 Active 5 DOM
-
2026-06-16days on market $150,000 Active 4 DOM
-
2026-06-15days on market $150,000 Active 3 DOM
-
2026-06-13remarks 699-char remark
-
2026-06-13$150,000 Active 1 DOM
ⓘ Source: listings_history table (triggers on properties + properties_extension) + one-shot
backfill from property_details.listing_events for pre-trigger history.
Tax reassessment forecast VA · Resets to sale price
- Current annual tax
- $760 · $63/mo
- Projected year-2 tax
- $1,230 · $102/mo
- Expected delta
- +$470/yr (+$39/mo · 61.8%)
ⓘ Screening estimate from a state-policy table — verify with the county assessor before closing.
Climate risk First Street
- Flood 8/10 Severe FEMA zone X (unshaded) · 99% chance over 30 yrs
- Wildfire 3/10 Moderate
- Heat 7/10 Severe 7 d/yr ≥106°F today · 17 d/yr by 30 yrs out
- Wind 3/10 Moderate 6% chance of damaging wind over 30 yrs
- Air quality 2/10 Low 0 unhealthy d/yr today · 1 by 30 yrs out
Nearby sold comps map
Loading sold comps map…
Walkable amenities ~0.75 mi
Loading nearby amenities…
Taxation est. · year 1
- Rental income
- $17,607
- − Mortgage interest
- −$8,402
- − Property taxes
- −$760
- − Insurance
- −$1,547
- − Repairs & maintenance
- −$1,409
- − Management
- −$1,409
- − Depreciation
- −$4,364
- Taxable loss
- −$284
- Est. tax savings @ 24.0%
- +$68
- After-tax cash flow
- $2,231/yr
For passive investors: Depreciation is non-cash, so a rental often shows a tax loss while cash-flowing — sheltering income. Rental losses are passive: they offset passive income freely, and up to $25,000/yr can offset ordinary (W-2) income if you actively participate and your MAGI is under $100k (phasing out to $0 by $150k); unused losses carry forward. On sale, claimed depreciation is recaptured at up to 25%, and gains may owe capital-gains tax (a 1031 exchange can defer both). Figures are a year-1 estimate at your 24.0% rate — not tax advice; consult a CPA.
Schools (NCES district)
- District
- Orange County Public School District
- NCES district ID
- 5102820
- Math proficiency
- 47% ▼ -35.00%
- Reading proficiency
- 64% ▼ -14.00%
- Median HH income
- $61,086
- Composite
- 48.34/100
- National rank
- #2147
- State rank
- #71 of 131 in VA
Livability — Orange
- Score
- 74/100
- State rank
- #151
- US rank
- #4842
Category grades
Schools grade is shown separately in the Schools card above.
Census & demographics
- Population (ZIP)
- 10,877
Population outlook (Orange County) Hauer SSP2
- Today (2025)
- 38,758 people
- By 2030
- 40,411 · +4.3%
- By 2040
- 43,477 · +12.2%
- By 2050
- 45,856 · +18.3%
- By 2075
- 51,067 · +31.8%
- By 2100
- 51,387 · +32.6%
Race, ethnicity, and origin ACS 2023
- Neighborhood character
- Predominantly White (76%)
- Race & ethnicity
- White 76% Black 17% Two or more races 4% Hispanic / Latino 4%
- Common ancestry
- Portuguese 3% Lithuanian 1% Italian 1%
- Foreign-born
- 2% · Canada
- Languages at home
- 95% English-only · Spanish 3% German/W. Germanic 1% Other Indo-European 1%
Political lean MEDSL · Orange
- 2024 margin
- Strong R (+24.7) · D 37.2% · R 61.9%
- 2008→2024 swing
- -15.8pp toward R · 2008: -8.8pp · 2024: -24.7pp
- All cycles
- 2024: R+24.7 2020: R+21.4 2016: R+26.6 2012: R+14.5 2008: R+8.8
Not yet ingested
- Civics
- —
Market trends
- HPI YoY
- ▼ -8.60%
- Current HPI
- 350.4024
- Rent YoY
- —
- Metro
- —
- State GDP YoY
- ▲ 2.40%
- F500 in state
- 50
Industry mix (Fortune 500 HQ in VA)
| Industry | F500 HQs | Revenue |
|---|---|---|
| Aerospace / Defense | 4 | $236B |
|
||
| Technology / Defense | 3 | $32B |
|
||
| Financial Services | 2 | $176B |
|
||
| Utilities | 2 | $27B |
|
||
| Insurance | 2 | $25B |
|
||
| Technology | 2 | $15B |
|
||
Price history
+3.4% since first listed8 events — show timeline
- 2026-06-12 Listed $150,000 CAAR
- 2008-06-25 Sold (MLS) $98,000 MRIS
- 2008-05-07 Delisted — MRIS
- 2008-02-01 Listed $105,000 MRIS
- 2007-01-11 Sold (Public Records) $148,000 Public Records
- 2007-01-11 Sold (MLS) $148,000 MRIS
- 2006-11-13 Delisted — MRIS
- 2006-06-09 Listed $145,000 MRIS
Property tax history
-0.3%/yrLatest (2025): $760 · +10.9% YoY. Source: county tax records.
Cash-flow waterfall
monthlySold comps — $/sqft
last 12 mo · ≤1 miLoading sold comps…