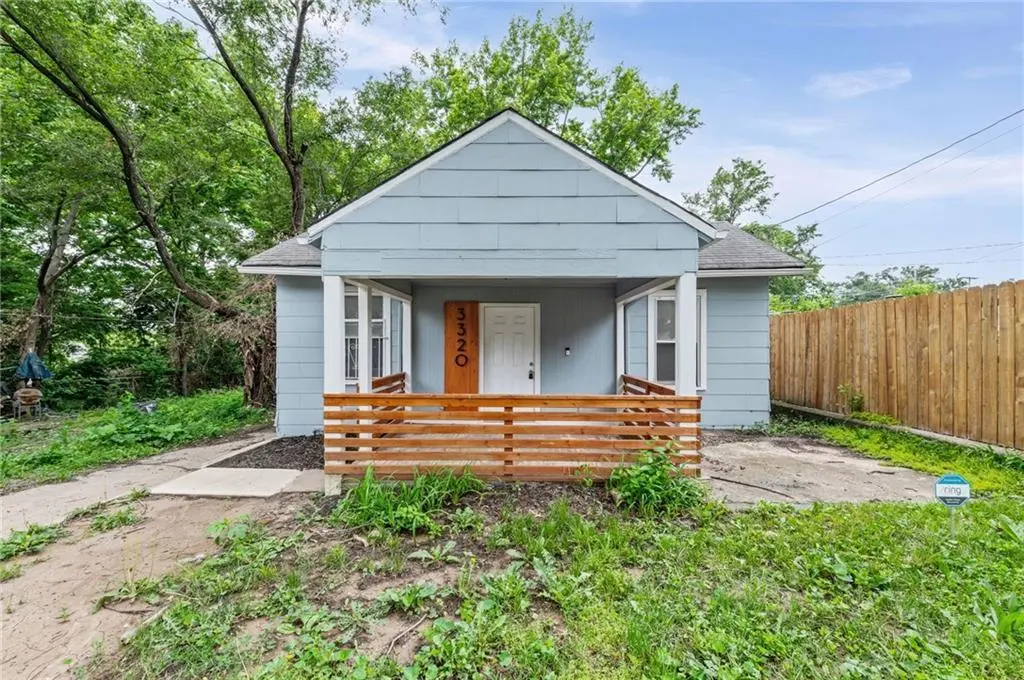
3320 Spruce Ave · Kansas City, MO
Flood risk 1/10 · Minimal
- FEMA flood zone
- X (unshaded)
- Chance of flooding over 30 yrs
- 0.0%
- Est. flood insurance / yr
- $507 – $1,088
Fire risk 1/10 · Minimal
- Est. fire insurance / yr
- $1,054 – $1,958
Heat risk 4/10 · Minor
- Hot days now (above 107°F)
- 7 days/yr
- Hot days in 30 yrs
- 16 days/yr
Wind risk 2/10 · Minimal
- Chance of severe wind over 30 yrs
- —
Air-quality risk 3/10 · Minor
- Unhealthy air days now
- 2 days/yr
- Unhealthy air days in 30 yrs
- 3 days/yr
Risk factors via First Street. Map © Google.
Why this score? — see what drove the C grade
The composite is a weighted blend of 9 inputs, each scored 0–100. Each bar is that input's sub-score; the figure is the points it added to the 100-point composite (weight × sub-score).
- Cash flow +23.0/30.0
- Appreciation +10.0/10.0
- DSCR +7.4/10.0
- 1% rule +4.8/10.0
- Livability +3.9/5.0
- Rent growth +3.7/5.0
- Condition / age +2.5/5.0
- Schools +1.5/10.0
- ARV discount +0.0/15.0
$109,000
🖨 Deal sheet (PDF) 📄 Offer letter ✓ Due diligence
Listing remarks
Stop renting and step into homeownership with this incredible, completely move-in-ready 3 bed 1 bath opportunity priced at an unbelievable $109,000. Finding a fully updated home at this price point in the Kansas City market is exceptionally rare, offering a turnkey solution without the stress or expense of ongoing projects. Every corner of this residence has been refreshed, allowing for an immediate move-in where you can simply unpack your bags and enjoy the benefits of a completely updated interior from day one. The location is a commuter's dream, putting you right in the center of everything Kansas City has to offer. The property is situated just minutes from the Kansas City VA Medical Ce
Key facts
- Fully updated home
- Updated interior
- 5,440 sq ft lot
Tags
Property features AI
Finance
- Other: Living area listed as 725 (public records)
- HOA & community: No association fees
Exterior
- Parking: Detached 1-car garage
- Utilities: Public water; Public sewer
- Home design: Single-family residence; Bungalow style; Residential property
- Construction: Frame construction; Composition roof; Approximately 101+ years old
- Exterior features: Front porch; City lot
Interior
- Kitchen: Eat-in kitchen
- Bedrooms: 3 bedrooms
- Bathrooms: 1 full bathroom
- Heating & cooling: Forced air heating; Window units for cooling
- Interior features: Partial basement; Eat-in kitchen; Bungalow floor plan
- Laundry & utility: Laundry off the kitchen
Neighborhood map
What this means for you Summary
Snapshot
- This is a 1-bed/1.0-bath single-family listed at $109k.
Deal economics
- At list price, monthly cash flow is $194 ($2k/yr) — positive.
- The deal already cash-flows at list — no discount required.
- To meet the 1% rule (rent ≥ 1% of price), the offer needs to be $107k (2.2% below list).
- Recommended offer: $107k (2.2% below list) — sets the bar for 1% rule.
- Cap rate 8.4% vs local median 3.9% in Kansas City — top-decile yield for the area; either an underpriced asset or a hidden risk that comps aren't pricing in. Stress-test before assuming the spread holds.
Location & tenants
- Location reads 78/100 on livability (#28 in MO, #2,671 nationally) — a middle-class / working-renter tenant base. Strengths: amenities A+, commute A+, cost of living A+; Watch: crime F.
- Kansas City 33 (urban): math 12% / reading 24% proficiency, ranked #308 of 324 in MO (top 95%) — low school quality limits family demand, transient renter base, plan for 1-2y turnover; 75% free/reduced lunch — lower-income household profile, screen leases tightly.
- Zoned schools: Ac Prep Elementary (math 12% / reading 27%, grade F, #941 of 1,115 statewide, top 86%, 341 students, 99% FRL); Central Middle School (math 0% / reading 9%, grade F, #388 of 391 statewide, top 99%, 428 students, 99% FRL); Central High School (math 2% / reading 17%, grade F, #507 of 521 statewide, top 98%, 535 students, 99% FRL) — zoned schools average 99% FRL vs 75% district-wide (24 pts higher); higher-poverty schools than district average — tighter screening recommended.
- Market conditions: Rents rising fast (+4.7%/yr); 87 active listings in the ZIP; 6 comparable units currently listed for rent nearby; rentals at typical pace (median 19d on market — plan ~3-4 weeks tenant-placement turnaround); lower-income renter base — watch delinquency; 4,002 units permitted in Jackson County in 2024 (2,271 in 5+ unit buildings).
- This rent runs 35% of the median local income ($36k/yr) — at the standard rent-burdened threshold; future hikes will face affordability resistance.
Forward outlook
- In year one you build about $12k of equity ($754 loan paydown + $11k appreciation (10.0% local appreciation)).
- Jackson County population projected at +4% by 2050 — modest demand growth; plan on rents tracking national, not racing it.
- At projected returns (10.0% appreciation + 4.7% rent growth), your $31k cash investment doubles in ~3 years — after that, you're playing with house money.
- By year 4, paydown + projected appreciation supports a ~$41k cash-out refi (75% LTV) — recoverable capital for the next deal without selling this one.
Negotiation context
- It's been on market 26 days — a 2% lower offer ($107k) is reasonable based on typical stale-listing flexibility.
- 7 sale attempts since 25y ago with the ask held roughly flat each time — persistent listings suggest the price (not the market) is what's stuck; bring a comps-based counter.
Risks & watch-outs
- Watch-outs: built in 1921 — expect roof / HVAC / electrical / plumbing capex.
Questions for the listing agent
- Built in 1921 — when were the roof, HVAC, electrical panel, plumbing, and water heater last replaced?
- Is there a deadline driving the sale (1031 exchange, divorce, estate, relocation)? That informs how much negotiation room exists.
- Crime grade is F in this area — have there been break-ins, vandalism, or insurance claims at this property in the last 3 years? What carrier currently insures it and at what premium?
- What's the average days-on-market for RENTAL listings here right now (not sales)? A rising rental-DOM trend means longer vacancies and softer asking-rent achievability than the comps imply.
- What's the recent tenant-quality profile in this submarket — average credit score on applications, eviction rate, late-payment / NSF rate, and stable-employment percentage? A property-management company in the area should have these aggregated.
- How much new for-sale + rental construction is in the pipeline within 1–3 miles? Heavy new supply typically softens prices + rents 12–24 months out; constrained supply supports both.
Investment metrics
- 1% rule
- 0.98% ✗
- Cap rate
- 8.42%
- Cash-on-cash
- 7.61%
- DSCR
- 1.34
- GRM
- 8.5
CMA / ARV
- ARV (on-the-fly)
- $75,400
- Comps found
- 12
Show comp detail 12 sales within ~0.75 mi
| Address | Dist | Beds/Ba | Sqft | Sold | Price | $/sf | Match |
|---|---|---|---|---|---|---|---|
| 3601 Norton Ave | 0.34mi | 2/1.0 (+1) | 725 (0%) | 3mo | $40,000 | $55 | 76 |
| 3133 Chelsea Ave | 0.39mi | 2/1.0 (+1) | 762 (+5%) | 1mo | $78,990 | $104 | 68 |
| 3304 Norton St | 0.12mi | 2/1.0 (+1) | 792 (+9%) | 9mo | $90,000 | $114 | 66 |
| 3207 Kensington Ave | 0.18mi | 2/1.0 (+1) | 678 (-6%) | 12mo | $84,900 | $125 | 66 |
| 3224 Lister Ave | 0.27mi | 2/1.0 (+1) | 792 (+9%) | 3mo | $30,000 | $38 | 65 |
| 3610 Norton Ave | 0.37mi | 2/1.0 (+1) | 672 (-7%) | 8mo | $75,000 | $112 | 59 |
| 3423 Cleveland Ave | 0.31mi | 2/1.0 (+1) | 792 (+9%) | 9mo | $80,000 | $101 | 58 |
| 4507 E 35th St | 0.27mi | 2/1.0 (+1) | 792 (+9%) | 14mo | $79,900 | $101 | 55 |
| 3017 Poplar Ave | 0.54mi | 2/1.0 (+1) | 760 (+5%) | 13mo | $72,000 | $95 | 51 |
| 3625 Jackson Ave | 0.40mi | 2/1.0 (+1) | 809 (+12%) | 10mo | $110,000 | $136 | 49 |
| 3017 York St | 0.57mi | 2/1.0 (+1) | 789 (+9%) | 16mo | $70,000 | $89 | 41 |
| 3208 E 30th Ter | 0.73mi | 2/1.0 (+1) | 828 (+14%) | 12mo | $120,000 | $145 | 27 |
Match score weights: distance 35% · size 25% · config 20% · recency 20%. Top-matched comps best support the ARV.
Projected returns pro-forma
10.0% appreciation · 4.65% rent growth · sell at horizon
- IRR
- 30.4%
- Equity multiple
- 3.41×
- Total profit
- $73,442
- Equity at exit
- $98,196
- IRR
- 26.8%
- Equity multiple
- 7.89×
- Total profit
- $210,387
- Equity at exit
- $211,763
Cash invested: $30,520 (down + closing). Projections, not guarantees.
Landlord ↔ Tenant lean methodology
- Overall (STATE)
- 81 Strongly Landlord-Friendly
- State Missouri
- 81 Strongly Landlord-Friendly · R+10
- County
- — inherits STATE
- City
- — inherits STATE
ZIP-level market 64128
- Home prices YoY
- 21.6%
- Rents YoY
- 4.7%
- Active inventory
- 87
- Price-to-rent
- 8.5×
Monthly cashflow live
- Estimated rent
- $1,066 high interval (Pro) →
- Mortgage (P&I)
- −$572
- Tax from tax record
- −$32 /mo · $379/yr
- Insurance
- −$45
- HOA
- −$0
- Vacancy / Maint / Mgmt
- −$224
- Net cashflow
- $194
Break-even live
Sensitivity live
| Price | -10% $255 | -5% $224 | +0% $194 | +5% $163 | +10% $132 |
|---|---|---|---|---|---|
| Rent | -10% $109 | -5% $151 | +0% $194 | +5% $236 | +10% $278 |
| Rate | -1.0pp $248 | -0.5pp $221 | base $194 | +0.5pp $165 | +1.0pp $137 |
UW: 25.0% down · 7.5% · 30yr · 1.5% tax · 5.0% vac · 8.0% maint · 8.0% mgmt
Financing live
Cash to close
- Down payment
- $27,250
- Closing costs
- $3,270
- Reserves months
- —
- Total cash needed
- —
Loan-product check · same deal, 3 products live
Conventional
25% down · 7.5% · 30yr
- Down + closing
- —
- Monthly P&I
- —
- Monthly cashflow
- —
- DSCR
- —
- Eligible?
- —
Personal DTI + credit; lowest rate.
DSCR
20% down · 8.5% · 30yr
- Down + closing
- —
- Monthly P&I
- —
- Monthly cashflow
- —
- DSCR
- —
- Eligible?
- —
No personal income docs; deal must DSCR.
Hard money
10% down · 12.0% · 12mo
- Down + closing
- —
- Monthly P&I
- —
- Monthly cashflow
- —
- DSCR
- —
- Eligible?
- —
Short-term bridge; refi at stabilization.
Rent comps 6 comps
| Address | Beds | Baths | Sqft | Rent | $/sqft | DOM | Units | Dist |
|---|---|---|---|---|---|---|---|---|
| 3437 Jackson Ave Kansas City, MO | 2.0 | 1.0 | 700 | $1,150 | $1.64 | 18d | 1 | 0.17mi |
| 3243 Denver Dr Kansas City, MO | 1.0–3.0 | 1.0 | 862 | $950 | $1.10 | 45d | 1 | 0.65mi |
| 2855 Van Brunt Blvd Unit A Kansas City, MO | 2.0 | 1.0 | 744 | $1,080 | $1.45 | 45d | 1 | 0.91mi |
| 2454 Benton Blvd Unit 2456-1 Kansas City, MO | 1.0 | 1.0 | 750 | $1,000 | $1.33 | 18d | 1 | 1.36mi |
| 2454 Benton Blvd Unit 2460-3 Kansas City, MO | 1.0 | 1.0 | 750 | $1,100 | $1.47 | 18d | 1 | 1.36mi |
| 2454 Benton Blvd Unit 2458-2 Kansas City, MO | 1.0 | 1.0 | 750 | $1,000 | $1.33 | 9d | 1 | 1.36mi |
Listing history 37 events
-
2026-06-21days on market $109,000 Active 26 DOM
-
2026-06-18days on market $109,000 Active 23 DOM
-
2026-06-17days on market $109,000 Active 22 DOM
-
2026-06-16days on market $109,000 Active 21 DOM
-
2026-06-15days on market $109,000 Active 20 DOM
-
2026-06-13days on market $109,000 Active 18 DOM
-
2026-06-09days on market $109,000 Active 14 DOM
-
2026-06-08days on market $109,000 Active 13 DOM
-
2026-06-07days on market $109,000 Active 12 DOM
-
2026-06-05days on market $109,000 Active 9 DOM
-
2026-06-03days on market $109,000 Active 8 DOM
-
2026-06-02days on market $109,000 Active 7 DOM
-
2026-06-01days on market $109,000 Active 6 DOM
-
2026-05-31days on market $109,000 Active 5 DOM
-
2026-05-26$109,000 Active
-
2026-04-29$1,095
-
2025-08-24historical $995
-
2025-08-13$995
-
2024-12-30historical
-
2024-10-24$59,000 Active
-
2023-07-28soldstatus
-
2016-09-20historical
-
2016-01-16$30,000 Active
-
2014-07-28soldstatus
-
2005-08-16soldstatus
-
2005-08-05soldstatus
-
2004-09-30soldstatus
-
2004-09-08soldstatus
-
2004-09-08soldstatus
-
2004-08-02$22,000
-
2001-01-31soldstatus
-
2001-01-05$15,000
-
1999-08-12soldstatus
-
1998-07-20soldstatus
-
1998-07-20soldstatus
-
1997-02-11soldstatus
-
1996-01-11soldstatus
ⓘ Source: listings_history table (triggers on properties + properties_extension) + one-shot
backfill from property_details.listing_events for pre-trigger history.
Tax reassessment forecast MO · Resets to sale price
- Current annual tax
- $379 · $32/mo
- Projected year-2 tax
- $1,057 · $88/mo
- Expected delta
- +$678/yr (+$57/mo · 178.8%)
ⓘ Screening estimate from a state-policy table — verify with the county assessor before closing.
Climate risk First Street
- Flood 1/10 Low FEMA zone X (unshaded) · 0% chance over 30 yrs
- Wildfire 1/10 Low
- Heat 4/10 Moderate 7 d/yr ≥107°F today · 16 d/yr by 30 yrs out
- Wind 2/10 Low
- Air quality 3/10 Moderate 2 unhealthy d/yr today · 3 by 30 yrs out
Nearby sold comps map
Loading sold comps map…
Walkable amenities ~0.75 mi
Loading nearby amenities…
Taxation est. · year 1
- Rental income
- $12,792
- − Mortgage interest
- −$6,106
- − Property taxes
- −$379
- − Insurance
- −$545
- − Repairs & maintenance
- −$1,023
- − Management
- −$1,023
- − Depreciation
- −$3,171
- Taxable income
- $545
- Est. tax owed @ 24.0%
- −$131
- After-tax cash flow
- $2,192/yr
For passive investors: Depreciation is non-cash, so a rental often shows a tax loss while cash-flowing — sheltering income. Rental losses are passive: they offset passive income freely, and up to $25,000/yr can offset ordinary (W-2) income if you actively participate and your MAGI is under $100k (phasing out to $0 by $150k); unused losses carry forward. On sale, claimed depreciation is recaptured at up to 25%, and gains may owe capital-gains tax (a 1031 exchange can defer both). Figures are a year-1 estimate at your 24.0% rate — not tax advice; consult a CPA.
Schools (NCES district)
- District
- Kansas City 33
- NCES district ID
- 2916400
- Math proficiency
- 12% ▼ -8.00%
- Reading proficiency
- 24% ▬ 0.00%
- Median HH income
- $35,227
- Composite
- 14.8/100
- National rank
- #9387
- State rank
- #308 of 324 in MO
Livability — Kansas City
- Score
- 78/100
- State rank
- #28
- US rank
- #2671
Category grades
Schools grade is shown separately in the Schools card above.
Census & demographics
- Census place
- Kansas City, MO
- County
- Jackson County · 687,798 people
- City population
- 439,467
- Metro
- Kansas City, MO-KS
- Population (ZIP)
- 11,912
- Household income
- $36,088
- Rent vs Own
- Severe rent burden
- 946.0
Population outlook (Jackson County) Hauer SSP2
- Today (2025)
- 719,589 people
- By 2030
- 731,456 · +1.6%
- By 2040
- 746,689 · +3.8%
- By 2050
- 749,289 · +4.1%
- By 2075
- 736,227 · +2.3%
- By 2100
- 668,210 · -7.1%
Race, ethnicity, and origin ACS 2023
- Neighborhood character
- Predominantly Black (79%)
- Race & ethnicity
- Black 79% Hispanic / Latino 9% White 8% Two or more races 7%
- Hispanic origin (detail)
- Mexican 6%
- Common ancestry
- Swedish 1% Hispanic 1%
- Foreign-born
- 7% · Canada
- Languages at home
- 88% English-only · Spanish 7% French/Haitian/Cajun 2%
Political lean MEDSL · Jackson
- 2024 margin
- D (+19.3) · D 58.9% · R 39.5% · Other 1.6%
- 2008→2024 swing
- -6.1pp toward R · 2008: 25.4pp · 2024: 19.3pp
- All cycles
- 2024: D+19.3 2020: D+22.0 2016: D+16.6 2012: D+19.0 2008: D+25.4
Not yet ingested
- Civics
- —
Market trends
- HPI YoY
- ▲ 73.41%
- Current HPI
- 412.6862
- Rent YoY
- ▲ 4.65%
- Metro
- Kansas City, MO-KS
- State GDP YoY
- ▲ 1.84%
- F500 in state
- 20
Industry mix (Fortune 500 HQ in MO)
| Industry | F500 HQs | Revenue |
|---|---|---|
| Healthcare | 1 | $163B |
|
||
| Insurance | 1 | $21B |
|
||
| Industrial Technology | 1 | $17B |
|
||
| Retail | 1 | $16B |
|
||
| Industrial Distribution | 1 | $10B |
|
||
| Utilities | 1 | $9B |
|
||
Price history
+626.7% since first listed23 events — show timeline
- 2026-05-26 Listed $109,000 Heartland MLS as Distributed by MLS Grid
- 2026-04-29 Listed for Rent $1,095 SHOWMOJO
- 2025-08-24 Rental Removed $995 SHOWMOJO
- 2025-08-13 Listed for Rent $995 SHOWMOJO
- 2024-12-30 Listing Removed — Heartland MLS as Distributed by MLS Grid
- 2024-10-24 Listed $59,000 Heartland MLS as Distributed by MLS Grid
- 2023-07-28 Sold (Public Records) — Public Records
- 2016-09-20 Listing Removed — Heartland MLS as Distributed by MLS Grid
- 2016-01-16 Listed $30,000 Heartland MLS as Distributed by MLS Grid
- 2014-07-28 Sold (Public Records) — Public Records
- 2005-08-16 Sold (Public Records) — Public Records
- 2005-08-05 Sold (Public Records) — Public Records
- 2004-09-30 Sold (Public Records) — Public Records
- 2004-09-08 Sold (Public Records) — Public Records
- 2004-09-08 Sold (MLS) — Heartland MLS as Distributed by MLS Grid
- 2004-08-02 Listed $22,000 Heartland MLS as Distributed by MLS Grid
- 2001-01-31 Sold (MLS) — Heartland MLS as Distributed by MLS Grid
- 2001-01-05 Listed $15,000 Heartland MLS as Distributed by MLS Grid
- 1999-08-12 Sold (Public Records) — Public Records
- 1998-07-20 Sold (Public Records) — Public Records
- 1998-07-20 Sold (Public Records) — Public Records
- 1997-02-11 Sold (Public Records) — Public Records
- 1996-01-11 Sold (Public Records) — Public Records
Property tax history
+4.5%/yrLatest (2025): $379 · -3.5% YoY. Source: county tax records.
Cash-flow waterfall
monthlySold comps — $/sqft
last 12 mo · ≤1 miLoading sold comps…