 🏗️ New Construction
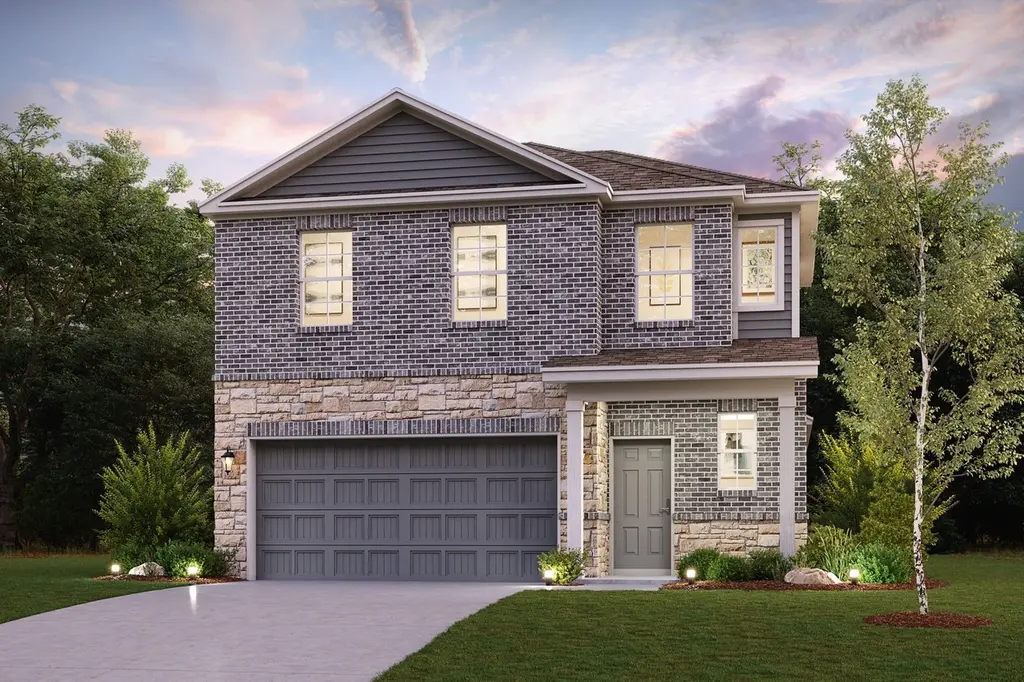
645 Pomegranate Ln · La Marque, TX
Flood risk No data
- FEMA flood zone
- —
- Chance of flooding over 30 yrs
- —
- Est. flood insurance / yr
- —
Fire risk No data
- Est. fire insurance / yr
- —
Heat risk No data
- Hot days now (above threshold)
- —
- Hot days in 30 yrs
- —
Wind risk No data
- Chance of severe wind over 30 yrs
- —
Air-quality risk No data
- Unhealthy air days now
- —
- Unhealthy air days in 30 yrs
- —
Risk factors via First Street. Map © Google.
Why this score? — see what drove the C- grade
The composite is a weighted blend of 9 inputs, each scored 0–100. Each bar is that input's sub-score; the figure is the points it added to the 100-point composite (weight × sub-score).
- Cash flow +20.5/30.0
- ARV discount +7.5/15.0
- DSCR +6.5/10.0
- 1% rule +4.5/10.0
- Rent growth +3.5/5.0
- Livability +3.0/5.0
- Schools +2.6/10.0
- Condition / age +2.5/5.0
- Appreciation +0.0/10.0
$284,900
🖨 Deal sheet (PDF) 📄 Offer letter ✓ Due diligence
Listing remarks MLS
The open-concept design of the two-story Lexington floor plan shows the huge island kitchen connected to the great room and dining room. The open-feel of the home is popular with today's sophisticated buyer, who is looking for a design that fosters togetherness in the home and makes entertaining fun. The use of space in the Lexington is well thought out, with the primary suite privately situated on the first floor, while the secondary bedrooms are on the second floor.
Key facts
- Island kitchen
- Primary suite
- Secondary bedrooms
Tags
Property features AI
Finance
- Other: Disclosures: Municipal Utility District Disclosure
- HOA & community: Association: ACMI Management; Annual association fee of $700; Community features include curbs
Exterior
- Parking: Attached 2-car garage
- Security: Prewired for security; Smoke detectors installed
- Utilities: Public water; Public sewer
- Home design: Residential property; Under construction (new construction); Slab foundation; Composition roof
- Construction: Built by Century Communities; Brick, cement siding, and stone exterior; Year built: 2026
- Exterior features: Deck; Patio; Private yard; Concrete road surface; Located in a subdivision
Interior
- Kitchen: Dishwasher; Disposal; Gas oven; Gas range; Microwave
- Bedrooms: Primary bedroom on the first floor (14.8 x 12); Three additional bedrooms on the second floor (approx. 9'-11.5" x 11; 10.7 x 11.2; 10.7 x 11)
- Flooring: Carpet; Plank; Tile; Vinyl
- Bathrooms: Two full bathrooms; One half bathroom
- Heating & cooling: Central heating (gas); Central electric air conditioning
- Interior features: High ceilings; Kitchen island; Kitchen/family room combo; Bath in primary bedroom; Pantry; Quartz counters; Separate shower; Tub/shower combination; Ceiling fans; Kitchen/dining combo; Programmable thermostat; Low emissivity windows; ENERGY STAR qualified appliances; Ventilation for improved indoor air quality; Radiant attic barrier and upgraded insulation
- Laundry & utility: Washer hookup; Electric dryer hookup; Tankless water heater
Neighborhood map
What this means for you Summary
Snapshot
- This is a 4-bed/2.5-bath land listed at $285k.
Deal economics
- At list price, monthly cash flow is $363 ($4k/yr) — positive.
- The deal already cash-flows at list — no discount required.
- To meet the 1% rule (rent ≥ 1% of price), the offer needs to be $262k (8.0% below list).
- Recommended offer: $262k (8.0% below list) — sets the bar for 1% rule.
- Cap rate 7.9% vs local median 5.6% in La Marque — top-decile yield for the area; either an underpriced asset or a hidden risk that comps aren't pricing in. Stress-test before assuming the spread holds.
Location & tenants
- Location reads 59/100 on livability (#1,136 in TX) — a working-class tenant base; expect higher turnover. Strengths: cost of living A+, housing A+; Watch: employment D, crime F, amenities F.
- Hitchcock ISD (suburban): math 28% / reading 31% proficiency, ranked #628 of 826 in TX (top 76%) — low school quality limits family demand, transient renter base, plan for 1-2y turnover; 72% free/reduced lunch — lower-income household profile, screen leases tightly.
- Zoned schools: Hitchcock Pri (453 students, 85% FRL); Crosby Middle (math 25% / reading 33%, grade F, #1,103 of 1,662 statewide, top 67%, 410 students, 84% FRL); Hitchcock H S (math 47% / reading 47%, grade D-, #591 of 1,632 statewide, top 38%, 470 students, 77% FRL).
- Market conditions: Rents rising (+4.0%/yr); 661 active listings in the ZIP; 2 comparable units currently listed for rent nearby; 3,258 units permitted in Galveston County in 2024 (0 in 5+ unit buildings).
- This rent runs 42% of the median local income ($75k/yr) — at the standard rent-burdened threshold; future hikes will face affordability resistance.
Forward outlook
- Local home prices are declining (-3.0%/yr); year-one equity from $2k of loan paydown is wiped out by about $8k of value loss. Plan a longer hold.
- Galveston County population projected at +43% by 2050 — long-run rental-demand tailwind backs the buy-and-hold thesis.
Negotiation context
- It's been on market 34 days — a 3% lower offer ($276k) is reasonable based on typical stale-listing flexibility.
- 2 sale attempts with the ask held roughly flat each time — persistent listings suggest the price (not the market) is what's stuck; bring a comps-based counter.
Questions for the listing agent
- It's been on market 34 days. Have you received any prior offers? Is the seller open to a 8% concession, seller financing, or rate buy-down credit?
- What does the HOA fee cover, when was the last increase, and are there any pending special assessments or reserve-fund shortfalls?
- Is there a deadline driving the sale (1031 exchange, divorce, estate, relocation)? That informs how much negotiation room exists.
- Schools are F-rated, which usually means shorter tenancies and higher turnover. Who's the typical renter profile here, and what's been the actual vacancy rate?
- Crime grade is F in this area — have there been break-ins, vandalism, or insurance claims at this property in the last 3 years? What carrier currently insures it and at what premium?
- What's the average days-on-market for RENTAL listings here right now (not sales)? A rising rental-DOM trend means longer vacancies and softer asking-rent achievability than the comps imply.
- What's the recent tenant-quality profile in this submarket — average credit score on applications, eviction rate, late-payment / NSF rate, and stable-employment percentage? A property-management company in the area should have these aggregated.
- How much new for-sale + rental construction is in the pipeline within 1–3 miles? Heavy new supply typically softens prices + rents 12–24 months out; constrained supply supports both.
Investment metrics
- 1% rule
- 0.95% ✗
- Cap rate
- 7.87%
- Cash-on-cash
- 5.64%
- DSCR
- 1.25
- GRM
- 8.8
CMA / ARV
- ARV (median comp)
- $275,990
- List price
- $284,900
- Delta
- 3.23%
- Verdict
- FAIR
- Comps
- 20 within 1.0 mi
Projected returns pro-forma
-3.0% appreciation · 3.95% rent growth · sell at horizon
- IRR
- -6.6%
- Equity multiple
- 0.75×
- Total profit
- $-19,150
- Equity at exit
- $41,151
- IRR
- 4.0%
- Equity multiple
- 1.30×
- Total profit
- $23,351
- Equity at exit
- $23,863
Cash invested: $77,277 (down + closing). Projections, not guarantees.
Landlord ↔ Tenant lean methodology
- Overall (STATE)
- 87 Strongly Landlord-Friendly
- State Texas
- 87 Strongly Landlord-Friendly · R+5
- County
- — inherits STATE
- City
- — inherits STATE
ZIP-level market 77568
- Home prices YoY
- -22.7%
- Rents YoY
- 4.0%
- Active inventory
- 661
- Price-to-rent
- 9.1×
Monthly cashflow live
- Estimated rent
- $2,622 medium interval (Pro) →
- Mortgage (P&I)
- −$1,447
- Tax from tax record
- −$88 /mo · $1,058/yr
- Insurance
- −$115
- HOA
- −$58
- Vacancy / Maint / Mgmt
- −$551
- Net cashflow
- $363
Break-even live
Sensitivity live
| Price | -10% $519 | -5% $441 | +0% $363 | +5% $285 | +10% $207 |
|---|---|---|---|---|---|
| Rent | -10% $156 | -5% $260 | +0% $363 | +5% $467 | +10% $570 |
| Rate | -1.0pp $502 | -0.5pp $433 | base $363 | +0.5pp $292 | +1.0pp $219 |
UW: 25.0% down · 7.5% · 30yr · 1.5% tax · 5.0% vac · 8.0% maint · 8.0% mgmt
Financing live
Cash to close
- Down payment
- $68,998
- Closing costs
- $8,280
- Reserves months
- —
- Total cash needed
- —
Loan-product check · same deal, 3 products live
Conventional
25% down · 7.5% · 30yr
- Down + closing
- —
- Monthly P&I
- —
- Monthly cashflow
- —
- DSCR
- —
- Eligible?
- —
Personal DTI + credit; lowest rate.
DSCR
20% down · 8.5% · 30yr
- Down + closing
- —
- Monthly P&I
- —
- Monthly cashflow
- —
- DSCR
- —
- Eligible?
- —
No personal income docs; deal must DSCR.
Hard money
10% down · 12.0% · 12mo
- Down + closing
- —
- Monthly P&I
- —
- Monthly cashflow
- —
- DSCR
- —
- Eligible?
- —
Short-term bridge; refi at stabilization.
Rent comps 2 comps
| Address | Beds | Baths | Sqft | Rent | $/sqft | DOM | Units | Dist |
|---|---|---|---|---|---|---|---|---|
| 453 Maple Bend Ln La Marque, TX | 3.0 | 2.0 | 1860 | $2,071 | $1.11 | 22d | 1 | 0.77mi |
| 14403 Daniel Shores Dr La Marque, TX | 4.0 | 3.0–3.5 | 1872 | $2,600 | $1.39 | 0d | 12 | 1.48mi |
HOA detail
- Monthly dues
- $58 · $696/yr
Listing history 18 events
-
2026-06-21days on market $284,900 Active 34 DOM
-
2026-06-18days on market $284,900 Active 31 DOM
-
2026-06-17days on market $284,900 Active 30 DOM
-
2026-06-16days on market $284,900 Active 29 DOM
-
2026-06-15days on market $284,900 Active 28 DOM
-
2026-06-13days on market $284,900 Active 26 DOM
-
2026-06-13days on market $284,900 Active 25 DOM
-
2026-06-09days on market $284,900 Active 22 DOM
-
2026-06-08days on market $284,900 Active 21 DOM
-
2026-06-07days on market $284,900 Active 20 DOM
-
2026-06-04days on market $284,900 Active 17 DOM
-
2026-06-03days on market $284,900 Active 16 DOM
-
2026-06-02days on market $284,900 Active 15 DOM
-
2026-06-01days on market $284,900 Active 14 DOM
-
2026-05-31days on market $284,900 Active 13 DOM
-
2026-05-18$284,800 Active 498-char remark
-
2026-05-12price $284,800 472-char remark
Show marketing remark (472 chars)
The open-concept design of the two-story Lexington floor plan shows the huge island kitchen connected to the great room and dining room. The open-feel of the home is popular with today's sophisticated buyer, who is looking for a design that fosters togetherness in the home and makes entertaining fun. The use of space in the Lexington is well thought out, with the primary suite privately situated on the first floor, while the secondary bedrooms are on the second floor.
-
2026-04-29$284,900 Active 472-char remark
Show marketing remark (472 chars)
The open-concept design of the two-story Lexington floor plan shows the huge island kitchen connected to the great room and dining room. The open-feel of the home is popular with today's sophisticated buyer, who is looking for a design that fosters togetherness in the home and makes entertaining fun. The use of space in the Lexington is well thought out, with the primary suite privately situated on the first floor, while the secondary bedrooms are on the second floor.
ⓘ Source: listings_history table (triggers on properties + properties_extension) + one-shot
backfill from property_details.listing_events for pre-trigger history.
Tax reassessment forecast TX · Resets to sale price
- Current annual tax
- $1,058 · $88/mo
- Projected year-2 tax
- $5,214 · $434/mo
- Expected delta
- +$4,155/yr (+$346/mo · 392.6%)
ⓘ Screening estimate from a state-policy table — verify with the county assessor before closing.
Nearby sold comps map
Loading sold comps map…
Walkable amenities ~0.75 mi
Loading nearby amenities…
Taxation est. · year 1
- Rental income
- $31,467
- − Mortgage interest
- −$15,460
- − Property taxes
- −$1,058
- − Insurance
- −$1,380
- − Repairs & maintenance
- −$2,517
- − Management
- −$2,517
- − HOA
- −$696
- − Depreciation
- −$8,029
- Taxable loss
- −$190
- Est. tax savings @ 24.0%
- +$46
- After-tax cash flow
- $4,403/yr
For passive investors: Depreciation is non-cash, so a rental often shows a tax loss while cash-flowing — sheltering income. Rental losses are passive: they offset passive income freely, and up to $25,000/yr can offset ordinary (W-2) income if you actively participate and your MAGI is under $100k (phasing out to $0 by $150k); unused losses carry forward. On sale, claimed depreciation is recaptured at up to 25%, and gains may owe capital-gains tax (a 1031 exchange can defer both). Figures are a year-1 estimate at your 24.0% rate — not tax advice; consult a CPA.
Schools (NCES district)
- District
- Hitchcock ISD
- NCES district ID
- 4823310
- Math proficiency
- 28% ▼ -2.00%
- Reading proficiency
- 31% ▼ -4.00%
- Median HH income
- $47,041
- Composite
- 25.5/100
- National rank
- #7439
- State rank
- #628 of 826 in TX
Livability — La Marque
- Score
- 59/100
- State rank
- #1136
- US rank
- #20037
Category grades
Schools grade is shown separately in the Schools card above.
Census & demographics
- Census place
- La Marque, TX
- County
- Galveston County · 357,330 people
- City population
- 23,083
- Metro
- Houston-The Woodlands-Sugar Land, TX
- Population (ZIP)
- 23,083
- Household income
- $74,694
- Rent vs Own
- Severe rent burden
- 700.0
Population outlook (Galveston County) Hauer SSP2
- Today (2025)
- 390,640 people
- By 2030
- 425,226 · +8.9%
- By 2040
- 493,765 · +26.4%
- By 2050
- 559,698 · +43.3%
- By 2075
- 719,260 · +84.1%
- By 2100
- 819,628 · +109.8%
Race, ethnicity, and origin ACS 2023
- Neighborhood character
- Highly diverse neighborhood (Simpson 0.71)
- Race & ethnicity
- White 37% Hispanic / Latino 29% Black 26% Two or more races 17% Asian 3%
- Hispanic origin (detail)
- Mexican 22% Puerto Rican 1%
- Common ancestry
- Lithuanian 1% Italian 1% Serbian 1%
- Foreign-born
- 8% · Canada
- Languages at home
- 77% English-only · Spanish 21% Tagalog/Filipino 1% Other Asian/Pacific 1%
Political lean MEDSL · Galveston
- 2024 margin
- Strong R (+27.4) · D 35.7% · R 63.1% · Other 1.2%
- 2008→2024 swing
- -7.9pp toward R · 2008: -19.5pp · 2024: -27.4pp
- All cycles
- 2024: R+27.4 2020: R+22.6 2016: R+22.6 2012: R+26.9 2008: R+19.5
Not yet ingested
- Civics
- —
Market trends
- HPI YoY
- ▼ -69.39%
- Current HPI
- 236.0239
- Rent YoY
- ▲ 3.95%
- Metro
- Houston-The Woodlands-Sugar Land, TX
- State GDP YoY
- ▲ 3.95%
- F500 in state
- 110
Industry mix (Fortune 500 HQ in TX)
| Industry | F500 HQs | Revenue |
|---|---|---|
| Energy | 16 | $1,198B |
|
||
| Technology | 5 | $198B |
|
||
| Engineering / Construction | 4 | $72B |
|
||
| Energy Services | 3 | $60B |
|
||
| Utilities | 3 | $41B |
|
||
| Healthcare | 2 | $330B |
|
||
Price history
+0.0% since first listed5 events — show timeline
- 2026-05-23 Price Changed $284,900 Zillow
- 2026-05-23 Price Changed $284,900 HARMLS
- 2026-05-18 Listed $284,800 HARMLS
- 2026-05-12 Price Changed $284,800 Zillow
- 2026-04-29 Listed $284,900 Zillow
Property tax history
-0.9%/yrLatest (2025): $1,058 · -0.9% YoY. Source: county tax records.
Cash-flow waterfall
monthlySold comps — $/sqft
last 12 mo · ≤1 miLoading sold comps…