5805 18th St W · Bayshore Gardens, FL
Flood risk 4/10 · Minor
- FEMA flood zone
- X (unshaded)
- Chance of flooding over 30 yrs
- 0.2%
- Est. flood insurance / yr
- $507 – $1,088
Fire risk 1/10 · Minimal
- Est. fire insurance / yr
- $947 – $1,759
Heat risk 10/10 · Severe
- Hot days now (above 106°F)
- 7 days/yr
- Hot days in 30 yrs
- 30 days/yr
Wind risk 10/10 · Severe
- Chance of severe wind over 30 yrs
- 99.0%
Air-quality risk 2/10 · Minimal
- Unhealthy air days now
- 1 days/yr
- Unhealthy air days in 30 yrs
- 2 days/yr
Risk factors via First Street. Map © Google.
Why this score? — see what drove the C+ grade
The composite is a weighted blend of 9 inputs, each scored 0–100. Each bar is that input's sub-score; the figure is the points it added to the 100-point composite (weight × sub-score).
- Cash flow +20.9/30.0
- ARV discount +15.0/15.0
- DSCR +6.6/10.0
- 1% rule +5.7/10.0
- Schools +4.4/10.0
- Livability +4.1/5.0
- Condition / age +2.5/5.0
- Rent growth +1.1/5.0
- Appreciation +0.0/10.0
$130,000
🖨 Deal sheet (PDF) 📄 Offer letter ✓ Due diligence
Listing remarks
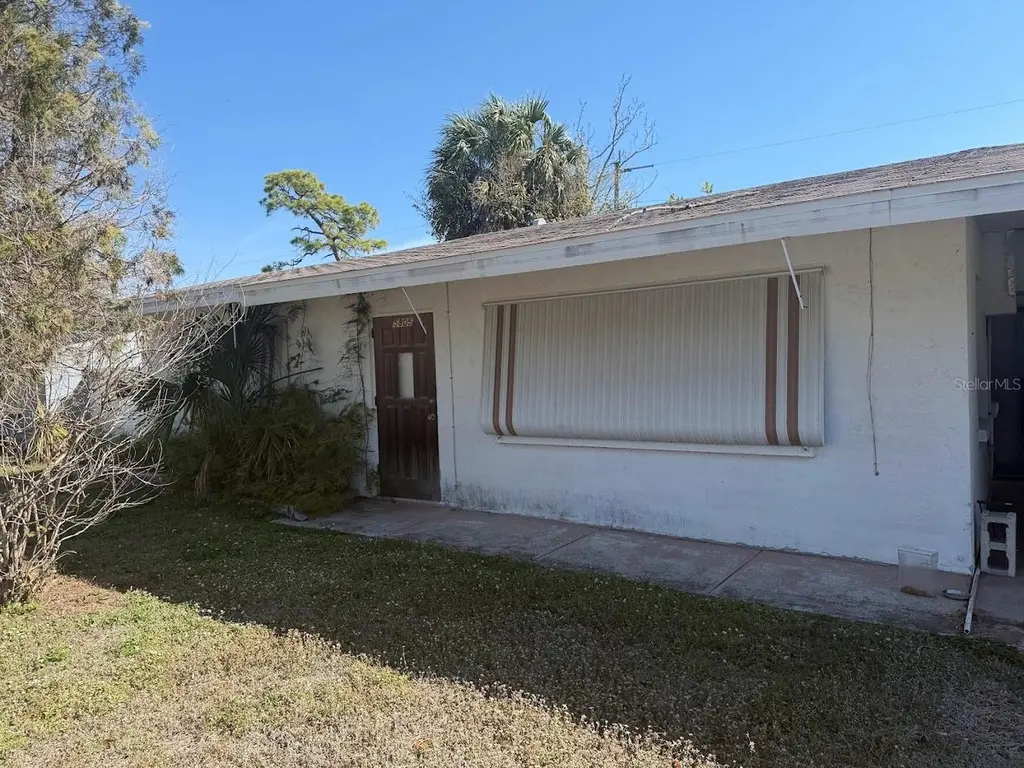
Under contract-accepting backup offers. Block Home in Bradenton — Full Rehab Opportunity Solid block construction 2-bedroom, 1-bath home in west Bradenton, minutes from the Gulf Coast and the amenities of the Sarasota/Bradenton corridor. Full rehab opportunity priced accordingly — the structure is there; the upside is yours. Convenient access to US-41, shopping, and the beach. This one won't last.
Key facts
- Rehab opportunity
- Convenient access
- Block construction
Tags
Property features AI
Finance
- Other: Zoning: RSF6; Property type: Residential, Single Family Residence; Universal property ID recorded; Living area recorded as 925 (public records); Total rooms: 3; Unfurnished; Property listed by third party; Direction faces: West
- Financial info: Homestead exempt; Lease restrictions: none
- HOA & community: No association fees; no HOA; No association approval required
Exterior
- Parking: Has carport (1 space)
- Utilities: Public water; Public sewer; Public utilities
- Home design: Single-family residence; One story; West-facing; Fixer condition
- Construction: Block, concrete and stucco construction; Shingle roof; Slab foundation; Built on a 0.18-acre lot (approx. 70 x 115)
- Exterior features: Covered patio/porch; Other exterior features; Concrete and paved road access
Interior
- Kitchen: Other kitchen appliances
- Bedrooms: 2 bedrooms
- Flooring: Other flooring
- Bathrooms: 1 full bathroom
- Heating & cooling: Central heating; Central air conditioning
- Interior features: No notable interior features listed; Other interior finishes
- Laundry & utility: Laundry: other setup
Neighborhood map
What this means for you Summary
Snapshot
- This is a 2-bed/1.0-bath single-family listed at $130k.
Deal economics
- At list price, monthly cash flow is $180 ($2k/yr) — positive.
- The deal already cash-flows at list — no discount required.
- Meets the 1% rule at list price ($1k rent vs $130k).
- Cap rate 8.0% vs local median 4.7% in Bayshore Gardens — top-decile yield for the area; either an underpriced asset or a hidden risk that comps aren't pricing in. Stress-test before assuming the spread holds.
Location & tenants
- Location reads 82/100 on livability (#72 in FL, #1,180 nationally) — a professional / high-income tenant draw. Strengths: cost of living A+, housing A+, health & safety A+; Watch: crime C-, commute C-, schools F.
- Manatee (suburban): math 54% / reading 50% proficiency, ranked #26 of 73 in FL (top 36%) — acceptable for families but not a draw, mixed tenant base, ~2y average lease.
- Market conditions: Rents falling (-5.5%/yr); 361 active listings in the ZIP; 40 comparable units currently listed for rent nearby; rentals at typical pace (median 17d on market — plan ~3-4 weeks tenant-placement turnaround); 7,472 units permitted in Manatee County in 2024 (1,782 in 5+ unit buildings).
- This rent runs 37% of the median local income ($45k/yr) — at the standard rent-burdened threshold; future hikes will face affordability resistance.
Forward outlook
- Local home prices are declining (-3.0%/yr); year-one equity from $899 of loan paydown is wiped out by about $4k of value loss. Plan a longer hold.
- Manatee County population projected at +43% by 2050 — long-run rental-demand tailwind backs the buy-and-hold thesis.
Negotiation context
- Only 2 days on market — expect competitive offers; lowballing is unlikely to land.
- Current owner paid $79k; list at $130k implies a 65% gain — meaningful room to come down on a strong offer.
Risks & watch-outs
- Watch-outs: built in 1958 — expect roof / HVAC / electrical / plumbing capex.
- Climate carrying-cost: severe wind risk, 99% chance of damaging wind over 30y; extreme-heat days projected 7→30/yr by 2055 (HVAC capex compounding) — expect insurance premiums to compound above CPI over the hold.
Questions for the listing agent
- Built in 1958 — when were the roof, HVAC, electrical panel, plumbing, and water heater last replaced?
- Is there a deadline driving the sale (1031 exchange, divorce, estate, relocation)? That informs how much negotiation room exists.
- Schools are F-rated, which usually means shorter tenancies and higher turnover. Who's the typical renter profile here, and what's been the actual vacancy rate?
- What's the average days-on-market for RENTAL listings here right now (not sales)? A rising rental-DOM trend means longer vacancies and softer asking-rent achievability than the comps imply.
- What's the recent tenant-quality profile in this submarket — average credit score on applications, eviction rate, late-payment / NSF rate, and stable-employment percentage? A property-management company in the area should have these aggregated.
- How much new for-sale + rental construction is in the pipeline within 1–3 miles? Heavy new supply typically softens prices + rents 12–24 months out; constrained supply supports both.
Investment metrics
- 1% rule
- 1.07% ✓
- Cap rate
- 7.95%
- Cash-on-cash
- 5.94%
- DSCR
- 1.26
- GRM
- 7.8
CMA / ARV
- ARV (on-the-fly)
- $248,825
- Comps found
- 12
Show comp detail 12 sales within ~0.75 mi
| Address | Dist | Beds/Ba | Sqft | Sold | Price | $/sf | Match |
|---|---|---|---|---|---|---|---|
| 6068 Arlene Way | 0.43mi | 2/2.0 | 930 (+0%) | 3mo | $139,500 | $150 | 73 |
| 5807 16th St W | 0.11mi | 2/2.0 | 1,024 (+11%) | 1mo | $190,000 | $186 | 72 |
| 5828 20th St W | 0.17mi | 2/2.0 | 1,024 (+11%) | 4mo | $275,000 | $269 | 66 |
| 5828 22nd St W | 0.26mi | 2/1.5 | 812 (-12%) | 1mo | $186,500 | $230 | 65 |
| 6041 Lilli Way #72 | 0.38mi | 2/1.0 | 820 (-11%) | 3mo | $121,000 | $148 | 61 |
| 5987 Coral Way | 0.47mi | 2/2.0 | 1,005 (+9%) | 1mo | $123,000 | $122 | 59 |
| 5981 Hibiscus Dr | 0.60mi | 2/1.0 | 985 (+6%) | 4mo | $118,000 | $120 | 58 |
| 1712 63rd Ave W | 0.67mi | 2/2.0 | 988 (+7%) | 4mo | $299,900 | $304 | 50 |
| 2112 Hopkins Dr W | 0.51mi | 3/1.5 (+1) | 1,032 (+12%) | 2mo | $325,000 | $315 | 49 |
| 1804 Bayshore Gardens Pkwy | 0.52mi | 3/1.0 (+1) | 1,039 (+12%) | 6mo | $299,800 | $289 | 45 |
| 1811 Marilyn Ave | 0.57mi | 3/2.0 (+1) | 1,052 (+14%) | 2mo | $355,000 | $337 | 40 |
| 2118 53rd Ave W | 0.64mi | 3/1.0 (+1) | 1,060 (+15%) | 2mo | $335,000 | $316 | 39 |
Match score weights: distance 35% · size 25% · config 20% · recency 20%. Top-matched comps best support the ARV.
Projected returns pro-forma
-3.0% appreciation · 0.0% rent growth · sell at horizon
- IRR
- -10.6%
- Equity multiple
- 0.63×
- Total profit
- $-13,639
- Equity at exit
- $19,383
- IRR
- -6.3%
- Equity multiple
- 0.65×
- Total profit
- $-12,718
- Equity at exit
- $11,240
Cash invested: $36,400 (down + closing). Projections, not guarantees.
Landlord ↔ Tenant lean methodology
- Overall (STATE)
- 87 Strongly Landlord-Friendly
- State Florida
- 87 Strongly Landlord-Friendly · R+3
- County
- — inherits STATE
- City
- — inherits STATE
ZIP-level market 34207
- Rents YoY
- -5.5%
- Active inventory
- 361
- Price-to-rent
- 7.8×
Monthly cashflow live
- Estimated rent
- $1,390 high interval (Pro) →
- Mortgage (P&I)
- −$682
- Tax from tax record
- −$182 /mo · $2,186/yr
- Insurance
- −$54
- HOA
- −$0
- Vacancy / Maint / Mgmt
- −$292
- Net cashflow
- $180
Break-even live
Sensitivity live
| Price | -10% $254 | -5% $217 | +0% $180 | +5% $143 | +10% $106 |
|---|---|---|---|---|---|
| Rent | -10% $70 | -5% $125 | +0% $180 | +5% $235 | +10% $290 |
| Rate | -1.0pp $246 | -0.5pp $213 | base $180 | +0.5pp $146 | +1.0pp $112 |
UW: 25.0% down · 7.5% · 30yr · 1.5% tax · 5.0% vac · 8.0% maint · 8.0% mgmt
Financing live
Cash to close
- Down payment
- $32,500
- Closing costs
- $3,900
- Reserves months
- —
- Total cash needed
- —
Loan-product check · same deal, 3 products live
Conventional
25% down · 7.5% · 30yr
- Down + closing
- —
- Monthly P&I
- —
- Monthly cashflow
- —
- DSCR
- —
- Eligible?
- —
Personal DTI + credit; lowest rate.
DSCR
20% down · 8.5% · 30yr
- Down + closing
- —
- Monthly P&I
- —
- Monthly cashflow
- —
- DSCR
- —
- Eligible?
- —
No personal income docs; deal must DSCR.
Hard money
10% down · 12.0% · 12mo
- Down + closing
- —
- Monthly P&I
- —
- Monthly cashflow
- —
- DSCR
- —
- Eligible?
- —
Short-term bridge; refi at stabilization.
Rent comps 40 comps
| Address | Beds | Baths | Sqft | Rent | $/sqft | DOM | Units | Dist |
|---|---|---|---|---|---|---|---|---|
| 1807 Restful Dr Unit N4 Bradenton, FL | 2.0 | 1.0 | 733 | $1,150 | $1.57 | 4d | 1 | 0.17mi |
| 1859 Restful Dr Unit L26 Bradenton, FL | 1.0 | 1.0 | 576 | $1,150 | $2.00 | 24d | 1 | 0.18mi |
| 1875 Sunny Dr Unit G32 Bradenton, FL | 1.0 | 1.0 | 576 | $1,100 | $1.91 | 24d | 1 | 0.18mi |
| 5908 17th St W Unit C36 Bradenton, FL | 1.0 | 1.0 | 576 | $950 | $1.65 | 17d | 1 | 0.18mi |
| 1874 Sunny Dr Unit F32 Bradenton, FL | 2.0 | 1.0 | 744 | $950 | $1.28 | 24d | 1 | 0.19mi |
| 5858 Welcome Rd Unit J23 Bradenton, FL | 2.0 | 1.0 | 744 | $1,150 | $1.55 | 4d | 1 | 0.21mi |
| 5888 17th St W Unit C23 Bradenton, FL | 1.0 | 1.0 | 576 | $1,100 | $1.91 | 24d | 1 | 0.21mi |
| 5820 21st St W Bradenton, FL | 3.0 | 2.0 | 1116 | $1,995 | $1.79 | 4d | 1 | 0.21mi |
| 5513 18th St W Bradenton, FL | 2.0 | 1.0 | 1000 | $1,499 | $1.50 | 24d | 1 | 0.24mi |
| 5955 Palm Ln Unit A33 Bradenton, FL | 2.0 | 1.0 | 744 | $1,150 | $1.55 | 15d | 1 | 0.25mi |
| 5896 Palm Ln Unit C27 Bradenton, FL | 2.0 | 2.0 | 966 | $1,400 | $1.45 | 24d | 1 | 0.25mi |
| 1825 Flamingo Blvd Unit O26 Bradenton, FL | 1.0 | 1.0 | 576 | $1,000 | $1.74 | 24d | 1 | 0.25mi |
| 1839 Sunny Dr Unit E36 Bradenton, FL | 1.0 | 1.0 | 576 | $1,350 | $2.34 | 24d | 1 | 0.25mi |
| 2028 Canal Dr Unit M26 Bradenton, FL | 1.0 | 1.0 | 576 | $1,050 | $1.82 | 11d | 1 | 0.26mi |
| 1566 Pleasant Rd Unit J24 Bradenton, FL | 2.0 | 1.0 | 733 | $1,150 | $1.57 | 24d | 1 | 0.27mi |
| 5531 16th St W Unit 5537 Bradenton, FL | 2.0 | 1.0 | 750 | $1,650 | $2.20 | 4d | 1 | 0.29mi |
| 5906 Garden Ln Unit A22 Bradenton, FL | 2.0 | 2.0 | 840 | $1,200 | $1.43 | 4d | 1 | 0.34mi |
| 2547 60th Ave W Unit L-36 Bradenton, FL | 1.0 | 1.0 | 576 | $1,100 | $1.91 | 17d | 1 | 0.39mi |
| 2423 60th Ave W Unit K29 Bradenton, FL | 2.0 | 2.0 | 1026 | $1,495 | $1.46 | 24d | 1 | 0.39mi |
| 6043 Coral Way Bradenton, FL | 2.0 | 1.0 | 865 | $1,700 | $1.97 | 17d | 1 | 0.46mi |
| 1007 57th Ave W Bradenton, FL | 2.0 | 1.5 | 967 | $1,495 | $1.55 | 11d | 1 | 0.47mi |
| 5996 Hibiscus Dr #6 Bradenton, FL | 2.0 | 1.0 | 865 | $1,550 | $1.79 | 17d | 1 | 0.58mi |
| 2713 60th Avenue Dr W Bradenton, FL | 2.0 | 2.0 | 1076 | $2,000 | $1.86 | 24d | 1 | 0.66mi |
| 5502 8th Street Ct W Bradenton, FL | 2.0 | 2.0 | 896 | $1,595 | $1.78 | 24d | 1 | 0.70mi |
| 5580 Fountain Lake Cir Bradenton, FL | 1.0–3.0 | 1.0–2.0 | 1052 | $1,908 | $1.81 | 3d | 38 | 0.71mi |
| 5310 26th St W Bradenton, FL | 1.0–2.0 | 1.0 | 789 | $1,450 | $1.84 | 12d | 5 | 0.73mi |
| 5310 26th St W Bradenton, FL | 1.0–2.0 | 1.0 | 789 | $1,550 | $1.96 | 20d | 5 | 0.73mi |
| 5310 26th St W Bradenton, FL | 1.0–2.0 | 1.0 | 789 | $1,450 | $1.84 | 4d | 4 | 0.73mi |
| 5400 26th St W Bradenton, FL | 1.0–2.0 | 1.0–2.0 | 902 | $1,651 | $1.83 | 24d | 1 | 0.76mi |
| 1009 W 63rd AVE Bradenton, FL | 2.0 | 2.0 | 815 | $1,495 | $1.83 | 17d | 1 | 0.76mi |
| 512 60th Avenue Ter W Unit 512 Bradenton, FL | 3.0 | 1.5 | 972 | $1,900 | $1.95 | 11d | 1 | 0.88mi |
| 2803 52nd Avenue Dr W Unit 2803 Bradenton, FL | 2.0 | 1.0 | 750 | $1,599 | $2.13 | 24d | 1 | 0.93mi |
| 6033 34th St W Bradenton, FL | 2.0 | 2.0 | 942 | $1,550 | $1.64 | 4d | 3 | 1.00mi |
| 6033 34th St W Bradenton, FL | 2.0 | 2.0 | 996 | $1,500 | $1.51 | 24d | 2 | 1.00mi |
| 6033 34th St W Bradenton, FL | 2.0 | 2.0 | 942 | $1,625 | $1.73 | 3d | 2 | 1.00mi |
| 5001 22nd St W Unit B Bradenton, FL | 2.0 | 1.0 | 729 | $1,700 | $2.33 | 17d | 1 | 1.02mi |
| 605 64th Ave W Bradenton, FL | 2.0 | 1.0 | 784 | $1,250 | $1.59 | 12d | 1 | 1.04mi |
| 3851 59th Ave W Unit 3851 Bradenton, FL | 2.0 | 2.0 | 912 | $1,500 | $1.64 | 24d | 1 | 1.04mi |
| 3843 59th Ave W Bradenton, FL | 2.0 | 2.0 | 912 | $1,200 | $1.32 | 24d | 1 | 1.05mi |
| 3848 59th Ave W Bradenton, FL | 2.0 | 2.0 | 912 | $1,395 | $1.53 | 24d | 1 | 1.05mi |
Listing history 2 events
-
2026-06-07remarks 403-char remark
-
2026-06-07$130,000 Pending 2 DOM
ⓘ Source: listings_history table (triggers on properties + properties_extension) + one-shot
backfill from property_details.listing_events for pre-trigger history.
Tax reassessment forecast FL · Resets to sale price
- Current annual tax
- $2,186 · $182/mo
- Projected year-2 tax
- $2,186 · $182/mo
- Expected delta
- $0/yr ($0/mo · 0.0%)
ⓘ Screening estimate from a state-policy table — verify with the county assessor before closing.
Climate risk First Street
- Flood 4/10 Moderate FEMA zone X (unshaded) · 20% chance over 30 yrs
- Wildfire 1/10 Low
- Heat 10/10 Extreme 7 d/yr ≥106°F today · 30 d/yr by 30 yrs out
- Wind 10/10 Extreme 99% chance of damaging wind over 30 yrs
- Air quality 2/10 Low 1 unhealthy d/yr today · 2 by 30 yrs out
Nearby sold comps map
Loading sold comps map…
Walkable amenities ~0.75 mi
Loading nearby amenities…
Taxation est. · year 1
- Rental income
- $16,680
- − Mortgage interest
- −$7,282
- − Property taxes
- −$2,186
- − Insurance
- −$650
- − Repairs & maintenance
- −$1,334
- − Management
- −$1,334
- − Depreciation
- −$3,782
- Taxable income
- $112
- Est. tax owed @ 24.0%
- −$27
- After-tax cash flow
- $2,134/yr
For passive investors: Depreciation is non-cash, so a rental often shows a tax loss while cash-flowing — sheltering income. Rental losses are passive: they offset passive income freely, and up to $25,000/yr can offset ordinary (W-2) income if you actively participate and your MAGI is under $100k (phasing out to $0 by $150k); unused losses carry forward. On sale, claimed depreciation is recaptured at up to 25%, and gains may owe capital-gains tax (a 1031 exchange can defer both). Figures are a year-1 estimate at your 24.0% rate — not tax advice; consult a CPA.
Schools (NCES district)
- District
- Manatee
- NCES district ID
- 1201230
- Math proficiency
- 54% ▼ -6.00%
- Reading proficiency
- 50% ▼ -2.00%
- Median HH income
- $49,607
- Composite
- 44.43/100
- National rank
- #2806
- State rank
- #26 of 73 in FL
Livability — Bayshore Gardens
- Score
- 82/100
- State rank
- #72
- US rank
- #1180
Category grades
Schools grade is shown separately in the Schools card above.
Census & demographics
- Census place
- Bayshore Gardens, FL
- County
- Manatee County · 416,364 people
- City population
- 33,840
- Metro
- North Port-Sarasota-Bradenton, FL
- Population (ZIP)
- 34,081
- Household income
- $45,010
- Rent vs Own
- Severe rent burden
- 1474.0
Population outlook (Manatee County) Hauer SSP2
- Today (2025)
- 447,342 people
- By 2030
- 488,911 · +9.3%
- By 2040
- 567,934 · +27.0%
- By 2050
- 637,995 · +42.6%
- By 2075
- 781,970 · +74.8%
- By 2100
- 848,272 · +89.6%
Race, ethnicity, and origin ACS 2023
- Neighborhood character
- Diverse neighborhood (Simpson 0.57)
- Race & ethnicity
- White 58% Hispanic / Latino 29% Two or more races 13% Black 7%
- Hispanic origin (detail)
- Mexican 12% Puerto Rican 4% Cuban 3% Dominican 1%
- Common ancestry
- Lithuanian 3% Romanian 2% Slovak 2%
- Foreign-born
- 16% · Canada, Jamaica
- Languages at home
- 74% English-only · Spanish 22% Other Indo-European 1% French/Haitian/Cajun 1%
Political lean MEDSL · Manatee
- 2024 margin
- Strong R (+23.5) · D 37.9% · R 61.4%
- 2008→2024 swing
- -16.5pp toward R · 2008: -7.0pp · 2024: -23.5pp
- All cycles
- 2024: R+23.5 2020: R+16.1 2016: R+17.1 2012: R+12.5 2008: R+7.0
Not yet ingested
- Civics
- —
Market trends
- HPI YoY
- ▼ -305.32%
- Current HPI
- 369.9899
- Rent YoY
- ▼ -5.50%
- Metro
- North Port-Sarasota-Bradenton, FL
- State GDP YoY
- ▲ 3.28%
- F500 in state
- 36
Industry mix (Fortune 500 HQ in FL)
| Industry | F500 HQs | Revenue |
|---|---|---|
| Industrial Technology | 2 | $29B |
|
||
| Insurance | 2 | $17B |
|
||
| Retail | 1 | $60B |
|
||
| Technology Distribution | 1 | $58B |
|
||
| Homebuilding | 1 | $35B |
|
||
| Technology Manufacturing | 1 | $35B |
|
||
Price history
+217.1% since first listed4 events — show timeline
- 2026-06-07 Pending — Stellar MLS as Distributed by MLS Grid
- 2026-06-05 Listed $130,000 Stellar MLS as Distributed by MLS Grid
- 2001-03-28 Sold (Public Records) $78,800 Public Records
- 1981-04-01 Sold (Public Records) $41,000 Public Records
Property tax history
+12.0%/yrLatest (2025): $2,186 · +216.1% YoY. Source: county tax records.
Cash-flow waterfall
monthlySold comps — $/sqft
last 12 mo · ≤1 miLoading sold comps…