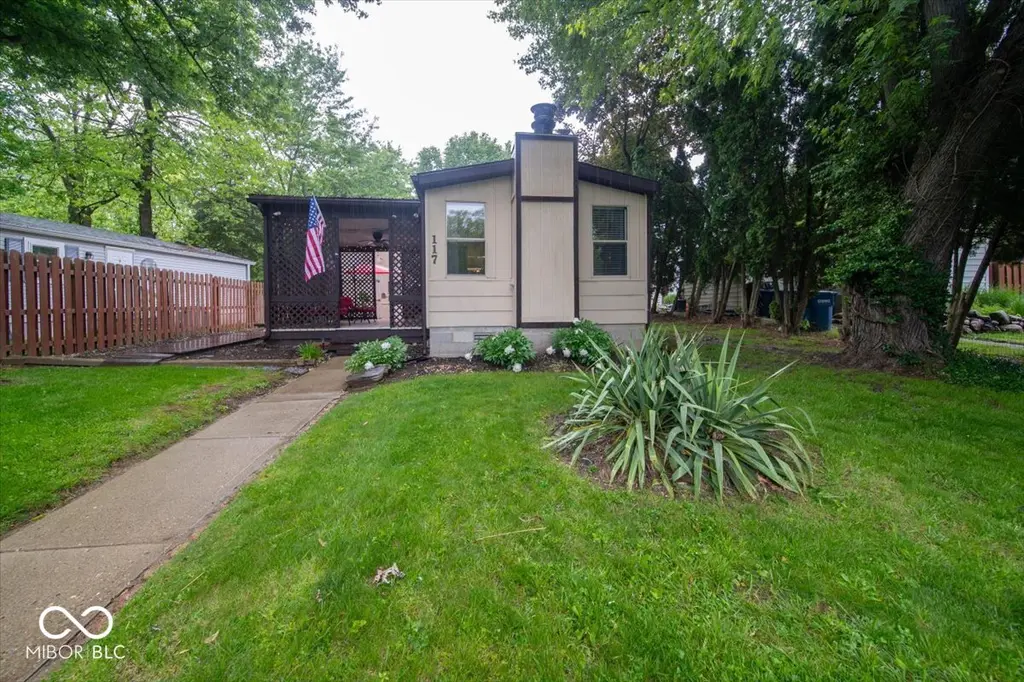
117 Cottonwood Dr · Cicero, IN
Flood risk 1/10 · Minimal
- FEMA flood zone
- X (unshaded)
- Chance of flooding over 30 yrs
- 0.0%
- Est. flood insurance / yr
- $507 – $1,088
Fire risk 1/10 · Minimal
- Est. fire insurance / yr
- $717 – $1,331
Heat risk 3/10 · Minor
- Hot days now (above 101°F)
- 7 days/yr
- Hot days in 30 yrs
- 18 days/yr
Wind risk 2/10 · Minimal
- Chance of severe wind over 30 yrs
- 0.0%
Air-quality risk 4/10 · Minor
- Unhealthy air days now
- 4 days/yr
- Unhealthy air days in 30 yrs
- 6 days/yr
Risk factors via First Street. Map © Google.
Why this score? — see what drove the C grade
The composite is a weighted blend of 9 inputs, each scored 0–100. Each bar is that input's sub-score; the figure is the points it added to the 100-point composite (weight × sub-score).
- Cash flow +28.1/30.0
- DSCR +10.0/10.0
- 1% rule +6.6/10.0
- Livability +3.4/5.0
- Schools +3.3/10.0
- Rent growth +2.5/5.0
- Condition / age +2.5/5.0
- ARV discount +0.0/15.0
- Appreciation +0.0/10.0
$149,900
🖨 Deal sheet (PDF) 📄 Offer letter ✓ Due diligence
Listing remarks MLS
IMMACULATE 2 BR MANUFACTURED HM ON BEAUTIFUL WDED LOT ON QUIET CUL-DE-SAC. LG COV POR W/WOOD DECK & HUGE STOR SHED,CATH CLG & COZY FRPLC IN GR,MANY CAB IN CHERRY KIT,GARDEN TUB & SEP SHWR IN BA.NEWER ROOF,A/C,FURNACE.NI CE CARPETS,FNCD YD INCL:BLUE SPRUCE,MATURE TREES,OVER 20 MUMS & ROSE BUSHES. ENJOY LIVING & VACATIONING ON MORSE LAKE.ALL OFFERS CONSIDERED.HAMILTON HEIGHTS SCHOOL SYSTEM!
Key facts
- Covered deck
- Private yard
- Morse lake reservoir
Tags
Property features AI
Finance
- Other: Property type: Residential; Property subtype: Manufactured Home; Ownership interest: Mandatory fee
- HOA & community: Has HOA with $20 monthly fee; HOA governed by covenants and restrictions
Exterior
- Security: Smoke detector(s)
- Utilities: Public water; Municipal sewer connected; Electricity connected (200+ amp service)
- Home design: Manufactured home; One level; Faces east
- Construction: Block foundation; Other construction materials
- Exterior features: Storage shed; Chain link, partial and privacy fencing; Mature trees
Interior
- Kitchen: Microwave; Refrigerator; Range hood
- Bedrooms: 2 bedrooms on the main level; Primary bedroom with walk-in closet
- Bathrooms: 1 full bathroom with shower stall and tub/shower combination
- Heating & cooling: Electric forced air heat; Central air conditioning; Electric fireplace in living room
- Interior features: Eat-in kitchen; Covered patio
- Laundry & utility: Laundry closet
Neighborhood map
What this means for you Summary
Snapshot
- This is a 3-bed/1.0-bath manufactured listed at $150k.
Deal economics
- At list price, monthly cash flow is $470 ($6k/yr) — positive.
- The deal already cash-flows at list — no discount required.
- Meets the 1% rule at list price ($2k rent vs $150k).
- Recommended offer: $145k (3.0% below list) — sets the bar for market timing.
- Cap rate 10.1% vs local median 2.9% in Cicero — top-decile yield for the area; either an underpriced asset or a hidden risk that comps aren't pricing in. Stress-test before assuming the spread holds.
Location & tenants
- Location reads 67/100 on livability (#242 in IN) — a middle-class / working-renter tenant base. Strengths: crime A+, cost of living A+, housing A+; Watch: amenities F, commute F, health & safety F.
- Hamilton Heights School Corporation (suburban): math 31% / reading 44% proficiency, ranked #154 of 301 in IN (top 51%) — families likely to look elsewhere, expect single-tenant / working-renter base with shorter leases.
- Zoned schools: Hamilton Heights Elementary School (math 40% / reading 39%, grade F, #500 of 994 statewide, top 53%, 901 students, 33% FRL); Hamilton Heights Middle School (math 27% / reading 40%, grade F, #176 of 330 statewide, top 54%, 695 students, 34% FRL); Hamilton Heights High School (math 32% / reading 67%, grade D, #123 of 369 statewide, top 36%, 711 students, 31% FRL).
- Market conditions: 71 active listings in the ZIP; 1 comparable units currently listed for rent nearby; solid renter incomes; 4,661 units permitted in Hamilton County in 2024 (1,528 in 5+ unit buildings).
Forward outlook
- Local home prices are declining (-3.0%/yr); year-one equity from $1k of loan paydown is wiped out by about $4k of value loss. Plan a longer hold.
- Hamilton County population projected at +44% by 2050 — long-run rental-demand tailwind backs the buy-and-hold thesis.
- At projected returns (-3.0% appreciation + 3.0% rent growth), your $42k cash investment doubles in ~9 years — after that, you're playing with house money.
Negotiation context
- It's been on market 34 days — a 3% lower offer ($145k) is reasonable based on typical stale-listing flexibility.
- 2 sale attempts since 25y ago with the ask held roughly flat each time — persistent listings suggest the price (not the market) is what's stuck; bring a comps-based counter.
- Current owner paid $43k; list at $150k implies a 249% gain — meaningful room to come down on a strong offer.
Questions for the listing agent
- It's been on market 34 days. Have you received any prior offers? Is the seller open to a 3% concession, seller financing, or rate buy-down credit?
- Built in 1978 — when were the roof, HVAC, electrical panel, plumbing, and water heater last replaced?
- What does the HOA fee cover, when was the last increase, and are there any pending special assessments or reserve-fund shortfalls?
- Is there a deadline driving the sale (1031 exchange, divorce, estate, relocation)? That informs how much negotiation room exists.
- Schools are D-rated, which usually means shorter tenancies and higher turnover. Who's the typical renter profile here, and what's been the actual vacancy rate?
- What's the average days-on-market for RENTAL listings here right now (not sales)? A rising rental-DOM trend means longer vacancies and softer asking-rent achievability than the comps imply.
- What's the recent tenant-quality profile in this submarket — average credit score on applications, eviction rate, late-payment / NSF rate, and stable-employment percentage? A property-management company in the area should have these aggregated.
- How much new for-sale + rental construction is in the pipeline within 1–3 miles? Heavy new supply typically softens prices + rents 12–24 months out; constrained supply supports both.
Investment metrics
- 1% rule
- 1.16% ✓
- Cap rate
- 10.06%
- Cash-on-cash
- 13.45%
- DSCR
- 1.60
- GRM
- 7.2
CMA / ARV
- ARV (on-the-fly)
- $114,576
- Comps found
- 3
Show comp detail 3 sales within ~0.75 mi
| Address | Dist | Beds/Ba | Sqft | Sold | Price | $/sf | Match |
|---|---|---|---|---|---|---|---|
| 18 Morse Ct | 0.23mi | 3/2.0 | 924 (0%) | 20mo | $115,000 | $124 | 68 |
| 15 Morse Ct | 0.25mi | 2/1.0 (-1) | 840 (-9%) | 2mo | $69,000 | $82 | 66 |
| 71 E Cove Ct | 0.14mi | 2/2.0 (-1) | 1,062 (+15%) | 10mo | $154,900 | $146 | 51 |
Match score weights: distance 35% · size 25% · config 20% · recency 20%. Top-matched comps best support the ARV.
Projected returns pro-forma
-3.0% appreciation · 3.0% rent growth · sell at horizon
- IRR
- 3.5%
- Equity multiple
- 1.13×
- Total profit
- $5,618
- Equity at exit
- $22,351
- IRR
- 13.0%
- Equity multiple
- 2.03×
- Total profit
- $43,250
- Equity at exit
- $12,961
Cash invested: $41,972 (down + closing). Projections, not guarantees.
Landlord ↔ Tenant lean methodology
- Overall (STATE)
- 90 Strongly Landlord-Friendly
- State Indiana
- 90 Strongly Landlord-Friendly · R+11
- County
- — inherits STATE
- City
- — inherits STATE
ZIP-level market 46034
- Active inventory
- 71
- Price-to-rent
- 7.2×
Monthly cashflow live
- Estimated rent
- $1,739 medium interval (Pro) →
- Mortgage (P&I)
- −$786
- Tax from tax record
- −$35 /mo · $417/yr
- Insurance
- −$62
- HOA
- −$20
- Vacancy / Maint / Mgmt
- −$365
- Net cashflow
- $470
Break-even live
Sensitivity live
| Price | -10% $555 | -5% $513 | +0% $470 | +5% $428 | +10% $386 |
|---|---|---|---|---|---|
| Rent | -10% $333 | -5% $402 | +0% $470 | +5% $539 | +10% $608 |
| Rate | -1.0pp $546 | -0.5pp $509 | base $470 | +0.5pp $432 | +1.0pp $392 |
UW: 25.0% down · 7.5% · 30yr · 1.5% tax · 5.0% vac · 8.0% maint · 8.0% mgmt
Financing live
Cash to close
- Down payment
- $37,475
- Closing costs
- $4,497
- Reserves months
- —
- Total cash needed
- —
Loan-product check · same deal, 3 products live
Conventional
25% down · 7.5% · 30yr
- Down + closing
- —
- Monthly P&I
- —
- Monthly cashflow
- —
- DSCR
- —
- Eligible?
- —
Personal DTI + credit; lowest rate.
DSCR
20% down · 8.5% · 30yr
- Down + closing
- —
- Monthly P&I
- —
- Monthly cashflow
- —
- DSCR
- —
- Eligible?
- —
No personal income docs; deal must DSCR.
Hard money
10% down · 12.0% · 12mo
- Down + closing
- —
- Monthly P&I
- —
- Monthly cashflow
- —
- DSCR
- —
- Eligible?
- —
Short-term bridge; refi at stabilization.
Rent comps 1 comps
| Address | Beds | Baths | Sqft | Rent | $/sqft | DOM | Units | Dist |
|---|---|---|---|---|---|---|---|---|
| 679 Main St Unit C Cicero, IN | 2.0 | 1.0 | 860 | $1,215 | $1.41 | 0d | 1 | 0.92mi |
HOA detail
- Monthly dues
- $20 · $240/yr
Listing history 18 events
-
2026-06-21days on market $149,900 Active 34 DOM
-
2026-06-18days on market $149,900 Active 31 DOM
-
2026-06-17days on market $149,900 Active 30 DOM
-
2026-06-16days on market $149,900 Active 29 DOM
-
2026-06-15days on market $149,900 Active 28 DOM
-
2026-06-13days on market $149,900 Active 26 DOM
-
2026-06-13days on market $149,900 Active 25 DOM
-
2026-06-09days on market $149,900 Active 22 DOM
-
2026-06-08days on market $149,900 Active 21 DOM
-
2026-06-07days on market $149,900 Active 20 DOM
-
2026-06-05days on market $149,900 Active 17 DOM
-
2026-06-03days on market $149,900 Active 16 DOM
-
2026-06-02days on market $149,900 Active 15 DOM
-
2026-06-01days on market $149,900 Active 14 DOM
-
2026-05-31days on market $149,900 Active 13 DOM
-
2026-05-18$149,900 Active
-
2001-06-22soldstatus $42,900 411-char remark
Show marketing remark (411 chars)
IMMACULATE 2 BR MANUFACTURED HM ON BEAUTIFUL WDED LOT ON QUIET CUL-DE-SAC. LG COV POR W/WOOD DECK & HUGE STOR SHED,CATH CLG & COZY FRPLC IN GR,MANY CAB IN CHERRY KIT,GARDEN TUB & SEP SHWR IN BA.NEWER ROOF,A/C,FURNACE.NI CE CARPETS,FNCD YD INCL:BLUE SPRUCE,MATURE TREES,OVER 20 MUMS & ROSE BUSHES. ENJOY LIVING & VACATIONING ON MORSE LAKE.ALL OFFERS CONSIDERED.HAMILTON HEIGHTS SCHOOL SYSTEM!
-
2001-03-09$44,200 411-char remark
Show marketing remark (411 chars)
IMMACULATE 2 BR MANUFACTURED HM ON BEAUTIFUL WDED LOT ON QUIET CUL-DE-SAC. LG COV POR W/WOOD DECK & HUGE STOR SHED,CATH CLG & COZY FRPLC IN GR,MANY CAB IN CHERRY KIT,GARDEN TUB & SEP SHWR IN BA.NEWER ROOF,A/C,FURNACE.NI CE CARPETS,FNCD YD INCL:BLUE SPRUCE,MATURE TREES,OVER 20 MUMS & ROSE BUSHES. ENJOY LIVING & VACATIONING ON MORSE LAKE.ALL OFFERS CONSIDERED.HAMILTON HEIGHTS SCHOOL SYSTEM!
ⓘ Source: listings_history table (triggers on properties + properties_extension) + one-shot
backfill from property_details.listing_events for pre-trigger history.
Tax reassessment forecast IN · Partial reset (capped growth)
- Current annual tax
- $417 · $35/mo
- Projected year-2 tax
- $846 · $70/mo
- Expected delta
- +$429/yr (+$36/mo · 102.7%)
ⓘ Screening estimate from a state-policy table — verify with the county assessor before closing.
Climate risk First Street
- Flood 1/10 Low FEMA zone X (unshaded) · 0% chance over 30 yrs
- Wildfire 1/10 Low
- Heat 3/10 Moderate 7 d/yr ≥101°F today · 18 d/yr by 30 yrs out
- Wind 2/10 Low 0% chance of damaging wind over 30 yrs
- Air quality 4/10 Moderate 4 unhealthy d/yr today · 6 by 30 yrs out
Nearby sold comps map
Loading sold comps map…
Walkable amenities ~0.75 mi
Loading nearby amenities…
Taxation est. · year 1
- Rental income
- $20,867
- − Mortgage interest
- −$8,397
- − Property taxes
- −$417
- − Insurance
- −$750
- − Repairs & maintenance
- −$1,669
- − Management
- −$1,669
- − HOA
- −$240
- − Depreciation
- −$4,361
- Taxable income
- $3,364
- Est. tax owed @ 24.0%
- −$807
- After-tax cash flow
- $4,838/yr
For passive investors: Depreciation is non-cash, so a rental often shows a tax loss while cash-flowing — sheltering income. Rental losses are passive: they offset passive income freely, and up to $25,000/yr can offset ordinary (W-2) income if you actively participate and your MAGI is under $100k (phasing out to $0 by $150k); unused losses carry forward. On sale, claimed depreciation is recaptured at up to 25%, and gains may owe capital-gains tax (a 1031 exchange can defer both). Figures are a year-1 estimate at your 24.0% rate — not tax advice; consult a CPA.
Schools (NCES district)
- District
- Hamilton Heights School Corporation
- NCES district ID
- 1804260
- Math proficiency
- 31% ▼ -15.00%
- Reading proficiency
- 44% ▼ -10.00%
- Median HH income
- $60,360
- Composite
- 33.37/100
- National rank
- #5481
- State rank
- #154 of 301 in IN
Livability — Cicero
- Score
- 67/100
- State rank
- #242
- US rank
- #10345
Category grades
Schools grade is shown separately in the Schools card above.
Census & demographics
- Census place
- Cicero, IN
- County
- Hamilton County · 337,479 people
- City population
- 7,531
- Metro
- Indianapolis-Carmel-Anderson, IN
- Population (ZIP)
- 7,531
- Household income
- $91,466
- Rent vs Own
- Severe rent burden
- 188.0
Population outlook (Hamilton County) Hauer SSP2
- Today (2025)
- 381,938 people
- By 2030
- 417,496 · +9.3%
- By 2040
- 486,684 · +27.4%
- By 2050
- 549,805 · +44.0%
- By 2075
- 687,078 · +79.9%
- By 2100
- 754,495 · +97.5%
Race, ethnicity, and origin ACS 2023
- Neighborhood character
- Predominantly White (96%)
- Race & ethnicity
- White 96% Two or more races 2%
- Common ancestry
- Slovak 3% Iranian 3% Romanian 2%
- Foreign-born
- 1% · Canada, Vietnam
- Languages at home
- 98% English-only · Spanish 1%
Political lean MEDSL · Hamilton
- 2024 margin
- Lean R (+6.1) · D 46.0% · R 52.1% · Other 1.9%
- 2008→2024 swing
- +16.2pp toward D · 2008: -22.2pp · 2024: -6.1pp
- All cycles
- 2024: R+6.1 2020: R+6.8 2016: R+19.6 2012: R+34.3 2008: R+22.2
Not yet ingested
- Civics
- —
Market trends
- HPI YoY
- ▼ -150.85%
- Current HPI
- 243.572
- Rent YoY
- —
- Metro
- Indianapolis-Carmel-Anderson, IN
- State GDP YoY
- ▲ 2.90%
- F500 in state
- 18
Industry mix (Fortune 500 HQ in IN)
| Industry | F500 HQs | Revenue |
|---|---|---|
| Industrial Machinery | 2 | $37B |
|
||
| Healthcare | 1 | $177B |
|
||
| Pharmaceuticals | 1 | $45B |
|
||
| Metals / Steel | 1 | $18B |
|
||
| Agriculture | 1 | $17B |
|
||
| Packaging | 1 | $12B |
|
||
Price history
+239.1% since first listed3 events — show timeline
- 2026-05-18 Listed $149,900 MIBOR as Distributed by MLS Grid
- 2001-06-22 Sold (MLS) $42,900 MIBOR as Distributed by MLS Grid
- 2001-03-09 Listed $44,200 MIBOR as Distributed by MLS Grid
Property tax history
-2.5%/yrLatest (2025): $417 · -13.9% YoY. Source: county tax records.
Cash-flow waterfall
monthlySold comps — $/sqft
last 12 mo · ≤1 miLoading sold comps…