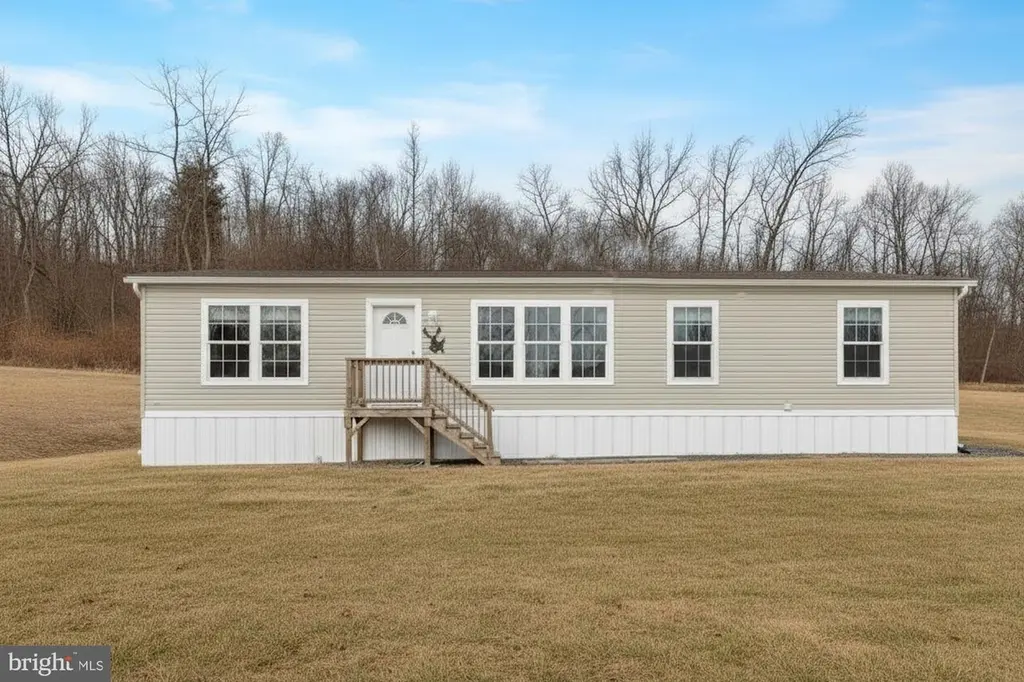
232 Hilltop Rd · York Springs, PA
Flood risk 1/10 · Minimal
- FEMA flood zone
- X (unshaded)
- Chance of flooding over 30 yrs
- 0.0%
- Est. flood insurance / yr
- $507 – $1,088
Fire risk 3/10 · Minor
- Est. fire insurance / yr
- $511 – $949
Heat risk 3/10 · Minor
- Hot days now (above 101°F)
- 6 days/yr
- Hot days in 30 yrs
- 12 days/yr
Wind risk 2/10 · Minimal
- Chance of severe wind over 30 yrs
- 4.0%
Air-quality risk 3/10 · Minor
- Unhealthy air days now
- 1 days/yr
- Unhealthy air days in 30 yrs
- 4 days/yr
Risk factors via First Street. Map © Google.
Why this score? — see what drove the D+ grade
The composite is a weighted blend of 9 inputs, each scored 0–100. Each bar is that input's sub-score; the figure is the points it added to the 100-point composite (weight × sub-score).
- Cash flow +17.8/30.0
- ARV discount +7.5/15.0
- DSCR +5.6/10.0
- 1% rule +4.8/10.0
- Schools +4.0/10.0
- Livability +3.7/5.0
- Rent growth +2.5/5.0
- Condition / age +2.5/5.0
- Appreciation +0.0/10.0
$110,000
🖨 Deal sheet (PDF) 📄 Offer letter ✓ Due diligence
Listing remarks MLS
NOTE: This sale is for the modular/manufactured home only! NO REAL ESTATE IS INVOLVED. Buyer is responsible for relocating the home to a location of their choice. Estimate to remove home is $15,000. 2023 Champion Catena II. Structure is 28x64. Very nice 4 bedroom 2 bathroom home with upgrades. This is not your standard manufactured home, with over 1700 sq. ft. and too many upgrades to list. This home is perfect for someone looking to put a quality home on their dream piece of property with a short time frame! Schedule your tour today!
Key facts
- Built 2023
- Listed 120 days
Neighborhood map
What this means for you Summary
Snapshot
- This is a 2-bed/1.0-bath manufactured listed at $110k.
Deal economics
- At list price, monthly cash flow is $92 ($1k/yr) — positive.
- The deal already cash-flows at list — no discount required.
- To meet the 1% rule (rent ≥ 1% of price), the offer needs to be $108k (2.0% below list).
- Recommended offer: $100k (9.0% below list) — sets the bar for market timing.
Location & tenants
- Location reads 74/100 on livability (#513 in PA, #4,725 nationally) — a middle-class / working-renter tenant base. Strengths: crime A+, cost of living A+, housing A+; Watch: employment D+, amenities F, commute F.
- Bermudian Springs SD (rural): math 36% / reading 55% proficiency, ranked #238 of 539 in PA (top 44%) — families likely to look elsewhere, expect single-tenant / working-renter base with shorter leases.
- Zoned schools: Bermudian Springs El Sch (math 36% / reading 50%, grade F, #873 of 1,518 statewide, top 58%, 612 students, 42% FRL); Bermudian Springs Ms (math 24% / reading 49%, grade F, #307 of 512 statewide, top 61%, 548 students, 38% FRL); Bermudian Springs Hs (math 77% / reading 98%, grade A, #6 of 437 statewide, top 1%, 591 students, 29% FRL).
- Market conditions: 12 active listings in the ZIP; 403 units permitted in Adams County in 2024 (0 in 5+ unit buildings).
Forward outlook
- Local home prices are declining (-3.0%/yr); year-one equity from $761 of loan paydown is wiped out by about $3k of value loss. Plan a longer hold.
- Adams County population projected at -10% by 2050 — secular population decline; favor cash flow + early exit over multi-decade hold.
Negotiation context
- It's been on market 120 days — a 9% lower offer ($100k) is reasonable based on typical stale-listing flexibility.
- 6 sale attempts since 12y ago; this cycle's ask has dropped $25k (19%) from the opening price — seller is motivated, your offer sets the floor, not the list.
Questions for the listing agent
- It's been on market 120 days. Have you received any prior offers? Is the seller open to a 9% concession, seller financing, or rate buy-down credit?
- Why hasn't it sold? Are there any deal-killer items the seller is aware of (foundation, flood, title, zoning, code violations)?
- Is there a deadline driving the sale (1031 exchange, divorce, estate, relocation)? That informs how much negotiation room exists.
- Schools are D-rated, which usually means shorter tenancies and higher turnover. Who's the typical renter profile here, and what's been the actual vacancy rate?
- The area grade is low — what's the realistic commute time and amenity access for the typical tenant pool here? Any planned neighborhood developments (good or bad) we should know about?
- What's the average days-on-market for RENTAL listings here right now (not sales)? A rising rental-DOM trend means longer vacancies and softer asking-rent achievability than the comps imply.
- What's the recent tenant-quality profile in this submarket — average credit score on applications, eviction rate, late-payment / NSF rate, and stable-employment percentage? A property-management company in the area should have these aggregated.
- How much new for-sale + rental construction is in the pipeline within 1–3 miles? Heavy new supply typically softens prices + rents 12–24 months out; constrained supply supports both.
Investment metrics
- 1% rule
- 0.98% ✗
- Cap rate
- 7.29%
- Cash-on-cash
- 3.57%
- DSCR
- 1.16
- GRM
- 8.5
CMA / ARV
- ARV (median comp)
- $411,721
- List price
- $110,000
- Delta
- -73.28%
- Verdict
- UNDERPRICED
- Comps
- 5 within 1.0 mi
Projected returns pro-forma
-3.0% appreciation · 3.0% rent growth · sell at horizon
- IRR
- -10.7%
- Equity multiple
- 0.61×
- Total profit
- $-11,975
- Equity at exit
- $16,401
- IRR
- -1.4%
- Equity multiple
- 0.91×
- Total profit
- $-2,851
- Equity at exit
- $9,511
Cash invested: $30,800 (down + closing). Projections, not guarantees.
Landlord ↔ Tenant lean methodology
- Overall (STATE)
- 62 Landlord-Friendly
- State Pennsylvania
- 62 Landlord-Friendly · EVEN
- County
- — inherits STATE
- City
- — inherits STATE
ZIP-level market 17324
- Home prices YoY
- -4.1%
- Active inventory
- 12
- Price-to-rent
- 8.5×
Monthly cashflow live
- Estimated rent
- $1,078 medium interval (Pro) →
- Mortgage (P&I)
- −$577
- Tax est. 1.5%
- −$138 /mo · $1,650/yr
- Insurance
- −$46
- HOA
- −$0
- Vacancy / Maint / Mgmt
- −$226
- Net cashflow
- $92
Break-even live
Sensitivity live
| Price | -10% $168 | -5% $130 | +0% $92 | +5% $54 | +10% $16 |
|---|---|---|---|---|---|
| Rent | -10% $6 | -5% $49 | +0% $92 | +5% $134 | +10% $177 |
| Rate | -1.0pp $147 | -0.5pp $120 | base $92 | +0.5pp $63 | +1.0pp $34 |
UW: 25.0% down · 7.5% · 30yr · 1.5% tax · 5.0% vac · 8.0% maint · 8.0% mgmt
Financing live
Cash to close
- Down payment
- $27,500
- Closing costs
- $3,300
- Reserves months
- —
- Total cash needed
- —
Loan-product check · same deal, 3 products live
Conventional
25% down · 7.5% · 30yr
- Down + closing
- —
- Monthly P&I
- —
- Monthly cashflow
- —
- DSCR
- —
- Eligible?
- —
Personal DTI + credit; lowest rate.
DSCR
20% down · 8.5% · 30yr
- Down + closing
- —
- Monthly P&I
- —
- Monthly cashflow
- —
- DSCR
- —
- Eligible?
- —
No personal income docs; deal must DSCR.
Hard money
10% down · 12.0% · 12mo
- Down + closing
- —
- Monthly P&I
- —
- Monthly cashflow
- —
- DSCR
- —
- Eligible?
- —
Short-term bridge; refi at stabilization.
Listing history 16 events
-
2026-04-08price $110,000 544-char remark
Show marketing remark (544 chars)
NOTE: This sale is for the modular/manufactured home only! NO REAL ESTATE IS INVOLVED. Buyer is responsible for relocating the home to a location of their choice. Estimate to remove home is $15,000. 2023 Champion Catena II. Structure is 28x64. Very nice 4 bedroom 2 bathroom home with upgrades. This is not your standard manufactured home, with over 1700 sq. ft. and too many upgrades to list. This home is perfect for someone looking to put a quality home on their dream piece of property with a short time frame! Schedule your tour today!
-
2026-03-07price $125,000 544-char remark
Show marketing remark (544 chars)
NOTE: This sale is for the modular/manufactured home only! NO REAL ESTATE IS INVOLVED. Buyer is responsible for relocating the home to a location of their choice. Estimate to remove home is $15,000. 2023 Champion Catena II. Structure is 28x64. Very nice 4 bedroom 2 bathroom home with upgrades. This is not your standard manufactured home, with over 1700 sq. ft. and too many upgrades to list. This home is perfect for someone looking to put a quality home on their dream piece of property with a short time frame! Schedule your tour today!
-
2026-01-23$135,000 Active 544-char remark
Show marketing remark (544 chars)
NOTE: This sale is for the modular/manufactured home only! NO REAL ESTATE IS INVOLVED. Buyer is responsible for relocating the home to a location of their choice. Estimate to remove home is $15,000. 2023 Champion Catena II. Structure is 28x64. Very nice 4 bedroom 2 bathroom home with upgrades. This is not your standard manufactured home, with over 1700 sq. ft. and too many upgrades to list. This home is perfect for someone looking to put a quality home on their dream piece of property with a short time frame! Schedule your tour today!
-
2018-09-28historical
-
2016-04-29historical
-
2016-04-29soldstatus $310,000
-
2016-02-29historical
-
2016-02-07$325,000
-
2016-02-07$325,000
-
2016-02-07$325,000
-
2015-04-16soldstatus $319,000
-
2015-04-14soldstatus $319,000
-
2015-03-10historical
-
2015-03-10historical
-
2014-09-16$325,000
-
2014-09-16$325,000
ⓘ Source: listings_history table (triggers on properties + properties_extension) + one-shot
backfill from property_details.listing_events for pre-trigger history.
Climate risk First Street
- Flood 1/10 Low FEMA zone X (unshaded) · 0% chance over 30 yrs
- Wildfire 3/10 Moderate
- Heat 3/10 Moderate 6 d/yr ≥101°F today · 12 d/yr by 30 yrs out
- Wind 2/10 Low 4% chance of damaging wind over 30 yrs
- Air quality 3/10 Moderate 1 unhealthy d/yr today · 4 by 30 yrs out
Nearby sold comps map
Loading sold comps map…
Walkable amenities ~0.75 mi
Loading nearby amenities…
Taxation est. · year 1
- Rental income
- $12,938
- − Mortgage interest
- −$6,162
- − Property taxes
- −$1,650
- − Insurance
- −$550
- − Repairs & maintenance
- −$1,035
- − Management
- −$1,035
- − Depreciation
- −$3,200
- Taxable loss
- −$694
- Est. tax savings @ 24.0%
- +$166
- After-tax cash flow
- $1,265/yr
For passive investors: Depreciation is non-cash, so a rental often shows a tax loss while cash-flowing — sheltering income. Rental losses are passive: they offset passive income freely, and up to $25,000/yr can offset ordinary (W-2) income if you actively participate and your MAGI is under $100k (phasing out to $0 by $150k); unused losses carry forward. On sale, claimed depreciation is recaptured at up to 25%, and gains may owe capital-gains tax (a 1031 exchange can defer both). Figures are a year-1 estimate at your 24.0% rate — not tax advice; consult a CPA.
Schools (NCES district)
- District
- Bermudian Springs SD
- NCES district ID
- 4203450
- Math proficiency
- 36% ▼ -12.00%
- Reading proficiency
- 55% ▼ -11.00%
- Median HH income
- $63,162
- Composite
- 40.24/100
- National rank
- #3772
- State rank
- #238 of 539 in PA
Livability — York Springs
- Score
- 74/100
- State rank
- #513
- US rank
- #4725
Category grades
Schools grade is shown separately in the Schools card above.
Census & demographics
- Population (ZIP)
- 4,469
Population outlook (Adams County) Hauer SSP2
- Today (2025)
- 102,494 people
- By 2030
- 101,890 · -0.6%
- By 2040
- 98,417 · -4.0%
- By 2050
- 92,014 · -10.2%
- By 2075
- 76,128 · -25.7%
- By 2100
- 58,931 · -42.5%
Race, ethnicity, and origin ACS 2023
- Neighborhood character
- Predominantly White (90%)
- Race & ethnicity
- White 90% Hispanic / Latino 7% Two or more races 5%
- Hispanic origin (detail)
- Mexican 4% Puerto Rican 3%
- Common ancestry
- Polish 3% Romanian 2% Serbian 2%
- Foreign-born
- 2% · Canada
- Languages at home
- 95% English-only · Spanish 5%
Political lean MEDSL · Adams
- 2024 margin
- Solid R (+33.6) · D 32.7% · R 66.4%
- 2008→2024 swing
- -14.1pp toward R · 2008: -19.6pp · 2024: -33.6pp
- All cycles
- 2024: R+33.6 2020: R+34.1 2016: R+36.4 2012: R+27.6 2008: R+19.6
Not yet ingested
- Civics
- —
Market trends
- HPI YoY
- ▼ -12.80%
- Current HPI
- 300.5724
- Rent YoY
- —
- Metro
- —
- State GDP YoY
- ▲ 1.68%
- F500 in state
- 34
Industry mix (Fortune 500 HQ in PA)
| Industry | F500 HQs | Revenue |
|---|---|---|
| Healthcare | 2 | $309B |
|
||
| Insurance | 2 | $27B |
|
||
| Telecommunications / Media | 1 | $124B |
|
||
| Industrial Distribution | 1 | $22B |
|
||
| Financial Services | 1 | $20B |
|
||
| Chemicals / Materials | 1 | $18B |
|
||
Price history
-66.2% since first listed16 events — show timeline
- 2026-04-08 Price Changed $110,000 BRIGHT MLS
- 2026-03-07 Price Changed $125,000 BRIGHT MLS
- 2026-01-23 Listed $135,000 BRIGHT MLS
- 2018-09-28 Listing Removed — BRIGHT MLS
- 2016-04-29 Sold (MLS) $310,000 BRIGHT MLS
- 2016-04-29 Listing Removed — BRIGHT MLS
- 2016-02-29 Listing Removed — BRIGHT MLS
- 2016-02-07 Listed $325,000 BRIGHT MLS
- 2016-02-07 Listed $325,000 BRIGHT MLS
- 2016-02-07 Listed $325,000 BRIGHT MLS
- 2015-04-16 Sold (MLS) $319,000 BRIGHT MLS
- 2015-04-14 Sold (MLS) $319,000 BRIGHT MLS
- 2015-03-10 Listing Removed — BRIGHT MLS
- 2015-03-10 Listing Removed — BRIGHT MLS
- 2014-09-16 Listed $325,000 BRIGHT MLS
- 2014-09-16 Listed $325,000 BRIGHT MLS
Property tax history
+4.5%/yrLatest (2026): $7,333 · +2.5% YoY. Source: county tax records.
Cash-flow waterfall
monthlySold comps — $/sqft
last 12 mo · ≤1 miLoading sold comps…