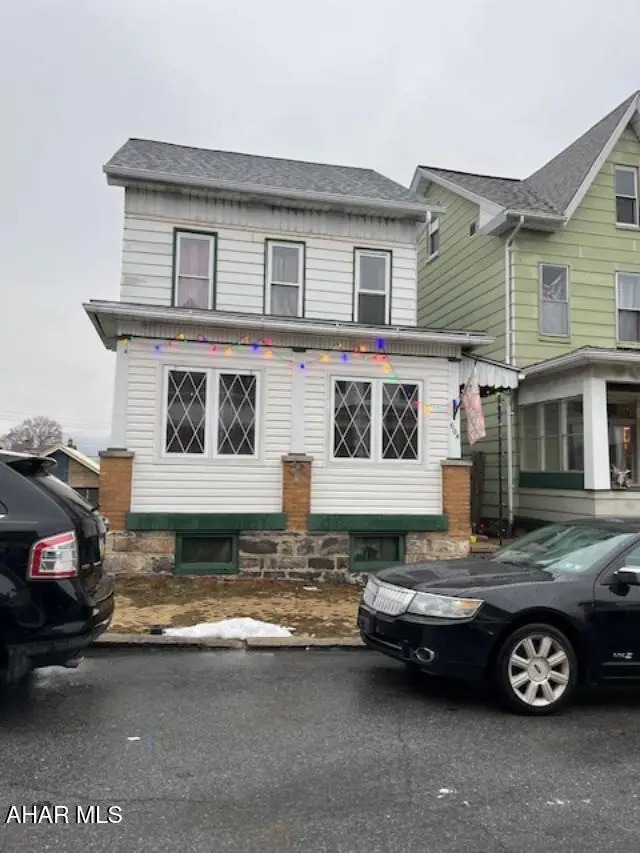
604 1st Ave · Altoona, PA
Flood risk 1/10 · Minimal
- FEMA flood zone
- X (unshaded)
- Chance of flooding over 30 yrs
- 0.0%
- Est. flood insurance / yr
- $507 – $1,088
Fire risk 3/10 · Minor
- Est. fire insurance / yr
- $511 – $949
Heat risk 3/10 · Minor
- Hot days now (above 90°F)
- 7 days/yr
- Hot days in 30 yrs
- 18 days/yr
Wind risk 2/10 · Minimal
- Chance of severe wind over 30 yrs
- —
Air-quality risk 2/10 · Minimal
- Unhealthy air days now
- 1 days/yr
- Unhealthy air days in 30 yrs
- 3 days/yr
Risk factors via First Street. Map © Google.
Why this score? — see what drove the B grade
The composite is a weighted blend of 9 inputs, each scored 0–100. Each bar is that input's sub-score; the figure is the points it added to the 100-point composite (weight × sub-score).
- Cash flow +30.0/30.0
- ARV discount +15.0/15.0
- DSCR +10.0/10.0
- 1% rule +7.8/10.0
- Livability +4.0/5.0
- Schools +3.1/10.0
- Rent growth +2.5/5.0
- Condition / age +2.5/5.0
- Appreciation +0.0/10.0
$89,900
🖨 Deal sheet (PDF) 📄 Offer letter ✓ Due diligence
Listing remarks MLS
Large 4 bedroom house, needs updated
Key facts
- Laminate flooring
- Double lot
- Shingle roof
Tags
Property features AI
Exterior
- Parking: Detached 2-car garage
- Utilities: Public water
- Home design: Single-family residence; Updated/remodeled; Three or more stories
- Construction: Aluminum siding; Shingle roof
- Exterior features: Front porch; Cleared, level lot; 50 ft frontage
Interior
- Kitchen: Range; Refrigerator
- Flooring: Laminate; Vinyl
- Bathrooms: 1 full bathroom
- Heating & cooling: Natural gas heating; Hot water heating
- Interior features: Eat-in kitchen; Basement
Neighborhood map
What this means for you Summary
Snapshot
- This is a 4-bed/1.0-bath single-family listed at $90k.
Deal economics
- At list price, monthly cash flow is $343 ($4k/yr) — positive.
- The deal already cash-flows at list — no discount required.
- Meets the 1% rule at list price ($1k rent vs $90k).
- Cap rate 10.9% vs local median 5.9% in Altoona — top-decile yield for the area; either an underpriced asset or a hidden risk that comps aren't pricing in. Stress-test before assuming the spread holds.
Location & tenants
- Location reads 79/100 on livability (#237 in PA, #2,060 nationally) — a middle-class / working-renter tenant base. Strengths: commute A+, cost of living A+, housing A+; Watch: crime C-, employment D, amenities F.
- Altoona Area SD (urban): math 30% / reading 44% proficiency, ranked #406 of 539 in PA (top 75%) — families likely to look elsewhere, expect single-tenant / working-renter base with shorter leases.
- Zoned schools: Altoona Area Jr Hs (math 21% / reading 45%, grade F, #346 of 512 statewide, top 69%, 1,727 students, 71% FRL) — zoned schools average 71% FRL vs 54% district-wide (16 pts higher); higher-poverty schools than district average — tighter screening recommended.
- Market conditions: 151 active listings in the ZIP; 6 comparable units currently listed for rent nearby; rentals lingering (median 46d on market — plan ~5-8 weeks vacancy on turnover, expect pricing pressure); 100% of comp listings sitting > 30 days — soft ceiling on asking rent; 99 units permitted in Blair County in 2024 (0 in 5+ unit buildings).
Forward outlook
- Local home prices are declining (-3.0%/yr); year-one equity from $622 of loan paydown is wiped out by about $3k of value loss. Plan a longer hold.
- Blair County population projected at -18% by 2050 — secular population decline; favor cash flow + early exit over multi-decade hold.
- At projected returns (-3.0% appreciation + 3.0% rent growth), your $25k cash investment doubles in ~8 years — after that, you're playing with house money.
Negotiation context
- Only 2 days on market — expect competitive offers; lowballing is unlikely to land.
- 2 sale attempts since 16y ago with the ask held roughly flat each time — persistent listings suggest the price (not the market) is what's stuck; bring a comps-based counter.
- Current owner paid $24k; list at $90k implies a 267% gain — meaningful room to come down on a strong offer.
Risks & watch-outs
- Watch-outs: built in 1900 — expect roof / HVAC / electrical / plumbing capex.
Questions for the listing agent
- Built in 1900 — when were the roof, HVAC, electrical panel, plumbing, and water heater last replaced?
- Is there a deadline driving the sale (1031 exchange, divorce, estate, relocation)? That informs how much negotiation room exists.
- Schools are B-rated — typically a magnet for longer-tenancy family renters. What's the average tenant stay here, and is there a school-zone premium baked into asking?
- What's the average days-on-market for RENTAL listings here right now (not sales)? A rising rental-DOM trend means longer vacancies and softer asking-rent achievability than the comps imply.
- What's the recent tenant-quality profile in this submarket — average credit score on applications, eviction rate, late-payment / NSF rate, and stable-employment percentage? A property-management company in the area should have these aggregated.
- How much new for-sale + rental construction is in the pipeline within 1–3 miles? Heavy new supply typically softens prices + rents 12–24 months out; constrained supply supports both.
Investment metrics
- 1% rule
- 1.28% ✓
- Cap rate
- 10.87%
- Cash-on-cash
- 16.36%
- DSCR
- 1.73
- GRM
- 6.5
CMA / ARV
- ARV (on-the-fly)
- $115,236
- Comps found
- 12
Show comp detail 12 sales within ~0.75 mi
| Address | Dist | Beds/Ba | Sqft | Sold | Price | $/sf | Match |
|---|---|---|---|---|---|---|---|
| 604 1st Ave | 0.00mi | 4/1.0 | 1,746 (0%) | 0mo | $80,000 | $46 | 100 |
| 508-512 5th Ave | 0.24mi | 3/1.0 (-1) | 1,755 (+0%) | 2mo | $75,000 | $43 | 82 |
| 105 1st Ave | 0.43mi | 4/1.5 | 1,795 (+3%) | 0mo | $109,900 | $61 | 73 |
| 818 Bell Ave | 0.20mi | 3/1.5 (-1) | 1,632 (-6%) | 2mo | $135,000 | $83 | 71 |
| 215 Logan Blvd | 0.45mi | 3/1.5 (-1) | 1,768 (+1%) | 2mo | $200,000 | $113 | 69 |
| 1022 1st Ave | 0.34mi | 3/1.5 (-1) | 1,850 (+6%) | 2mo | $122,000 | $66 | 66 |
| 125 E 4th Ave | 0.53mi | 3/1.5 (-1) | 1,708 (-2%) | 1mo | $27,000 | $16 | 64 |
| 312 E Walton Ave | 0.67mi | 4/1.5 | 1,785 (+2%) | 1mo | $115,000 | $64 | 63 |
| 414 Grant Ave | 0.28mi | 3/1.0 (-1) | 1,518 (-13%) | 2mo | $110,000 | $72 | 59 |
| 110 E Hudson Ave | 0.60mi | 3/2.0 (-1) | 1,710 (-2%) | 2mo | $206,000 | $120 | 58 |
| 210 Crawford Ave | 0.34mi | 3/2.0 (-1) | 1,530 (-12%) | 1mo | $145,000 | $95 | 54 |
| 1500 3rd Ave | 0.68mi | 4/1.5 | 2,005 (+15%) | 1mo | $66,500 | $33 | 40 |
Match score weights: distance 35% · size 25% · config 20% · recency 20%. Top-matched comps best support the ARV.
Projected returns pro-forma
-3.0% appreciation · 3.0% rent growth · sell at horizon
- IRR
- 7.4%
- Equity multiple
- 1.29×
- Total profit
- $7,272
- Equity at exit
- $13,404
- IRR
- 16.7%
- Equity multiple
- 2.37×
- Total profit
- $34,407
- Equity at exit
- $7,773
Cash invested: $25,172 (down + closing). Projections, not guarantees.
Landlord ↔ Tenant lean methodology
- Overall (STATE)
- 62 Landlord-Friendly
- State Pennsylvania
- 62 Landlord-Friendly · EVEN
- County
- — inherits STATE
- City
- — inherits STATE
ZIP-level market 16602
- Home prices YoY
- -30.3%
- Active inventory
- 151
- Price-to-rent
- 6.5×
Monthly cashflow live
- Estimated rent
- $1,150 high interval (Pro) →
- Mortgage (P&I)
- −$471
- Tax from tax record
- −$56 /mo · $676/yr
- Insurance
- −$37
- HOA
- −$0
- Vacancy / Maint / Mgmt
- −$241
- Net cashflow
- $343
Break-even live
Sensitivity live
| Price | -10% $394 | -5% $369 | +0% $343 | +5% $318 | +10% $292 |
|---|---|---|---|---|---|
| Rent | -10% $252 | -5% $298 | +0% $343 | +5% $389 | +10% $434 |
| Rate | -1.0pp $388 | -0.5pp $366 | base $343 | +0.5pp $320 | +1.0pp $296 |
UW: 25.0% down · 7.5% · 30yr · 1.5% tax · 5.0% vac · 8.0% maint · 8.0% mgmt
Financing live
Cash to close
- Down payment
- $22,475
- Closing costs
- $2,697
- Reserves months
- —
- Total cash needed
- —
Loan-product check · same deal, 3 products live
Conventional
25% down · 7.5% · 30yr
- Down + closing
- —
- Monthly P&I
- —
- Monthly cashflow
- —
- DSCR
- —
- Eligible?
- —
Personal DTI + credit; lowest rate.
DSCR
20% down · 8.5% · 30yr
- Down + closing
- —
- Monthly P&I
- —
- Monthly cashflow
- —
- DSCR
- —
- Eligible?
- —
No personal income docs; deal must DSCR.
Hard money
10% down · 12.0% · 12mo
- Down + closing
- —
- Monthly P&I
- —
- Monthly cashflow
- —
- DSCR
- —
- Eligible?
- —
Short-term bridge; refi at stabilization.
Rent comps 6 comps
| Address | Beds | Baths | Sqft | Rent | $/sqft | DOM | Units | Dist |
|---|---|---|---|---|---|---|---|---|
| 201 2nd Ave Unit 2nd Fl Altoona, PA | 3.0 | 1.0 | 1244 | $790 | $0.64 | 45d | 1 | 0.36mi |
| 1326 14th Ave Altoona, PA | 3.0 | 1.0 | 1600 | $1,150 | $0.72 | 45d | 1 | 0.96mi |
| 1102 17th Ave Altoona, PA | 3.0 | 1.0 | 1430 | $899 | $0.63 | 45d | 1 | 0.99mi |
| 1101 E Walton Ave Altoona, PA | 2.0–3.0 | 1.0–1.5 | 975 | $1,605 | $1.65 | 45d | 9 | 1.23mi |
| 2015 12th Ave Altoona, PA | 3.0 | 1.0 | 1600 | $1,200 | $0.75 | 45d | 1 | 1.33mi |
| 1489 Washington Ave Altoona, PA | 3.0 | 1.5 | 1050 | $850 | $0.81 | 45d | 1 | 1.34mi |
Listing history 5 events
-
2026-05-13status Pending
-
2026-05-11$89,900 Active
-
2011-06-23soldstatus $24,500 36-char remark
Show marketing remark (36 chars)
Large 4 bedroom house, needs updated
-
2011-06-23soldstatus $24,500
Show marketing remark (36 chars)
Large 4 bedroom house, needs updated
-
2010-04-21$29,000 36-char remark
Show marketing remark (36 chars)
Large 4 bedroom house, needs updated
ⓘ Source: listings_history table (triggers on properties + properties_extension) + one-shot
backfill from property_details.listing_events for pre-trigger history.
Tax reassessment forecast PA · Partial reset (capped growth)
- Current annual tax
- $676 · $56/mo
- Projected year-2 tax
- $1,048 · $87/mo
- Expected delta
- +$372/yr (+$31/mo · 55.0%)
ⓘ Screening estimate from a state-policy table — verify with the county assessor before closing.
Climate risk First Street
- Flood 1/10 Low FEMA zone X (unshaded) · 0% chance over 30 yrs
- Wildfire 3/10 Moderate
- Heat 3/10 Moderate 7 d/yr ≥90°F today · 18 d/yr by 30 yrs out
- Wind 2/10 Low
- Air quality 2/10 Low 1 unhealthy d/yr today · 3 by 30 yrs out
Nearby sold comps map
Loading sold comps map…
Walkable amenities ~0.75 mi
Loading nearby amenities…
Taxation est. · year 1
- Rental income
- $13,799
- − Mortgage interest
- −$5,036
- − Property taxes
- −$676
- − Insurance
- −$450
- − Repairs & maintenance
- −$1,104
- − Management
- −$1,104
- − Depreciation
- −$2,615
- Taxable income
- $2,814
- Est. tax owed @ 24.0%
- −$675
- After-tax cash flow
- $3,443/yr
For passive investors: Depreciation is non-cash, so a rental often shows a tax loss while cash-flowing — sheltering income. Rental losses are passive: they offset passive income freely, and up to $25,000/yr can offset ordinary (W-2) income if you actively participate and your MAGI is under $100k (phasing out to $0 by $150k); unused losses carry forward. On sale, claimed depreciation is recaptured at up to 25%, and gains may owe capital-gains tax (a 1031 exchange can defer both). Figures are a year-1 estimate at your 24.0% rate — not tax advice; consult a CPA.
Schools (NCES district)
- District
- Altoona Area SD
- NCES district ID
- 4202340
- Math proficiency
- 30% ▼ -15.00%
- Reading proficiency
- 44% ▼ -15.00%
- Median HH income
- $38,465
- Composite
- 30.85/100
- National rank
- #6130
- State rank
- #406 of 539 in PA
Livability — Altoona
- Score
- 79/100
- State rank
- #237
- US rank
- #2060
Category grades
Schools grade is shown separately in the Schools card above.
Census & demographics
- Census place
- Altoona, PA
- County
- Blair County · 59,867 people
- City population
- 59,867
- Metro
- Altoona, PA
- Population (ZIP)
- 26,352
- Household income
- $55,046
- Rent vs Own
- Severe rent burden
- 740.0
Population outlook (Blair County) Hauer SSP2
- Today (2025)
- 121,571 people
- By 2030
- 117,966 · -3.0%
- By 2040
- 109,174 · -10.2%
- By 2050
- 99,542 · -18.1%
- By 2075
- 76,775 · -36.8%
- By 2100
- 54,326 · -55.3%
Race, ethnicity, and origin ACS 2023
- Neighborhood character
- Predominantly White (90%)
- Race & ethnicity
- White 90% Two or more races 5% Black 3% Hispanic / Latino 2%
- Common ancestry
- Romanian 4% Lithuanian 1% Italian 1%
- Foreign-born
- 2% · Canada
- Languages at home
- 97% English-only · Spanish 1%
Political lean MEDSL · Blair
- 2024 margin
- Solid R (+43.5) · D 27.9% · R 71.4%
- 2008→2024 swing
- -19.2pp toward R · 2008: -24.3pp · 2024: -43.5pp
- All cycles
- 2024: R+43.5 2020: R+43.5 2016: R+46.4 2012: R+33.5 2008: R+24.3
Not yet ingested
- Civics
- —
Market trends
- HPI YoY
- ▼ -92.37%
- Current HPI
- 212.2268
- Rent YoY
- —
- Metro
- Altoona, PA
- State GDP YoY
- ▲ 1.68%
- F500 in state
- 34
Industry mix (Fortune 500 HQ in PA)
| Industry | F500 HQs | Revenue |
|---|---|---|
| Healthcare | 2 | $309B |
|
||
| Insurance | 2 | $27B |
|
||
| Telecommunications / Media | 1 | $124B |
|
||
| Industrial Distribution | 1 | $22B |
|
||
| Financial Services | 1 | $20B |
|
||
| Chemicals / Materials | 1 | $18B |
|
||
Price history
+210.0% since first listed5 events — show timeline
- 2026-05-13 Pending — AHARMLS
- 2026-05-11 Listed $89,900 AHARMLS
- 2011-06-23 Sold (Public Records) $24,500 Public Records
- 2011-06-23 Sold (MLS) $24,500 AHARMLS
- 2010-04-21 Listed $29,000 AHARMLS
Property tax history
-9.1%/yrLatest (2025): $676 · +13.0% YoY. Source: county tax records.
Cash-flow waterfall
monthlySold comps — $/sqft
last 12 mo · ≤1 miLoading sold comps…